Transcription
Analysis of Election Systems for theBeaverton, OR School DistrictMGGG Redistricting LabContents1Introduction12Districted Analysis43Ranked Choice Voting (RCV) Analysis3.1 Models and voting scenarios . . . . . . . . . . . . . . . . . . . . . . . . . . . . . . . .3.2 Results . . . . . . . . . . . . . . . . . . . . . . . . . . . . . . . . . . . . . . . . . . .6674Conclusion9ContributorsAmy Becker, Moon Duchin, Dara Gold and Thomas Weighill contributed to the data collectionand preparation, data analysis, and writing of this report.Version 0.0 July 23, 2021
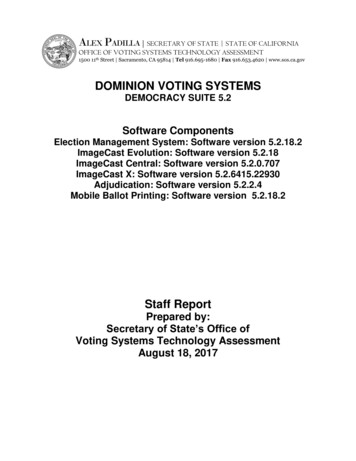
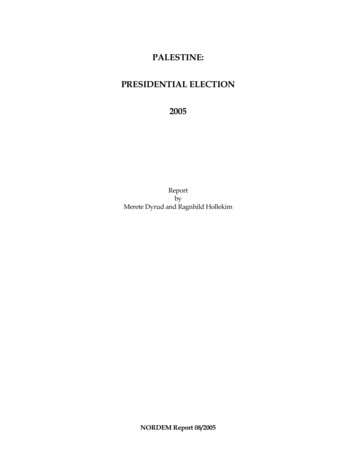
1. Introduction1 IntroductionBeaverton School District 48J (hereafter, the School District) had 255,082 residents as of the 2010Census. Table 1 shows the demographic breakdown of the district by total population, Voting AgePopulation (VAP), Citizen Voting Age Population (CVAP), and Students enrolled in Beaverton SchoolDistrict. The district has two sizable minority groups: Latino residents (who constitute 10.7% of VAPand 7.95% of CVAP) and Asian residents (who constitute 11.7% of VAP and 10.02% of CVAP). We usethe term POC (people of color) to refer to residents who are Hispanic or have selected a non-Whiterace in the Census (or both). In total the POC share of CVAP is 24.24%. The distribution of POCresidents across the School District is shown in Figure 1.The School District is divided into 7 zones, each of which is represented by one member of theSchool Board. School Board members serve 4 year terms and must live in the zone they represent.However voters from the entire district can vote in all zone elections. This means that even if azone is majority POC, they could be unable to elect their candidate of choice in their zone if votingdistrict-wide is highly racially polarized. This is because white voters from across the district wouldstill outnumber POC voters. Figure 3 shows the current members of the Board, which includes onemember of color.We emphasize that board members who are themselves people of color may not necessarily havebeen the candidates preferred by POC voters. POC candidates of choice can come from any racialor ethnic group. In the absence of accurate voter preference data, we use the School Board’s racialmakeup as an imperfect proxy for representation. Furthermore, we know that no community votesas a monolith, and we take care to consider a range of candidate support and voting polarizationlevels in this report.One way to provide more minority opportunity on the School Board would be to use a traditionaldistricted system, or one in which board members still represent one zone, but voting is restrictedonly to residents of that zone. Alternatively, a switch to district-wide Ranked Choice Voting (RCV),in which multiple candidates are ranked on each ballot, can promote more proportional representation for minority voters given adequate turnout and candidate availability.In this report we consider two alternative options: (1) zoned (instead of district-wide) electionswith new zone boundaries, and (2) ranked choice voting.RaceWhiteLatinoAsianBlackOtherTotal PeopleShare of Total Population68.4%13.14%11.8%2.07%4.59%255,082Share of VAP72.47%10.72%11.69%1.92%3.20%191,464Share of CVAP75.76%7.95%10.02%2.36%3.91%188,197Share of Students47.0%25.0%16.3%3.0%8.7%41,070Table 1. Total population, Voting Age Population (VAP) and Citizen Voting Age Population (CVAP)by race in the Beaverton School District. Total population and VAP data is from the 2010 Census,and CVAP data is from the 2018 ACS 5-year rolling average. Student demographics are from theUS News and World Report school district profiles: cts/beaverton-sd-48j-1003701
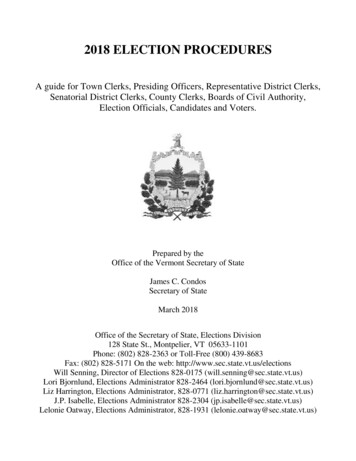
1. IntroductionPOC-VAPPOC-CVAPFigure 1. POC-VAP and POC-CVAP by block in the Beaverton School District. Note that CVAP byrace is disaggregated to blocks from the block group level (the smallest unit for which this datais available). This process requires assumptions to be made about how the CVAP is distributedacross the block group that likely differ from the true, unknown, geographic distribution of CVAP.Figure 2. Beaverton School Board Zones as of October 20182
1. Introduction(a) Susan Greenberg, Zone 1(b) Anne Bryan, Zone 2(c) Eric Simpson, Zone 3(d) Donna Tyner, Zone 4(e) LeeAnn Larson, Zone 5(f) Becky Tymchuk, Zone 6(g) Tom Colett, Zone 7Figure 3. The Beaverton School Board as of September 2020. Each board member represents oneof seven zones, but are elected district-wide.3
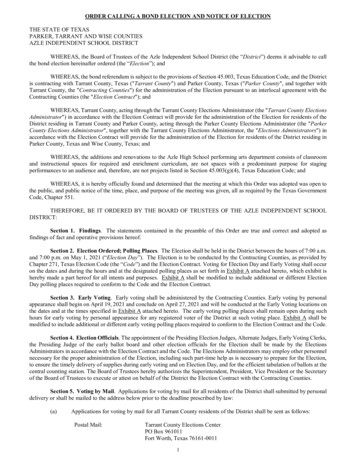
2. Districted Analysis2 Districted AnalysisFirst, we consider traditional districted elections for the School Board. That is, replacing the currentsystem by re-drawing zone boundaries and limiting the vote for each zone to its own residents.While a cohesive minority group may be too small to elect a candidate of choice in a school-districtwide, at-large election, they may be geographically distributed in such a way as to make up a largeshare of a local zone, allowing them to elect their candidate of choice.In this section we evaluate 7-member boards (i.e. the current board size) elected instead by adistricted system. We generated a large collection of districting plans with the goal of identifyingmaps with high-percentage-minority zones. To do this, we ran 100,000 steps of a ReCom1 Markovchain, which takes into account only contiguity, compactness, and population deviation. We allowed zones to deviate by no more than 5% from the ideal population, in accordance with legalstandards for local zones. Proposed plans that satisfied these basic constraints were probabilistically accepted for inclusion in our ensemble, or collection of alternative plans, with a probabilitydepending on their largest minority zone (the zone with the highest POC share of total CVAP): Ifa newly proposed plan’s highest-proportion minority zone had a higher POC share than that of itspredecessor plan’s, it had a very high probability of being included, but if its highest-proportionPOC zone had a lower POC-share, it had a very low probability of being included. This probabilistic inclusion created a guided chain run that targeted plans with concentrated POC zones. Theseheuristic optimization techniques are quite successful in identifying strong plans, but are not guaranteed to identify the best possible plans (finding such a global optimum is often computationallyintractable).Figure 4 shows the best plans found by these techniques. The highest percentage POC-CVAPzone found was 36.72%. When instead targeting plans with high POC-VAP (rather than high POCCVAP), we were able to find plans that came much closer to—but that ultimately still fell shortof—the 50% mark. We identified a plan with a reasonably compact zone that had 46.79% POC-VAP,and when compactness was relaxed the highest zone POC-VAP found was 48.30% (see Figure 4).Because CVAP better captures actual eligible voting populations, it is unlikely that a plan canbe drawn with even close to a majority POC-voter zone. That is, even with a high degree of POCturnout and voter cohesion none of the plans we identified would be likely to perform for POCvoters without high levels of White crossover voting (i.e. White voters’ support for POC-preferredcandidates).Moreover, even if the lines are carefully drawn to capture population patterns at one moment intime, movement of population over the course of a decennial Census cycle makes the performanceless secure in the future. Ultimately, switching to a traditional districted system is unlikely to bereliable way of ensuring POC-representation on the School Board.1 https://mggg.org/uploads/ReCom.pdf4
2. Districted Analysis(a) Map with highest zone POC-CVAP identified:36.72%(b) Map identified with reasonably compact zonewith high POC-VAP: 46.79%(c) Map with highest zone POC-VAP identified: 48.3%Figure 4. Results of techniques targeting identification of zones with high POC-CVAP and POCVAP. While these techniques can identify zones that are nearly 50% POC-VAP, they were unableto identify zones even close to a 50% POC-CVAP.5
3. Ranked Choice Voting (RCV) Analysis3 Ranked Choice Voting (RCV) AnalysisAs an alternative to re-zoning, we consider the prospects for ranked choice voting (RCV) to electthe Beaverton School Board. If a standard single-transferable vote system with m 7 seats were1implemented, then the threshold for election would be m 1 18 12.5% of the votes. In otherwords, in this RCV system, any candidate who is the first choice of 12.5% of the voting populationwould be immediately elected to the school board, and someone can easily be elected with just 810% of the first-place votes if they are frequently ranked second or third by enough voters. Since24.24% of CVAP (27.53% of VAP) consists of people of color, RCV is likely to provide a more secureopportunity to elect candidates of choice for POC communities.Because RCV is not currently used for many elections in the Pacific Northwest2 , we are not ableto estimate RCV outcomes using ranking data from past elections. Instead, our analysis must usemodels of ranked choice voting behavior to simulate how RCV could perform in various scenarios.3.1 Models and voting scenariosWe use four different models to estimate minority representation under ranked choice voting forPOC voters in the School District. All four models take a simple input consisting of three values: (1)the support from POC voters for POC candidates, (2) the support from White voters for POC candidates and (3) POC share of total CVAP. The Plackett-Luce (PL) and Bradley-Terry (BT) models rely onclassical probabilistic forms of ranking, using what is called a Dirichlet distribution to allocate support to candidates within each group. The Alternating Crossover (AC) and Cambridge Sampler (CS)models are newly designed for this analysis. For these, we use estimated probabilities for whethervoters will rank a White or POC candidate first, then rely on specific assumptions on how the rest ofthe ballot will be completed. The AC model assumes that voters are either bloc voters or alternate intheir support. For instance, a POC voter may vote CCCWWW, ranking all candidates of color aboveall White candidates, or else WCWCWC. The CS model uses ballot data from a decade’s worth ofranked choice city council ballots in Cambridge, MA. Each voter’s first choice is filled in with support estimates, and then their subsequent ballot is drawn at random from the observed ballot typesin Cambridge.We also consider five scenarios of how voters divide their support among White and POC candidates. Scenario A: Unanimous Order. All voters agree on who are the strongest candidates in eachgroup. Scenario B: POC vary POC. POC voters vary preferences among POC candidates. Scenario C: All Vary Order. No agreement on strongest candidates. Scenario D: White Vary Order. White voters don’t agree on strongest candidates. Scenario E: Generic. All levels of agreement equally likely.Finally, we consider the effect of candidate availability by comparing two different candidatepools.2 To date, the only known election to use RCV in the Pacific Northwest was the November 2020 County Commissionerrace in Benton County, Oregon unty/).6
3.2Results Balanced Pool: 7 POC candidates and 7 White candidates run for office Unbalanced Pool: 3 POC candidates and 7 White candidates run for officeThese RCV models require estimates for the rate at which POC and White voters support POCcandidates. Typically, we would want to use local single-winner elections to estimate these levels ofsupport. However, precise estimates (with a high degree of confidence) are not always available—especially for jurisdictions with low turnout and a small number of precincts. We consider four hypothetical levels of polarization: Category 1 Polarization, where the support from POC and Whitevoters for POC candidates is 95% and 5% respectively, Category 2 Polarization, where the supportfrom POC and White voters for POC candidates is 90% and 20% respectively, Category 3 Polarization, where the support from POC and White voters for POC candidates is 75% and 20% respectively,and Category 4 Polarization, where the support from POC and White voters for POC candidates is60% and 40% respectively.Finally, the RCV models require estimates for the proportions of POC and White voters. We useCVAP for these values. That is, we assume that the proportion of POC voters is roughly equivalentto the proportion of POC citizens of voting age, namely 24.24%. These estimates make the implicitassumption that voter turnout is comparable for White and POC voters, which might not reflectactual voting behaviors. We note that substantially different turnout rates for White and POC votersmay affect the following model results.3.2 ResultsFor every combination of model, scenario, and candidate pool, we simulate 100 ranked choice elections, count how many POC candidates are elected in each trial, and compute the average acrosselections. The results are reported in Table 2 below.Across all model scenarios, polarization categories and candidate pools, POC-preferred candidates are shut out in only three cases: Scenario C in the balanced candidate pool for the CambridgeSampler (CS) under polarization Categories 1, 2, and 3. Recall these cases represent little or modest support for POC candidates from White crossover voters, 7 POC candidates running, and noconsensus on which of these candidates are the strongest3 .Otherwise results across the board are promising: we typically expect 1-3 POC candidates to beelected. A higher number of POC winners are predicted in Category 4 Polarization cases due tohigher support from White voters.However, we emphasize that the support estimates used here are hypothetical values that arean imperfect reflection of local voting behavior in the school district.3 We can observe that the Cambridge sampler has the greatest variability over the voter behavior scenarios. This is because it is drawn from actual votes, and they display a high frequency of “bullet voting," in which the voter selects onlyone candidate and leaves the rest of the ballot blank. Bullet voting can nullify the proportionality effects of ranked choicebecause the ballot is quickly exhausted, with nowhere to transfer the vote.7
Category 4 Polarization(POC: 60%, W: 40%)Category 3 Polarization(POC: 75%, W: 20%)Category 2 Polarization(POC: 90%, W: 20%)Category 1 Polarization(POC: 95%, W: 5%)3.2PLBTACCS7 At-Large RCV; Balanced PoolScenario B Scenario C Scenario D2.31.71.52.01.21.12.01.11.03.00.01.07 At-Large RCV; Unbalanced PoolScenario A Scenario B Scenario C Scenario LBTACCSScenario A3.13.02.03.0PLBTACCSScenario A2.22.02.02.9PLBTACCS7 At-Large RCV; Balanced PoolScenario B Scenario C Scenario D3.12.52.22.92.01.92.62.01.93.00.11.17 At-Large RCV; Unbalanced PoolScenario A Scenario B Scenario C Scenario LBTACCSScenario A3.02.82.02.9PLBTACCS7 At-Large RCV; Balanced PoolScenario B Scenario C Scenario D2.92.11.92.92.01.72.01.01.03.00.01.07 At-Large RCV; Unbalanced PoolScenario A Scenario B Scenario C Scenario LBTACCSScenario A3.23.43.03.0PLBTACCS7 At-Large RCV; Balanced PoolScenario B Scenario C Scenario D3.33.03.13.33.03.13.01.91.03.01.21.77 At-Large RCV; Unbalanced PoolScenario A Scenario B Scenario C Scenario esultsScenario E1.91.41.51.7Scenario E1.91.62.02.1Scenario E2.72.52.11.8Scenario E2.62.52.22.7Scenario E2.52.41.51.7Scenario E2.42.52.02.7Scenario E3.13.22.22.2Scenario E2.72.72.93.0Table 2. Using POC CVAP, this table shows the expected number of POC-preferred candidateselected under ranked choice to fill 7 seats on the school board.8
4. Conclusion4 ConclusionIn this report, we estimated the opportunity for POC voters to elect candidates of choice under twodifferent voting systems: districted and RCV. These results are summarized in Figure 5. For reference, Figure 5 also shows the number of current seats held by board members who are themselvespeople of color, as an imperfect proxy for POC voter representation on the School Board.We considered a districted system that still has 7 zones, but in which voting is restricted to eachzone. If the zone boundaries are re-drawn we are able to find zones with up to to 36.72% POCCVAP. Even with using POC-VAP and relaxing compactness criteria, we were only able to find zoneswith 48.3% POC-VAP. As we can’t find a safely majority POC district using either CVAP or VAP, weconclude that a districted system would be unlikely to guarantee POC electoral opportunity withouta high degree of White crossover voting.On the other hand, our ranked choice analysis suggests that, whether voting is highly polarized or follows more moderate patterns, an RCV election system could enable POC voters in theBeaverton School District to elect 1-3 candidates of choice to the school board. In fact, the POCshare of overall population is 31.6%, so the proportional share of a seven-member school board isroughly 2.2 seats. Under most models and scenarios considered here, ranked choice would securean expectation that approaches or even exceeds this proportion.Figure 5. Summary of expected POC seat shares for alternative voting systems.9
Beaverton School District 48J (herea er, the School District) had 255,082 residents as of the 2010 . The School District is divided into 7 zones, each of which is represented by one member of the School Board. School Board members serve 4 year terms and must live in the zone they represent.