Transcription
High Price of Mandatory Auto Insurance inPredominantly African American CommunitiesNovember 2015Tom Feltner, Director of Financial ServicesDouglas Heller, Consumer Advocate
High Price of Mandatory Auto Insurance in Predominately African American CommunitiesIntroductionAll states except New Hampshire require drivers to purchase auto insurance, and the importance ofautomobile ownership for most Americans adds a special responsibility to ensure fairness in theauto insurance marketplace.1 In previous analyses, the Consumer Federation of America (CFA) hasinvestigated the affordability of auto insurance and researched pricing practices in the autoinsurance market. That work identified the effect of the widespread use of non-driving ratingfactors used to set premiums, including the use of socio-economic characteristics such as level ofeducation, occupation and others that unfairly discriminate against low- and moderate-incomegood drivers.For this report, CFA looked at premium data from the five largest auto insurers for a single gooddriver profile in most ZIP codes throughout the country and examined average premiums inpredominantly African American communities and predominantly white communities controllingfor income and population density. The results of this analysis suggest that, on average, a gooddriver in a predominantly African American community will pay considerably more for statemandated auto insurance coverage than a similarly situated driver in a predominantly whitecommunity.In order to address the concern that different communities have different auto insurance risks byvirtue of the type of driving typical of its residents (for example, high-speed open roads in ruralcommunities or bumper-to-bumper traffic in densely populated urban areas), this analysis alsoconsiders auto insurance premiums by racial composition of the ZIP code controlling for populationdensity and income.While the insurance industry has, at times, been dismissive of concerns about the high price of autoinsurance in underserved communities and for people of color,2 we do not seek to assess or impugnthe intentions of insurance companies with this report. We believe, instead, that it would be moreproductive to focus on the impact of high auto insurance prices and the implications these findingsshould have for industry, regulators, and policymakers.1The requirement that drivers in every state but New Hampshire purchase auto insurance is compounded as an issue of socialconcern because of the strong relationship between access to a car and employment rates, hours worked, and earnings. See, forexample: Charles L. Baum, “The Effects of Vehicle Ownership on Employment,” Journal of Urban Economics,” v. 66, n. 2,151-163. Evelyn Blumenberg and Margy Waller, “The Long Journey to Work: A Federal Transportation Policy for WorkingFamilies,” Center on Urban and Metropolitan Policy, Brookings Institute (July 20003).2For example, in 2014 the National Association of Mutual Insurance Companies, the nation's largest insurance trade association,illustrated this dismissive perspective in a letter to the Federal Insurance Office (FIO): ".data reveal that households in the twolowest quintiles spent nearly as much on alcohol and tobacco products combined as on automobile insurance, and that theyspent more on audio and visual (A/V) equipment and services than on automobile insurance." and ".we would submit that thepercentage of household income spent by minority consumers on automobile insurance appears to be reasonable relative to thepercentage of income spent on non-essential goods" identified in the letter as tobacco products, alcoholic beverages, audio andvisual equipment and services, and pets, toys and hobbies. Separately, in its 2014 letter to FIO, the Financial ServicesRoundtable wrote: "FSR believes that 'traditionally underserved communities' is basically impossible to define when place [sic]in the context of the auto insurance market, as essentially every community has access to a wide range of insurance coverageand pricing options."Consumer Federation of America Page 2
High Price of Mandatory Auto Insurance in Predominately African American CommunitiesSummary of FindingsAcross the country, the price of state-mandated, minimum-limits auto insurance offered to a gooddriver increases where the proportion of African Americans living in a community increases.Among the findings: In communities where more than three quarters of the residents are African American,premiums average 70 percent higher than in those with populations that are less than onequarter African American ( 1,060 vs. 622). In the densest urban communities, the average premium in predominantly African AmericanZIP codes is 60 percent higher than the average premium in equally dense predominantly whiteurban ZIP codes ( 1,797 vs. 1,126). In rural ZIP codes, the average premium in predominantly African American ZIP codes is 23percent more than the average premium in rural, predominantly white ZIP codes ( 669 vs. 542). The average premium in upper middle-income, predominantly African American ZIP codes is194 percent higher than the average premium charged to a similarly situated driver in an uppermiddle-income, predominantly white ZIP code ( 2,113 vs. 717). Across the country, Progressive's and Farmers Insurance's good driver premiums show themost disparity between predominantly African American ZIP codes and predominantly whiteZIP codes, with both companies averaging 92 percent. State Farm, Allstate and GEICO alsocharge substantially more—62, 56, and 52 percent respectively. In several metropolitan regions around the country, including the Baltimore, New York,Louisville, Washington, DC, Detroit, Boston, and Orlando metropolitan regions, the disparity ofpremiums is more than 50 percent between predominantly African American andpredominantly white ZIP codes.Consumer Federation of America Page 3
High Price of Mandatory Auto Insurance in Predominately African American CommunitiesData and MethodologyPrior ResearchCFA has used two methods for determining the cost of auto insurance for lower-income people andthe impact of non-driving rating factors on insurance premiums: collecting and analyzing data frominsurers’ websites and acquiring data from a third-party vendor.In previous reports, CFA collected premium quotes from individual companies' websites to assessthe impact of various rating factors on the price of auto insurance. Using this method, previousresearch found, for example, that several major insurers charge significantly higher premiums todrivers with only a high school diploma than to those drivers with higher levels of education, suchas a master’s degree.3 Previous research also found that in many states, some major insurersprovide no discount, or only a minimal discount, to low-mileage drivers, despite the actuarialevidence that annual mileage strongly correlates with risk of loss.4In 2014, CFA used a comprehensive dataset of auto insurance quotes for a typical moderate-incomegood driver acquired from Quadrant Information Services to evaluate the availability andaccessibility of state-mandated auto insurance in lower income communities in the 50 largestmetro areas. The report found that in approximately a third of lower-income ZIP codes none of thelargest insurers offered a basic policy for less than 500.5 A previous analysis of these data foundthat good drivers with low credit scores are charged as much as 123 percent more than driverswith high credit scores, controlling for all other factors including driving record.6In addition to reviewing data about premiums quoted by insurance companies to a typical gooddriver, CFA has commissioned public opinion research on affordability of auto insurance. Anational survey conducted by ORC International in fall 2013 found that 76 percent of Americansbelieve that state required minimum coverage auto insurance policy should cost no more than 500. While there may be some debate as to what the precise measure of auto insuranceaffordability should be, this polling provides important insight into the public's view of what3Brobeck, Stephen. “Use of Education, Occupation, and Other Non-Driving Factors Inflate Premiums for Low- and ModerateIncome Drivers.” Washington, DC: Consumer Federation of America, September 24, ateFactorRelease.9.24.12.pdf.4Brobeck, Stephen, and Michelle Styczynski. “Auto Insurers Fail to Reward Low Mileage Drivers.” Washington, DC, May 21,2015. http://consumerfed.org/news/902.5Feltner, Tom, Stephen Brobeck, and J. Robert Hunter. “The High Price of Mandatory Auto Insurance for Lower IncomeHouseholds: Premium Price Data for 50 Urban Regions.” Washington, DC: Consumer Federation of America, September 2014.http://consumerfed.org/pdfs/140929 highpriceofmandatoryautoinsurance cfa.pdf.6Brobeck, Stephen, J. Robert Hunter, and Tom Feltner. “The Use of Credit Scores by Auto Insurers: Adverse Impacts on Lowand Moderate-Income Drivers.” Consumer Federation of America, December oresbyautoinsurers dec2013 cfa.pdf.Consumer Federation of America Page 4
High Price of Mandatory Auto Insurance in Predominately African American Communitiesconsumers should have to spend on a product they are required to buy in order to comply withstate insurance requirements and avoid fines and other penalties.Prior to the analysis presented here, CFA had not assessed how the differences in average ZIP codepremiums vary by neighborhood racial composition. Other researchers, however, have previouslyaddressed the issue of race and redlining in relation to auto insurance. For example, Ong and Stollconcluded that “automobile insurance rates are higher in low-income and minority neighborhoodsbecause of both direct and indirect effects This story is truer for residents in predominantly blackneighborhoods. Residents in African American neighborhoods pay more, all things being equal.”7About the insurance premiums used in this reportTo examine the difference in minimum liability premiums in predominantly white and predominantly African American communities, CFA acquired January 2014 premium data provided bymajor private passenger auto insurance groups in each state. These data include premiums for fiveof the largest companies by national market share – Allstate, Farmers, GEICO, Progressive, and StateFarm, which represent 53.2 percent of the market.8 The data were purchased from QuadrantInformation Services, a third party data vendor that compiles property and casualty insurance ratesets and conducts market pricing analyses.Premiums were based on a single driver profile and represent rates quoted to an unmarriedwoman with a good driving history, who has graduated from high school, holds a clerical job, andrents her home (a complete list of rating factors held constant is available in Figure 1). Althoughpremiums often vary as these factors change, for the purposes of analysis, it is our view that thegood driver profile used here can serve as representative of a moderate-income driver. Based onprevious CFA research, a driver’s insurance score based on credit reporting information results inconsiderable variation in premium price. Prices in nine cities, that research found, increased anaverage of 127 percent moving from the best insurance score to the worst insurance score.9 For thefollowing analysis, CFA used a fair insurance score – the middle category of a ten-category rangeprovided by Quadrant Information Services.7Ong, P.M., and M.A. Stoll. “Redlining or Risk? A Spatial Analysis of Auto Insurance Rates in Los Angeles.” Journal of PolicyAnalysis and Management 26, no. 4 (2007): 827. doi:10.1002/pam.20287.8“Property and Casualty Insurance Industry 2014 Top 25 Groups and Companies by Countrywide Premium.” Washington, D.C.:National Association of Insurance Commissioners, April 6, 2015.http://www.naic.org/documents/web market share 150302 2014 property lob.pdf.9Brobeck, Stephen, J. Robert Hunter, and Thomas Feltner. “The Use of Credit Scores by Auto Insurers: Adverse Impacts onLow- and Moderate-Income Drivers.” Washington, DC: Consumer Federation of America, creditscoresbyautoinsurers dec2013 cfa.pdf.Consumer Federation of America Page 5
High Price of Mandatory Auto Insurance in Predominately African American CommunitiesFigure 1. About the driver profile used in this studyAbout our Driver:About Her Vehicle:30-year-old single femaleLicensed 14 yearsNo lapse in coverageNo accidents, moving violations, or licensesuspensionsHigh school diplomaEmployed in clerical professionRenter for 10 yearsNo affinity group discountsFair credit rating2000 Honda Civic EXDrives to work 10 miles one-way, 5 days/week10,000 total miles annuallyAbout Her Coverage:Minimum coverage required by stateAbout the ZIP code data used in this studyThe following analysis compares ZIP code premiums in predominantly African Americancommunities with ZIP code premiums in predominantly white communities with similar medianincomes and population densities to better understand the relationship between the racialcomposition of a community and the affordability of state-mandated minimum liability coverage.The analysis uses ZIP code data from the American Community Survey to identify ZIP code medianincome and percentage of people in a ZIP code who identify as African American or Black.10 Theanalysis also uses data provided by a data vendor to determine ZIP code population density. ZIPcode income was determined using the median household income. ZIP codes were categorized byhousehold median income quintile for the country. 11Predominantly African American communities were determined by dividing the ZIP codepopulation that identified as African American or Black by the total ZIP code population andrecoding the percentage by ZIP codes that contained less than 25 percent, 25 to 50 percent, greaterthan 50 percent to 75 percent and greater than 75 percent African American population.12 ZIPcodes with fewer than 25 percent African American drivers where white drivers represented thelargest racial group in the ZIP code were considered predominantly white.While there is no generally accepted standard for classifying communities by population densitiesfor insurance purposes, this analysis was guided by previous demographic research that dividesregion types by population density. Communities with population densities of 7,500 per squaremile and above are identified as “urban core,” those with densities between 2,500 and 7,500 as“urban region,” those with densities between 500 and 2,500 as “suburban,” those with densities of10U.S. Census Bureau, 2007-2011 American Community Survey Table DP05.11U.S. Census Bureau, 2007-2011 American Community Survey Table B19013 and B19080.12U.S. Census Bureau, 2007-2011 American Community Survey Table DP05.Consumer Federation of America Page 6
High Price of Mandatory Auto Insurance in Predominately African American Communities100-500 as “exurban,” and those with densities of fewer than 100 as “rural.”13 Approximately 110million Americans live in the two most dense segments; approximately 85 million live in the middlesegment; and approximately 110 million live in the two least dense segments.A complete list of the income, race and population density categories used in this analysis isprovided in Figure 2.Figure 2. Categories of analysisPercentage of African AmericanResidents (Categories)Median Household Income byIncome Quintile (Categories)Population Density Categories(residents per square mile) 25%25% to 49%50% to 74% 75% 20,585 20,585- 39,466 39,467- 63,001 63,001-101,685 101,686 100100-500500-2,5002,500 - 7,500 7,500In total, the dataset used for this analysis includes 293,010 quotes from 64 affiliates of Allstate,Farmers, GEICO, Progressive and State Farm in 29,664 ZIP codes representing 99.4 percent of theUS population. Of these 293,010 quotes, 214,711 were provided in 942 Core Based Statistical Areas(CBSA) and 78,299 were provided in rural areas.AnalysisUsing the data described in the previous section, CFA examined auto insurance premiums toidentify the relationship between the percentage of the population of a ZIP code that identified asAfrican American and the cost of state-mandated minimum liability coverage. The followinganalysis considers the difference in average premium in predominantly white communities andpredominantly African American communities, controlling for ZIP code median income andpopulation density. It also considers the average premium in predominantly white communitiesand predominantly African American communities by company and by metropolitan region.13See, for example, Wendell Cox's "From Jurisdictional to Functional Analysis of Urban Cores & Suburbs" (2014) bs.Consumer Federation of America Page 7
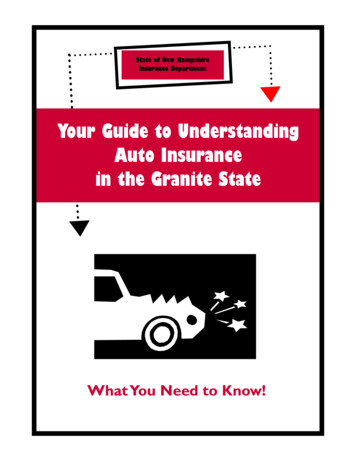
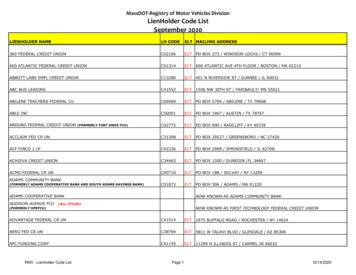
High Price of Mandatory Auto Insurance in Predominately African American CommunitiesAverage Insurance Premiums in Predominantly African American Communities AreHigher Than Those in Predominantly White CommunitiesFor the typical good driver described in Figure 1, the average premium available across the US for abasic limits auto insurance policy from the five largest insurers is 640. However, in those ZIPcodes in which African American residents constitute 75 percent or more of the population, theaverage premium for a good driver is 1,060 (See Figure 3 and 4). In addition to being 66 percentabove the average national premium of 640, it is 70 percent higher than the 622 averagepremium available in predominantly white ZIP codes.Figure 3. Basic Liability Auto Insurance Premiums for Good Drivers Higherin Predominantly African American Communities 1,060 769 834 640 622 25%25-49%50-74%75-100%National AverageSource: CFA analysis of data provided by Quadrant Information Services, US Census American Community SurveyAverage auto insurance premiums are higher in predominantly African Americancommunities regardless of incomeTo further consider the relationship between race and insurance premiums described in theprevious section and control for the possibility that the disparities between predominantly whitecommunities and predominantly African American communities was a function of the differences inhousehold income, CFA also examined auto insurance by both race and median income of ZIP code.As the summary data in Figure 4 illustrate, the finding that premiums are higher on average inpredominantly African American ZIP codes across the country, holds across all income levels. Theincrease from white to African American communities is most striking, however, in middle- andupper middle-income communities. Good drivers living in ZIP codes that have a population that isthree-quarters African American or more and have a household median income in the thirdquintile, or between 39,467 and 63,001 annually, are charged premiums that are 665, or 113percent more each year than in predominantly white ZIP codes with median incomes in the samequintile. In upper middle-income ZIP codes, where median household income ranges betweenConsumer Federation of America Page 8
High Price of Mandatory Auto Insurance in Predominately African American Communitiesabout 63,001 and 101,685, average premiums in predominantly African American communitiesare 194 percent higher – almost triple – those offered in upper middle-income white communities.As shown in Figure 4, the average premium in these ZIP codes is nearly 1,400 more annually forthe lowest coverage policy available.Figure 4. Good Drivers in Middle- and Upper Middle-Income African American CommunitiesFace the Highest Premiums2011 ZIP CodeIncome (Quintile)Percent of ZIP code population that is AfricanAmericanNationalAveragePercent Increasefrom 25% to 75%African American 25%25-49%50-74%75-100% 20,585 (1) 20,586- 39,466 (2) 39,467- 63,001 (3) 63,001-101,685 (4) 101,686 (5) 716596591717833 781737784917880 7727939421,0791,130 7461,0551,2562,1131,218 7326316047268324%77%113%194%46%All Quintiles 622 768 831 1,064 64070%Source: CFA analysis of data provided by Quadrant Information Services, US CensusAverage auto insurance premiums are higher in predominantly African Americancommunities regardless of population densityIn various regions of the country and within states, rates vary significantly. Traffic density isfrequently cited as the reason for higher premiums in urban areas. Urban drivers often face heavytraffic and various obstacles and distractions, while rural drivers may travel at higher speeds onless well-lit roads. These differences might explain some level of risk and the resulting variation ofpremium for drivers in different types of communities.To further consider the relationship between race and insurance premiums described in theprevious two sections and control for the possibility that the disparity between predominantlywhite communities and predominantly African American communities was a function of trafficdensity, CFA also examined auto insurance by both race and population density (the latter as aproxy for traffic density).To conduct the analysis, the 29,664 ZIP codes included in the premium dataset for the driver profiledescribed in Figure 1 were categorized into the five population density groups described in Figure2. These data show that the premiums charged to a good driver in predominantly African AmericanZIP codes are higher than premiums in predominantly white communities even when populationdensity is considered.Consumer Federation of America Page 9
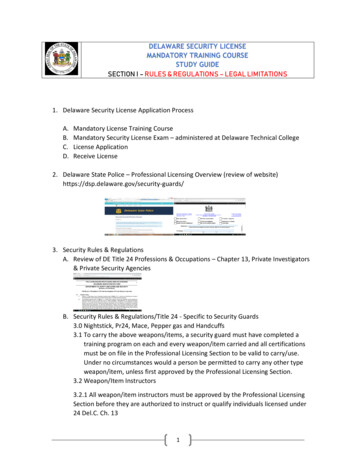
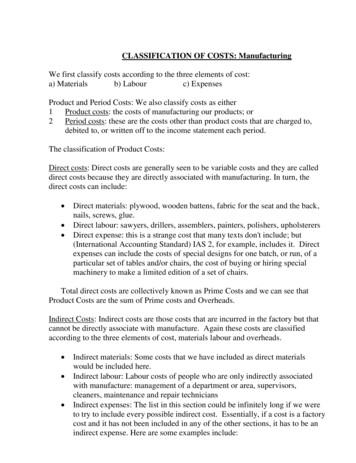
High Price of Mandatory Auto Insurance in Predominately African American CommunitiesIrrespective of population density, drivers in predominantly African American ZIP codes paid, onaverage, higher premiums for minimum liability coverage (Figure 5-1). Drivers in the most dense,predominantly African American ZIP codes had an average premium 60 percent higher thansimilarly situated drivers in predominantly white ZIP codes, and drivers living in predominantlyAfrican American rural ZIP codes faced an average premium 23 percent higher than those living inpredominantly white rural ZIP codes (Figure 2).Figure 5-1. Average Premium by Population Density and Percentage of African AmericanResidents2011 ZIP CodePopulation DensityMost DenseMore DenseModerately DenseLess DenseLeast DenseAll ZIP codes canAmerican 75%AfricanAmericanNationalAveragePercent Increasefrom 25% to 75%African American 1,126818715636542 1,481899742674624 1,684940785784645 1,7971,089828733669 1,26984572263954760%33%16%15%23% 622 769 834 1,060 64070%Source: CFA analysis of data provided by Quadrant Information Services, US CensusFigure 5-2. Good driver auto insurance rates are 666 higher in predominantly African Americanurban core communities ( 7,500 people per square mile) than in similar communities with fewerAfrican Americans 1,684 1,797 1,481 1,269 1,126 25% AfricanAmerican25-49% AfricanAmerican50%-75% AfricanAmerican 75% AfricanAmericanNational AverageSource: CFA analysis of data provided by Quadrant Information Services, US CensusConsumer Federation of America Page 10
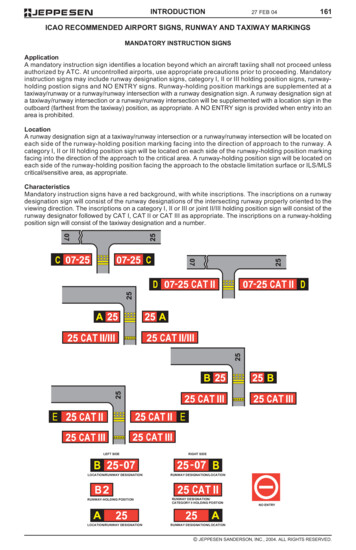
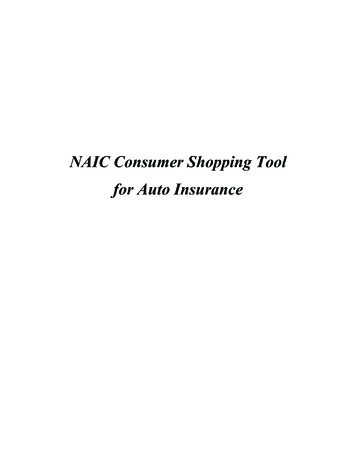
High Price of Mandatory Auto Insurance in Predominately African American CommunitiesPremiums are higher in African American communities at all of the five largest insurersIn addition to higher premiums regardless of ZIP code median income or population density,drivers in predominantly African American ZIP codes had higher average minimum liabilitypremiums regardless of company. Among the five largest insurers, Progressive and FarmersInsurance both had average premiums that were 92 percent higher in predominantly AfricanAmerican ZIP codes than predominantly white ZIP codes. This represents a 638 annual differencefor Progressive's customers and 609 difference for Farmers Insurance's customers for only thebasic liability coverage required by each state (Figure 6-1).All five companies had average premiums that are at least 50 percent higher in predominantlyAfrican American ZIP codes than in those with few African American residents. GEICO, Allstate, andState Farm had average premiums that were 53 percent, 56 percent, and 63 percent higher,respectively, on average (Figure 6-2).Figure 6-1. Average Premium by Company and Percentage of African American Residents anAmerican 75%AfricanAmericanNationalAveragePercent Increasefrom 25% to 75%African AmericanAllstateFarmersGEICOProgressiveState Farm 658662575694543 800757713852697 848795793911771 1,0241,2718761,332882 67467659171756156%92%53%93%63%Top Five Companies 622 769 834 1,060 64070%CompanySource: CFA analysis of data provided by Quadrant Information Services, US CensusConsumer Federation of America Page 11
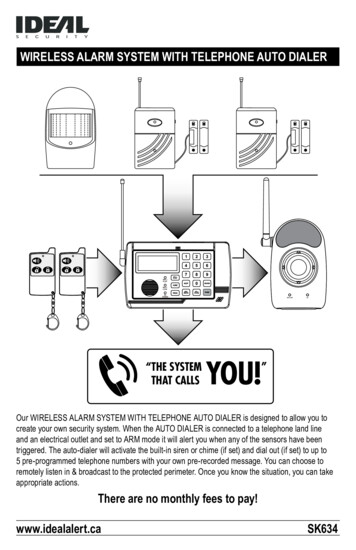
High Price of Mandatory Auto Insurance in Predominately African American CommunitiesFigure 6-2. Average Premium increase by Company in Predominantly African AmericanCommunities Compared with Predominantly White llstate63%State FarmAverage of TopFive CompaniesSource: CFA analysis of data provided by Quadrant Information Services, US CensusPremiums in African American communities by metropolitan regionCFA also reviewed average rates in the 942 CBSAs included in the dataset and identified the 30CBSAs with the largest differences in average premium between predominantly white communitiesand predominantly African American communities.Average premiums in predominantly African American ZIP codes in the Baltimore-Towson, MDCBSA were nearly double, or 94 percent higher than, the average premiums in its predominantlywhite communities, and average premiums were 83 percent higher in the New York metro area and75 percent higher in the Louisville metro area. Other metro areas in the top 10 areas with thehighest differences in auto rates between predominately white and predominately AfricanAmerican communities are Washington-Arlington-Alexandria ( 69 percent), Detroit-WarrenLivonia, MI ( 60 percent), Boston-Cambridge-Quincy, MA-NH( 51 percent), Orlando-KissimmeeSanford, FL ( 52 percent), St. Louis, MO-IL ( 46 percent), Hartford-West Hartford-East Hartford, CT( 42 percent) and Flint, MI ( 41 percent). The complete results are included in Figure 7.Consumer Federation of America Page 12
High Price of Mandatory Auto Insurance in Predominately African American CommunitiesFigure 7. CBSAs with the 30 Largest Percent Increases in Average Premiums from PredominantlyWhite Communities to Predominantly African American CommunitiesCBSABaltimore-Towson, MDNew York-N. New Jersey-Long Island, NY-NJ-PALouisville/Jefferson County, KY-INWashington-Arlington-Alexandria, DC-VA-MD-WVPercentIncrease from 25% to 75%AfricanAmerican 25%AfricanAmerican 75%AfricanAmericanCBSAAverage 1,035 2,012 07331,24182569%5,503,8018Detroit-Warren-Livonia, anford, incy, MA-NH57186057551%4,521,73710St. Louis, MO-IL54479258246%2,801,98218Hartford-West Hartford-East Hartford, 72114Kansas City, t Allis, ngton, PA-NJ-DE-MD8891,15893230%5,938,9185Buffalo-Niagara Falls, NY7891,01581929%1,135,75047Flint, MIToledo, 7Atlanta-Sandy Springs-Marietta, GA75194579126%5,213,8549New Orleans-Metairie-Kenner, ille, IL-IN-WI51863953423%9,425,7063Richmond, VA53765953723%1,248,27143Columbus, OH43052043921%1,819,56831Hilton Head Island-Beaufort, SC72285974719%183,243226Jacksonville, FL9401,10897218%1,334,68840Virginia Beach-Norfolk-Newport News, r, OH43550745117%2,080,31828Albany, GA63874164616%157,632258Macon, GA71482973616%231,828190Augusta-Richmond County, GA-SC67578168016%550,42092Dallas-Fort Worth-Arlington, TX67578068516%6,280,5974Los Angeles-Long Beach-Santa Ana, CA61771162115%12,777,6952 622 1,060 64070%Miami-Fort Lauderdale-Pompano Beach, FLNational AverageSource: CFA analysis of data provided by Quadrant Information Services, US CensusConsumer Federation of America Page 13
High Price of Mandatory Auto Insurance in Predominately African American CommunitiesConclusionMost states prohibit the consideration of a driver’s race or ethnicity when determining premiums.However, the findings of this report suggest that good drivers living in predominantly AfricanAmerican communities will pay, on average, 70 percent more for state-mandated minimumliability-only coverage than a similarly-situated driver in a predominantly white community. Aftercontrolling for both population density (as a proxy for traffic density) and income, we found thatdrivers living in predominantly African American communities continued to see higher averagepremiums than similarly situated drivers in predominantly white communities.RecommendationsThis analysis does not imply that auto insurance companies deploy explicitly discriminatorypractices, and CFA did not conduct any research aimed at making such a determination. Thisanalysis assesses impacts not intent, and our findings provide substantial evidence that the pricingof auto insurance results in good drivers in predominantly African American communities payinghigher prices than similarly situated drivers in predominantly white communities – prices that formost lower-income drivers would be prohibitively expensive.1. Regulators need to more seriously address the impact of auto insurance pricing me
Consumer Federation of America Page 2 Introduction All states except New Hampshire require drivers to purchase auto insurance, and the importance of automobile ownership for most Americans adds a special responsibility to ensure fairness in the auto insurance marketplace.1 In previous analyses, the Consumer Federation of America (CFA) has