Transcription
Artistsand OtherCultural WorkersA Statistical Portrait
Artists and Other Cultural WorkersA Statistical PortraitApril 2019
April 2019National Endowment for the Arts400 7th Street, SWWashington, D.C. 20506202-682-5400arts.govProduced by the Office of Research & AnalysisSunil Iyengar, DirectorBonnie Nichols, Operations Research AnalystPatricia Moore Shaffer, Deputy DirectorBushra Akbar, Program AnalystMelissa Menzer, Program AnalystAndrew Moyseowicz, Graduate InternLyndsi Pace, Graduate InternHelen Santoro, Graduate InternEditorial assistance by Don Ball and Rebecca SuttonDesigned by Kelli RogowskiThe Office of Research & Analysis would like to thank the two co-principal investigators at the National Endowment for the ArtsResearch Lab at Indiana University-Purdue University Indianapolis—Doug Noonan and Joanna Woronkowicz—for their assistance with asection of this report.Cover photos (L-R, top to bottom): Dancers perform with Infinity Dance Theater. Photo by Sofia Negron; Sound Designer Ryan Hickeyworks on Signature Theatre’s production of Crazy for You in Arlington, Virginia. Photo by Christopher Mueller; DonRico Hawkins, Jr., aseventh-grade student in Focus: HOPE’s Excel Photography program, in Detroit, Michigan. Photo courtesy of Annette Vanover, Focus:HOPE; Filmmaker Ya-Hsuan Huang captures Edith Kaphuka and her fellow students sweeping at recess in Ngwale Village, Malawi, as partof the Global Lives Project. Photo by Jason J. Price; A demonstration of letterpress printing in Mighty Tieton’s book arts facility, whichis used during the annual LiTFUSE: A Poets’ Workshop to print a broadside of the participants’ poems in Tieton, Washington. Photo byEd Marquand; The witches (Jennifer Hunt, Suzanne Curtis, and Sonja Lanzener) surround Macbeth (Remi Sandri) in a performance ofMacBeth by the Alabama Shakespeare Festival, as part of the Shakespeare in American Communities Military Base Tour. Photo: PhilScarsbrook; A local participant in Western North Carolina’s HandMade in America, Potter William Baker shapes a new piece on the wheelin his studio. Photo courtesy of EnergyXchange; 2016 NEA National Heritage Fellow, master huastecan son musician, and advocateArtemio Posadas. Photo by Tom Pich; Performers in House of Eternal Return in Santa Fe, New Mexico, the first permanent installation byMeow Wolf. Photo courtesy of Meow Wolf
About the ReportThis omnibus report, Artists and Other Cultural Workers: A Statistical Portrait, extends the range of statistics that theNational Endowment for the Arts historically has tracked as part of its decades-long research function. Although theagency periodically reports facts and figures about 11 distinct artist occupations (based on U.S. Census data), this reportbrings in other job characteristics, other data sources, and even other kinds of cultural workers. Among key findings are:1.Regardless of occupation, over 5 million workers are employed in arts and cultural industries. They are allwage-and-salary workers. There are nearly 2.5 million artists in the U.S. labor force (either self-employed or wage-and-salaryworkers). Approximately 333,000 (self-employed or wage-and-salary) workers hold secondary jobs as artists. Another 1.2 million (self-employed or wage-and-salary) workers hold a primary job in a cultural occupationother than artist.2. Artists are 3.6 times as likely as other workers to be self-employed. In 2012-2016, roughly 34 percent of all artists were self-employed. This compares with 9 percent of allworkers. Most self-employed artists seem to like their work arrangement: 79 percent say they would not prefer towork for someone else, while 58 percent cite flexible schedules and independence as the main reasonsthey are self-employed.3. Artists are becoming a larger share of the U.S. labor force.4. In 2006, artists composed 1.42 percent of the labor force; by 2017, they were 1.55 percent, representing a6.1 percent increase. In 2017, the artist unemployment rate hit an 11-year low. As a group, artists currently experience unemployment rates similar to those of all U.S. workers.Faster-than-average growth in employment is projected for set and exhibit designers, actors, producers anddirectors, and film and video editors. Between 2016 and 2026, annual job openings will have averaged 7,400 for actors and 14,100 for producersand directors. Employment growth in these occupations stems from strong demand for new movies andtelevision shows. Employment of film/video editors is projected to grow at a 17 percent clip. A contributing factor is thenumber of shows increasingly produced by Internet-only sources and streaming services.Chapter by chapter, this report builds a cohesive statistical summary of artists and other cultural workers in the UnitedStates. In doing so, it complements the National Endowment for the Arts’ regular measurements of two other key segmentsof the arts ecosystem: arts industries and organizations, and levels of arts participation nationwide.National Endowment for the Arts arts.goviii
This pageintentionallyleft blank.ivArtists and Other Cultural Workers: A Statistical Portrait
Table of ContentsIllustrations . viExecutive Summary . viiOverview of Methods and Data . xiiiChapter I. Employment Trends . 1Chapter II. Demographic and Other Characteristics . 9Chapter III. Self-Employment . 21Chapter IV. Income and Earnings . 25Chapter V. Career Outlook . 31References . 35Additional Information . 36National Endowment for the Arts arts.govv
IllustrationsFiguresExecutive SummaryFigure ES1. Number of artists in the labor force: 2017 . viiFigure ES2. Percent of artists, by occupation, who hold the occupation as a second job: 2017 . viiiFigure ES3. Arts and cultural employment: 1998-2016. ixFigure ES4. Unemployment rates for artists, professional workers, and all workers in the labor force: 2006-2017 . ixFigure ES5. Percent of professionals, artists, and all U.S. workers with bachelor’s degrees or higher levels ofeducation: 2012-2016 . xFigure ES6. Percent self-employed: 2012-2016 . xiFigure ES7. Projected percent change in employment: 2016-2026 . xiiOverview of Methods and DataSummary of datasets used in this report: . xivChapter I. Employment TrendsFigure 1a. Number of artists in the labor force: 2017 . 1Figure 1b. Artists as a share of the U.S. labor force: 2006-201. 2Figure 1c. Real value added by arts and culture: 1998-2016 . 3Figure 1d. Unemployment rates: 201. 4Figure 1e. Unemployment rates for artists, professional workers, and all workers in the labor force: 2006-2017. 5Figure 1f. Percent of artists, by occupation, who hold the occupation as a second job: 2017 . 7Figure 1g. Percent of artists by class of worker: 2017 . 7Figure 1h. Number of photographic processing workers in the U.S. labor force: 2006-2017 . 8Chapter II. Demographic and Other CharacteristicsFigure 2a. Percent married by age group, all workers and artists: 2012-2016 . 9Figure 2b. Percent of professionals, artists, and all U.S. workers with bachelor’s degrees orhigher levels of education: 2012-2016. 14Figure 2c. Percent of bachelor’s degrees in “study of the arts” awarded to African Americans,Hispanics, and American Indians/Native Alaskans: 1995-2015. 17Chapter III. Self-EmploymentFigure 3a. Main reason artists give for being self-employed: 2017 . 21Figure 3b. Self-employment rates for artists and all other professional workers: 2003-2015 . 23Chapter IV. Income and EarningsFigure 4a. Median annual wages and salaries by artist occupation: 2012-2016 . 25Figure 4b. Artists whose hourly wages range highly: 2017 . 27Figure 4c. Median income-to-poverty ratios by artist occupation: 2012-2016 . 28Figure 4d. Women’s-to-men’s earnings ratio by age group: 2012-2016 . 29Figure 4e. Top primary instruments played by musicians: 2018 . 30Chapter V. Career OutlookFigure 5a. Projected percent change in employment: 2016-2026 . 32Figure 5b. Real value added from arts and culture by “other information services”: 2014-2016 . 33TablesChapter I. Employment TrendsTable 1. Primary and secondary employment in artist occupations: 2017 . 6Chapter II. Demographic and Other CharacteristicsTable 2a. Median age of artists: 2012-2016 . 10Table 2b. Employed artists by occupation and gender: 2012-2016 . 11Table 2c. Employed artists by occupation and race/ethnicity: 2012-2016 . 13Table 2d. Percent of U.S. labor force with selected arts-related degrees: 2012-2016 . 15Table 2e. Bachelor’s degrees most commonly earned by artists and selected cultural workers: 2012-2016 . 16viArtists and Other Cultural Workers: A Statistical Portrait
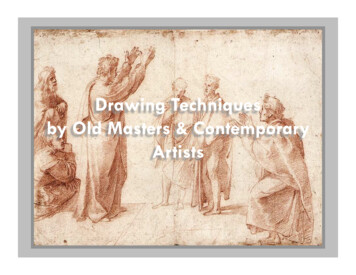
Artists and Other Cultural WorkersA Statistical PortraitExecutive SummaryThis report uses federal statistics from various sources to describe the artists and other cultural workers who participate in the U.S.labor market. Wherever possible, the most recently available data were analyzed.Number of Artists and Other Cultural WorkersRegardless of occupation, over 5 million workers are employed in arts and cultural industries. They are all wage-and-salary workers. There are nearly 2.5 million artists in the U.S. labor force (either self-employed or wage-and-salary workers). Approximately 333,000 (self-employed or wage-and-salary) workers hold secondary jobs as artists. Another 1.2 million (self-employed or wage-and-salary) workers hold a primary job in a cultural occupation other thanartist. They are workers whose primary job is as an artist in one of the occupations listed below.Figure ES1. Number of artists in the labor force: 2017(in thousands)938Designers256Architects247Art directors, fine artists, and animators235Writers and authors225Photographers194Musicians188Producers and directors71Other entertainersActorsAnnouncersDancers and choreographers535123Source: Employed and experienced unemployed persons by detailed occupation; Current Population Survey (CPS), U.S. Bureau of Labor StatisticsNational Endowment for the Arts arts.govvii
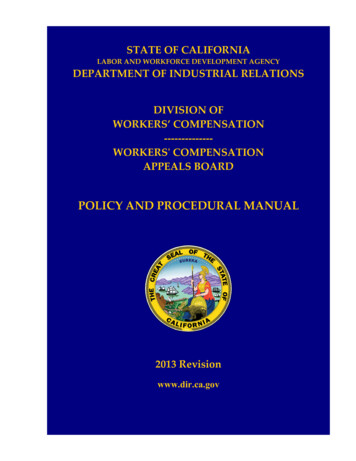
Number of workers who hold a secondary job as an artist: An estimated 333,000 workers hold secondary jobs as artists. More than half of these workers (56 percent) have a primary job in one of the following industries: healthcare andeducation; leisure and hospitality; and “professional” services, a category that includes advertising and photographicservices. Relatively large shares of musicians, actors, and writers and editors are employed in these capacities as a second job.Figure ES2. Percent of artists, by occupation, who hold the occupation as a second job: 2017 (K thousands of workers holding a secondary job in this occupation)ActorsAnnouncers18K16.4%40K 14.4%33K 12.7%333K 12.3%42KPhotographersArt directors, fine artists, and animatorsWriters and authorsAll artists9.5%2K 9.0%14K 7.4%54K 5.6%7KOther entertainersDancers and choreographersProducers and directorsDesignersArchitects34.8%17K 30.3%26.5%100KMusicians5K2.1%Source: Current Population Survey (CPS), U.S. Bureau of Labor StatisticsNote: Estimates were calculated by the Office of Research & Analysis, National Endowment for the Arts.Number of workers who hold a job in another cultural occupation: In addition to the 2.5 million workers whose primary job is as an artist, there are nearly 1.2 million workers whose primaryjob is in another cultural occupation. Librarians, editors, and printing press operators constitute the largest numbers. The number of archivists, curators, and museum technicians grew from 42,000 in 2006 to 61,000 in 2017—a gain of 45percent. The job of processing photographs is a declining occupation. Between 2006 and 2017, the labor market shed 33,000workers in that category.Total number and trends of workers employed in arts and cultural industries: Regardless of their occupation, over 5 million workers are employed in arts and cultural industries. Although rising in recent years, the number of workers employed to produce arts and cultural goods and services is belowthe peak observed in 2001. In that year, arts and cultural employment reached 5.8 million, or 749,000 more workers than the arts economy employedin 2016, the most recent year for which data are reported. Artists are becoming a larger share of the U.S. labor force. In 2006, artists composed 1.42 percent of the labor force; by 2017, they were 1.55 percent, representing a 6.1 percentincrease. In 2017, the artist unemployment rate hit an 11-year low. As a group, artists currently experience unemployment rates similar to those of all U.S. workers.viiiArtists and Other Cultural Workers: A Statistical Portrait
Figure ES3. Arts and cultural employment: 1998-2016600055005000450040001998 1999 2000 2001 2002 2003 2004 2005 2006 2007 2008 2009 2010 2011 2012 2013 2014 2015 2016Source: Arts and Cultural Production Satellite Account (ACPSA), U.S. Bureau of Economic Analysis and National Endowment for the ArtsFigure ES4. Unemployment rates for artists, professional workers, and all workers in the laborforce: 2006-201710All workers in the labor forceArtists9Professional 14201520162017Note: “Professional” workers hold a variety of occupations that usually require college or other specialized training.Source: Employed and experienced unemployed persons by detailed occupation, Current Population Survey (CPS), U.S. Bureau of Labor StatisticsNational Endowment for the Arts arts.govix
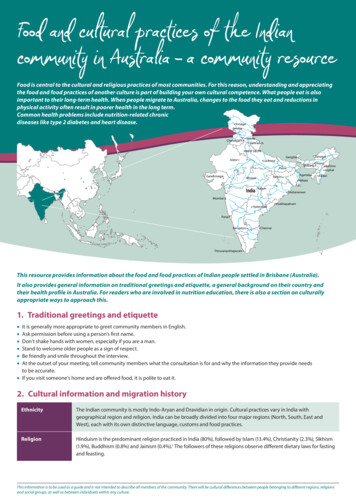
Education Level of ArtistsArtists are 1.8 times as likely as other workers to hold a college degree. 63 percent of all artists (aged 25 and older) hold bachelor’s degrees or higher levels of education. By comparison, 36percent of all workers in the labor force hold college degrees. 90 percent of architects, and 83 percent of writers and authors, have at least a bachelor’s degree. At the other end of the scale, 27 percent of dancers/choreographers are college-educated.Figure ES5. Percent of professionals, artists, and all U.S. workers with bachelor’s degrees or higherlevels of education: lsAll artistsLabor forceNote: The data refer to workers aged 25 and older. “Professionals” hold a variety of occupations that usually require college or other specialized training.Source: American Community Survey (ACS), PUMS, 2012-2016: U.S. Census BureauArtists and Levels of Self-EmploymentArtists are 3.6 times as likely as other workers to be self-employed.x In 2012-2016, roughly 34 percent of all artists were self-employed. This compares with 9 percent of all workers. Self-employment rates exceed 50 percent for fine artists and photographers. Most self-employed artists seem to like their work arrangement: 79 percent say they would not prefer to work forsomeone else, while 58 percent cite flexible schedules and independence as the main reasons they are self-employed.Artists and Other Cultural Workers: A Statistical Portrait
Figure ES6. Percent self-employed: 2012-20166053.8%5055.9%4034.1%3020109.4%0All U.S.workersAll artistsFine artists,art directors,animatorsPhotographersSource: American Community Survey (ACS), PUMS, 2012-2016: U.S. Census BureauIncome and Earnings of ArtistsCompared with U.S. workers as a whole, artists are less likely to be poor. The average artist’s income is 4.4 times greater than his or her official poverty threshold of income. By contrast, income earned by the average U.S. worker is 3.7 times greater than amount needed to avoid poverty. Artists working full-year/full-time earn an annual average of 52,800. Annually, artists earn nearly 8,200 more than the average worker earns. With average annual earnings of 65,000 to 75,000, producers/directors and architects are the best-paid artists. Dancers/choreographers (who earn an annual average of 31,200) and actors (who typically earn annual wages andsalaries of 38,500) are among the lowest-paid artists. Women artists earn 0.77 for every dollar men artists earn.National Endowment for the Arts arts.govxi
Projections for Changes in Various Artist OccupationsFaster-than-average growth in employment is predicted for set and exhibit designers, actors, producers and directors, and film andvideo editors. Between 2016 and 2026, annual job openings will have averaged 7,400 for actors and 14,100 for producers and directors.Employment growth in these occupations stems from strong demand for new movies and television shows. Employment of film/video editors is projected to grow at a 17 percent clip. A contributing factor is the number of showsincreasingly produced by Internet-only sources and streaming services.The number of employed photographers is projected to fall by 5.6 percent. Annually, between 2016 and 2026, the U.S. Bureau of Labor Statistics expects an average of 11,100 photographers either toleave the labor market altogether or to take jobs in other occupations. Employment in photographic processing jobs is projected to decline by 18.1 percent.20Figure ES7. Projected percent change in employment: 2016-2026Selected fast-growing arts and cultural occupations17.0%1511.6%1012.2%7.4%50All occupationsActorsSource: Employment Projections, U.S. Bureau of Labor StatisticsxiiArtists and Other Cultural Workers: A Statistical PortraitProducers anddirectorsFilm/video editors
Overview of Methods and DataData SourcesThis report draws on several data sources to enumerate and describe the labor force of artists and other cultural workers.These data, in turn, were collected by using different methodologies and targeting different segments of the U.S. labor market.Consequently, counts of artists or other cultural workers—and their characteristics—vary from one source to the next.Below is a listing of the data sources used in this report, by chapter:Chapter I: Employment Trends: This chapter uses data from the Bureau of Labor Statistics’ Current Population Survey (CPS)for 2006-2017. The CPS is a monthly survey of 60,000 U.S. households. It provides a comprehensive body of data on the total laborforce and employment, and unemployment. Because it is a household survey, the CPS captures self-employed workers, and it is thisreport’s source for statistics on multiple jobholders.Estimates from the CPS, released monthly, are the official federal government source of employment and unemployment. In thisreport, annual averages from the CPS are used to identify the number of workers, including artists and cultural workers, in theU.S. labor market.The timeframe covered by this report, 2006-2017, reveals the artist labor force before the Great Recession of 2007-2009, and thesubsequent economic recovery and expansion years of 2010-2017.Chapter II: Demographic and Other Characteristics: Demographic characteristics were based on data from the AmericanCommunity Survey (ACS), produced by the U.S. Census Bureau. A rolling survey, the ACS polls more than three million householdsand reports a response rate of roughly 95 percent. In addition to household units, the ACS also surveys group quarters. Theestimates shown in this report were based on the 2012-2016 ACS PUMS (Public Use Microdata Sample).The U.S. Census Bureau released its first five-year ACS estimates in 2010. Since then, it has been the premier source of detailedinformation about demographics, occupations, and many other characteristics of the U.S. population.The 2012-2016 ACS dataset is the most current available at the time of this writing. The National Endowment for the Arts analyzedtwo previous waves of the ACS. In 2011, the agency released Artists and Art Workers in the United States: Findings from the AmericanCommunity Survey (2005-2009) and the Quarterly Census of Employment and Wages (2010). In 2013, the Arts Endowment released EqualOpportunity Data Mining: National Statistics about Working Artists, an Arts Data Profile using the Equal Employment Opportunity (EEO)special tabulations of the 2006-2010 ACS.Chapter III. Self-Employment: More than one-third of artists are self-employed, and self-employment is even more common amongfine artists and photographers. This chapter uses data from the American Community Survey (2012-2016) to explore this work statusfor artists and cultural workers.The analysis is supplemented with findings from the 2017 Contingent Workers Survey (CWS), produced by the U.S. Census Bureau inpartnership with the Bureau of Labor Statistics (BLS). Prior to this recent release, the CWS was last done in 2005.Chapter IV: Income and Earnings: Chapter IV draws on data from both the American Community Survey (ACS) for 2012-2016 andthe BLS’ Occupation Employment Survey (OES) for 2017. The OES program collects data on wage and salary workers in nonfarmestablishments in order to produce employment and wage estimates for 800 occupations.Chapter V: Career Outlook: The National Employment Matrix Database is produced by the BLS and is used by the agency’sEmployment Projections program. The Matrix is the basis for the agency’s widely known source of career information, the OccupationalOutlook Handbook. Current estimates track projected changes in employment between 2016 and 2026. Like OES data, BLS’ Matrixprovides more occupational detail than either the CPS or the ACS.National Endowment for the Arts arts.govxiii
Summary of datasets used in this report:Source of DataYears covered in this reportAmericanNationalCommunity EmploymentSurveyMatrixArts 6-2017201720172012-20162016-20262006-2015Key characteristicsTimely employment/ unemployment dataHousehold survey Year-over-year trend analysis Large sample sizeCaptures multiple jobholdingCaptures self-employed workers Administrative, business survey, or calculated data Earnings data Detailed industryDetailed data on the self-employed and othercontingent workersEmployment projections* The ACPSA counts the earnings of self-employed workers as value added.KeyCensus: U.S. Census BureauBLS: U.S. Bureau of Labor StatisticsBEA: U.S. Bureau of Economic AnalysisNEA: National Endowment for the ArtsxivArtists and Other Cultural Workers: A Statistical Portrait * Detailed demographicsDetailed occupations
Artist and Other Cultural OccupationsThis report mines federal data sources to examine workers in Arts Endowment-defined artist and cultural occupations.All 11 artist occupations are counted as “professionals,” a broad occupation category describing jobs that typically require college orother specialized training.1 In addition to artists, professional occupations include doctors, lawyers, engineers, clergy, and teachers.The additional 16 cultural occupations span an even wider occupational scale. These workers include professionals such as librarians,editors, and curators, as well as service occupations (e.g., theatrical makeup artists and motion picture projectionists), and productionoccupations (e.g., printing press operators and molders/casters).The artist and other cultural occupations described here reflect those outlined in the 2013 report, NEA Guide to the U.S. Arts and CulturalProduction Satellite Account, Including a Blueprint for Capturing the Economic Value of Arts and Cultural Workers and Volunteers.Below is a list of the artist and other cultural occupations examined in this report. For more information, please see the Key to Artist andOther Cultural Occupations.Artist Occupations:Architects; fine artists, art directors, and animators; designers; actors; producers and directors; dancers and choreographers;musicians; “other entertainers”; announcers; writers and authors; and photographers.Other Cultural Occupations:Archivists, curators, and museum technicians; librarians; library technicians; editors; broadcast and sound engineering technicians;television, video, and motion picture camera operators and editors; motion picture projectionists; ushers, lobby attendants, and tickettakers; tour and travel guides; models and demonstrators; printing press operators; print binding and finishing workers; jewelers andprecious stone- and metal-workers; photographic process workers; etchers and engravers; and molders, shapers, and casters.Chapters IV and V, which use data sources containing more occupation detail, also report estimates for forest and conservationtechnicians, musical instrument repairers and tuners, and desktop publishers. The occupational data reported in the Current PopulationSurvey and the American Community Survey—used in Chapters I, II, and III—are not sufficiently detailed to report separate estimates forthese occupations.The CPS and ACS, for example, report estimates for “miscellaneous life, physical, and social science technicians,” an occupation groupthat includes not only forest and conservation technicians, but also forensic science technicians and environmental science andprotection technicians—two occupations unrelated to the production of cultural goods and services.Similarly, in the CPS and ACS, musical instrument repairers are subsumed within “precision instrument and equipment repairers,” anddesktop publishers are included among “miscellaneous office and administrative support workers.”Acronyms Used in This ReportArts and Cultural Production Satellite Account (ACPSA)American Community Survey, Public Use Microdata Sample (ACS PUMS)Bureau of Economic Analysis (BEA)Bureau of Labor Statistics (BLS)Contingent Worker Survey (CWS)Current Population Survey (CPS)Music Industry Research Association (MIRA)Occupation Employment Survey (OES)1 As defined by the U.S. Bureau of Labor Statistics, “professional” occupations are concerned with the study, application, and/or administration of physical, mathematical, scientific,engineering, architectural, social
in his studio. Photo courtesy of EnergyXchange; 2016 NEA National Heritage Fellow, master huastecan son musician, and advocate Artemio Posadas. Photo by Tom Pich; Performers in . House of Eternal Return. in Santa Fe, New Mexico, the first permanent installation by Meow Wolf. Photo courtesy of Meow Wolf