Transcription
EDHEC RISK AND ASSETMANAGEMENT RESEARCH CENTRE393-400 promenade des Anglais06202 Nice Cedex 3Tel.: 33 (0)4 93 18 32 53E-mail: research@edhec-risk.comWeb: www.edhec-risk.comMomentum Strategies in CommodityFutures MarketsJoëlle MiffreAssociate Professor of Finance, EDHEC Business SchoolGeorgios RallisCass Business School, Ph.D. Student
AbstractThe article tests for the presence of short-term continuation and long-term reversal in commodity futuresprices. While contrarian strategies do not work, the article identifies 13 profitable momentum strategies thatgenerate 9.38% average return a year. A closer analysis of the constituents of the long-short portfolios revealsthat the momentum strategies buy backwardated contracts and sell contangoed contracts. The correlationbetween the momentum returns and the returns of traditional asset classes is also found to be low, making thecommodity-based relative-strength portfolios excellent candidates for inclusion in well-diversified portfolios.Keywords: Commodity futures, Momentum, Backwardation, Contango, DiversificationJEL classification codes: G13, G14Author for correspondence: Joëlle Miffre, Associate Professor of Finance, EDHEC Business School, 393 Promenadedes Anglais, 06202, Nice, France, Tel: 33 (0)4 93 18 32 55, e-mail: joelle.miffre@edhec.eduA version of this paper is forthcoming in the Journal of Banking and Finance. The authors would like to thankChris Brooks and two anonymous referees for helpful comments.EDHEC is one of the top five business schools in France owing to the high quality of its academic staff (104permanent lecturers from France and abroad) and its privileged relationship with professionals that the schoolhas been developing since its establishment in 1906. EDHEC Business School has decided to draw on its extensiveknowledge of the professional environment and has therefore concentrated its research on themes that satisfythe needs of professionals.EDHEC pursues an active research policy in the field of finance. Its “Risk and Asset Management ResearchCentre” carries out numerous research programs in the areas of asset allocation and risk management in boththe traditional and alternative investment universes.
1. IntroductionCommodity futures are excellent portfolio diversifiers and, for some, an effective hedge against inflation (Bodieand Rosansky, 1980; Bodie, 1983). They also offer leverage and are not subject to short-selling restrictions.Besides, the nearby contracts are typically very liquid and cheap to trade. For all these reasons, commodityfutures are good candidates for strategic asset allocation and have been proved to be useful tools for alphageneration (Jensen et al., [2002]; Vrugt et al., [2004]; Wang and Yu, [2004]; Erb and Harvey, [2006]).This article examines the profitability of 56 momentum and contrarian strategies in commodity futures markets.The momentum strategies buy the commodity futures that outperformed in the recent past, sell the commodityfutures that under-performed and hold the relative-strength portfolios for up to 12 months. The contrarianstrategies do the opposite. They buy the commodity futures that underperformed in the distant past, sell thecommodity futures that outperformed and hold the long-short portfolios for periods ranging from 2 to 5 years.To put this differently, the article investigates whether the short-term price continuation and the long-termmean reversion identified in equity markets by Jegadeesh and Titman (1993, 2001) and De Bondt and Thaler(1985) are present in commodity futures markets. The paper also builds on the research of Erb and Harvey(2006) who show that a momentum strategy with a 12-month ranking period and a 1-month holding period isprofitable in commodity futures markets.While contrarian strategies do not work, the article identifies 13 profitable momentum strategies in commodityfutures markets. Tactically allocating wealth towards the best performing commodities and away from theworst performing ones generates an average return of 9.38% a year. Over the same period, a long-only equallyweighted portfolio of commodity futures lost 2.64%. In line with the analysis of Erb and Harvey (2006), this resultsuggests that active investment strategies have historically been profitable in commodity futures markets.While they are not merely a compensation for risk, the momentum returns are found to be related to thepropensity of commodity futures markets to be in backwardation or in contango. The results indeed suggest thatthe momentum strategies buy backwardated contracts and sell contangoed contracts. Therefore our analysisindicates that one can link the momentum profits in commodity futures markets to an economic rationale relatedto the Keynes (1930) and Hicks (1939) theory of normal backwardation. Interestingly, the momentum returns arealso found to have low correlations with the returns of traditional asset classes, making the commodity-basedrelative-strength strategies good candidates for inclusion in well-diversified portfolios.There are strong rationales for implementing momentum strategies in commodity futures markets rather than inequity markets: Our commodity-based long-short strategies minimise transaction costs,2 trade liquid contractswith nearby maturities, are not subject to the short-selling restrictions that are often imposed in equity marketsand focus on 31 commodity futures only (as opposed to hundreds or thousands of stocks). It is therefore unlikelythat the abnormal returns we identify will be eroded by the costs of implementing the momentum strategy orwill be a compensation for a lack of liquidity (as in Lesmond et al., 2004).On a less positive note, institutional investors who implement momentum strategies in commodity futuresmarkets have to post initial margins, monitor margin accounts on a daily basis, roll-over contracts beforematurity and pay margin calls. As they are not born by equity asset managers, such costs have to be weighedagainst the benefits of implementing momentum strategies in commodity futures markets. The margin calls androll-over risk, however, should not be overstated: as the momentum strategies buy backwardated contracts andsell contangoed contracts, little to no cash will be required for margin calls and the roll-over trades will be moreoften than not profitable.The article proceeds as follows. Section 2 introduces the dataset. Section 3 outlines the methodology usedto construct momentum and contrarian portfolios. It also presents the risk models that are employed to1 - The term “return” is used loosely to refer to the performance of the momentum and contrarian strategies. It is noted that the term is improper in futures markets as, aside from the initialmargins, no cash payment is made at the time the position is opened. It follows that a definition of returns that implicitly assumes that investors purchase the futures contract at the settlementprice is, by definition, inaccurate. Note however that a definition that considers the initial margin as an investment is also incorrect since the initial margin is just a good faith deposit (and notan investment) and is redeemed to the trader (along with accrued interests and marking-to-market profits or losses) at the time he/she enters a reversing trade. Based on this and in line with,among others, Dusak (1973) and Bessembinder (1992), the paper measures futures returns as the change in the logarithms of settlement prices. Had futures returns been measured relative tothe margins and on a fully-collateralized basis, the momentum profits would have been further enhanced. Our definition of return is free of collateral and therefore more conservative.2 - Transaction costs in futures markets range from 0.0004% to 0.033% (Locke and Venkatesh, 1997), which is much less than the conservative 0.5% estimate of Jegadeesh and Titman (1993)or the more realistic 2.3% estimate of Lesmond et al. (2004) for the equity market.
measure the abnormal returns of the strategies. Section 4 discusses the results from the momentum strategies.In particular, it highlights the relationship between momentum profits, backwardation and contango and thediversification properties of the momentum portfolios. Section 5 focuses on the contrarian strategies. Finally,section 6 concludes.2. DataThe data, obtained from Datastream International, comprises settlement prices on 31 US commodity futurescontracts. We consider 13 agricultural futures (cocoa, coffee C, corn, cotton #2, milk, oats, orange juice, soybeanmeal, soybean oil, soybeans, sugar #11, wheat, white wheat), 4 livestock futures (feeder cattle, frozen porkbellies, lean hogs, live cattle), 6 metal futures (aluminum, copper, gold 100 oz, palladium, platinum, silver 1000oz), 5 oil and gas futures (heating oil, light crude oil, natural gas, regular gas, unleaded gas) and the futureson diammonium phosphate, lumber and western plywood. The dataset spans the period January, 31 1979 toSeptember, 30 2004. To avoid survivorship bias, we include contracts that started trading after January 1979or were delisted before September 2004. We mitigate problems of low liquidity and high transaction costs byfiltering out futures with average trading volume below 1,000 contracts over the period January, 31 1979 toSeptember, 30 2004.3 The total sample size ranges from a low of 22 contracts at the beginning of the period toa peak of 27 contracts over the periods March 1996-July 1997 and July 1999-September 2004.4The paper tests the sensitivity of the results to the technique employed to compute futures returns. Twoapproaches are used to compile time series of futures prices and, consequently, time series of futures returns. Inboth cases, futures returns are computed as the change in the logarithms of the settlement prices.First, we collect the futures prices on all nearest and second nearest contracts. We hold the first nearby contractup to one month before maturity. At the end of that month, we roll our position over to the second nearestcontract and hold that contract up to one month prior to maturity. The procedure is then rolled forward to thenext set of nearest and second nearest contracts when a new sequence of futures returns is compiled. Second,we re-iterate this approach but, this time, we switch to the most distant (in place of the nearby) contract anduse weekly5 (in place of monthly) settlement prices. To be more specific, we collect weekly settlement prices onall maturity contracts. We hold the first contract up to two weeks before maturity. At this time, we roll our longposition to the contract whose maturity is the furthest away and hold it up to two weeks before it matures.The process is repeated throughout the dataset to generate a sequence of investable distant maturity futuresreturns.This sensitivity analysis is interesting for two reasons. First, it enables us to test whether the profits of the tradingrule depend on the choice of the roll-over date (as highlighted, among others, in Ma et al., 1992). Second, if themomentum profits are related to backwardation and contango, trading contracts whose maturity is the furthestaway might generate superior profits. This potential benefit, however, has to be weighed against the liquidity riskthat is involved in trading maturing contracts and contracts with far distant maturities. It could indeed be thecase that, due to a lack of liquidity, the choice of i) a later roll-over date and ii) distant maturity contracts has adamaging impact on momentum profits. This point notwithstanding, the sensitivity of the results to the roll-overdate is an empirical question that deserves attention as it is of interest to institutional investors.At the roll-over date, one could adjust the price level ex post to eliminate the price gap between the futurescontract that is closed out and the futures contract that is entered into. We favor a correction-free approachinstead. The reasons for using unadjusted price series are twofold. First, as real transaction prices are used inpractice, momentum and contrarian strategies have to be implemented on unadjusted price series if they are tobe meaningful to institutional investors. Second, if, as we argue, the momentum strategy buys backwardatedcontracts and sells contangoed contracts, part of the momentum profits will come from the profits generatedon the roll-over trades. As a result, adjusting the price levels on the roll-over date might eliminate part of themomentum profits that institutional investors seek to earn. 3 - The omitted contracts are for ammonia, boneless beef, broiler chickens, butter, cheddar cheese, cotton seed, fresh pork bellies, nonfat dry milk, potatoes, oriented strand board and whiteshrimp. It is noted that excluding these contracts introduces a look-ahead bias.4 - We use the Ljung-Box Q statistics to test for 1st and 12th order serial correlation in futures returns. The results, available on request, indicate presence of serial correlation in more than half ofthe series at the 10% level. This crude test suggests that today’s returns depend on past values and is an indication that long-short strategies might be profitable in commodity futures markets.5 - We download Wednesday prices to ensure that the results are not driven by week end effect.
3. MethodologyThis study analyses any combination of ranking periods of 1, 3, 6, 12, 24, 36 and 60 months and holding periodsof 1, 3, 6, 12, 18, 24, 36 and 60 months. These permutations result in 32 short-term momentum strategies withfour ranking periods (1, 3, 6 and 12 months) and eight holding periods (1, 3, 6, 12, 18, 24, 36 and 60 months)and in 24 long-term contrarian strategies with three ranking periods (24, 36 and 60 months) and eight holdingperiods (1, 3, 6, 12, 18, 24, 36 and 60 months).At the end of each month, futures contracts are sorted into quintiles based on their average return over theprevious R months (ranking period). The decision to form quintiles was based on the fact that our cross section istoo small to accommodate deciles as is common in the literature on equity momentum. By adding more futuresto the quintile portfolios, our approach enhances risk diversification at the cost of lowering the dispersion ofreturns between the best and worst performing futures and thus the profitability of the strategies. The futurescontracts in each quintile are equally weighted.6 The performance of both the top and bottom quintiles ismonitored over the subsequent H months (holding period) over which no rebalancing takes place. We call theresulting strategy the R-H momentum or contrarian strategy.We follow the approach of Moskowitz and Grinblatt (1999) and Jegadeesh and Titman (2001) and form overlappingwinner and loser portfolios. Taking, as an example, the 6-3 momentum strategy, the winner portfolio in, say,December is formed by equally weighting the top 3 quintile portfolios that were formed at the end of September,October and November. The same applies to the loser portfolio. Its return is equal to the average return inDecember of the 3 bottom quintiles that were formed at the end of September, October and November.7 Thereturn of the momentum (contrarian) strategy is then simply defined as the difference in the December returnsof the winner (loser) and loser (winner) portfolios. The procedure is rolled over to the next month, where anotherset of winner, loser, momentum and contrarian portfolios is formed.The following multifactor model is then used to measure the profitability of the strategy after accounting forriskRPt α βB (RBt Rft ) βM (RM t Rft ) βC (RCt Rft ) εPt(1)RPt is the return of the winner, loser, or momentum portfolio, RBt, RMt and RCt are the returns on Datastreamgovernment bond index, the S&P500 composite index and GSCI (Goldman Sachs Commodity Index) respectively,Rft is the risk-free rate and εPt is an error term.As the possibility remains that the momentum profits are a compensation for time-varying risks (Chordiaand Shivakumar, 2002), we estimate a conditional model that allows for the measures of risk and abnormalperformance (βB, βM, βC and α) in (1) to vary over time as a function of Zt-1, a vector of pre-specified mean-zeroinformation variables (Christopherson et al., 1998)RPt α0 α1 Zt 1 βB 0 (RBt Rft ) βB 1 (RBt Rft ) Zt 1 βM 0 (RM t Rft ) βM 1 (RM t Rft ) Zt 1 βC 0 (RCt Rft ) βC 1 (RCt Rft ) Zt 1 εPtZt-1 includes proxies for the business cycle such as the first lag in (i) the dividend yield on the S&P500 compositeindex, (ii) the term structure of interest rates and (iii) default spread.8 The first lag on the momentum returns isalso used as a predictor of the abnormal performance of the momentum strategy one period ahead.Insignificant estimates of α in (1) and α0 in (2) indicate that the momentum returns are merely a compensationfor risk and are therefore consistent with rational pricing in an efficient market.6 - A strategy that assumes equal-weighting might prove difficult to implement in illiquid markets. To mitigate problems related to lack of liquidity, we filter out futures with average trading volume below 1,000 contracts. Another approach would have been to adopt a weighting scheme that assigns higher weights to the contracts with higher open interests. In the light of recent evidencesuggesting that trading activity enhances short-term contrarian profits in futures markets (Wang and Yu, 2004), a weighting scheme based on open interests might yield interesting results.7 - As the November winner and loser contribute towards only a third of the December momentum profits, it is reasonable to assume that the momentum profits are not driven by bid-askbounce. As a result and following Moskowitz and Grinblatt (1999), we decided not to skip a month between the ranking and holding periods.8 - The term structure is measured as the difference between the yield on US Treasury bonds with at least 10 years to maturity and the US three-month Treasury-bill rate. Default spread ismeasured as the yield difference between Moody’s Baa and Aaa-rated corporate bonds.
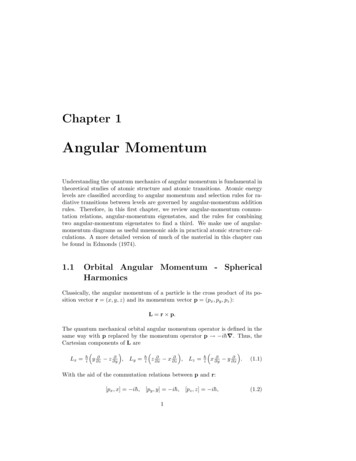
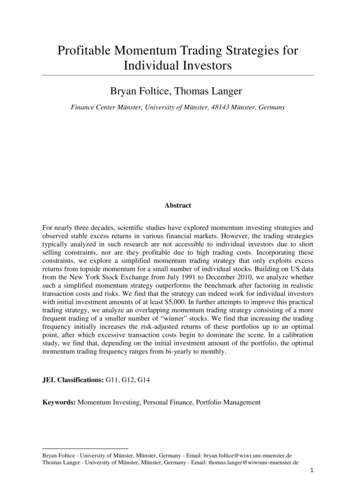
4. Momentum StrategiesThis section presents the results of our commodity-based relative-strength strategies. We focus on the profitsthat the strategies generate (Section 4.1), the risk factors that may drive the performance (Section 4.2), theconstituents of the long-short portfolios and how they relate to the propensity of commodity markets to be inbackwardation or contango (Section 4.3) and the ability of momentum portfolios to act as portfolio diversifiersand inflation hedge (Section 4.4).4.1. Momentum profitsTable 1 displays summary statistics of returns of short-term momentum strategies, where the rows represent theranking periods and the columns the holding periods. It is clear from Table 1 that the winner portfolios typicallyoutperform the loser portfolios over holding periods that range from 1 to 12 months. With only 3 exceptionsout of 16 strategies (for the 6-12, 12-6 and 12-12 momentum strategies), the difference in returns betweenthe winner and the loser portfolios is positive and significant at the 10% level. Across the 13 strategies thatare profitable, one could earn an average return of 9.38% a year by consistently buying the best performingcommodity futures and selling the worst performing ones. Over the same period, a long-only portfolio thatequally weights the 31 commodities we considered lost 2.64% a year. The results in Table 1 are in line withJegadeesh and Titman (1993, 2001) who identify short-term price continuation in equity markets. They are alsoconsistent with Erb and Harvey (2006) who observe that a 12-1 momentum strategy is profitable in commodityfutures markets.Table 1 - Summary statistics of returns of momentum strategiesThe mean and standard deviation are annualised. The reward-to-risk ratio is measured as the ratio of the annualised mean to the annualisedstandard deviation. t-ratios for the significance of the mean are in parentheses. Our definition of returns assumes that we hold contracts up toone month before maturity, at which date the position is rolled over to the second nearest contract and held up to one month prior to maturity.Futures prices are collected at a monthly frequency.Across the 13 strategies that are profitable at the 10% level, the loser portfolios always yield negative andsignificant average return that range from a low of -10.83% (for the 6-1 strategy) to a high of -5.16% (for the3-12 strategy). The evidence from the 13 winner portfolios is less strong both in economic and statistical terms.The winner portfolios offer average returns that can, at times, be negative and range from a low of -1.75% (forthe 1-12 strategy) to a high of 7.26% (for the 3-1 strategy). As in Hong et al. (2000), the price continuation incommodity futures markets is therefore mainly driven by the losers.As the possibility remains that the momentum strategies pay off as a compensation for risk, Table 1 also reportsthe annualised standard deviations and the reward-to-risk ratios of the strategies. As expected, the mostprofitable strategies rank among the most risky. For example, the 12-1 momentum strategy offers the highestaverage return (14.60%) and, with a standard deviation of 25.57%, it is also the second most volatile. On theother hand, the 1-12 momentum strategy has the lowest level of risk (8.20%) and, subsequently, the lowestaverage return (5.27%).
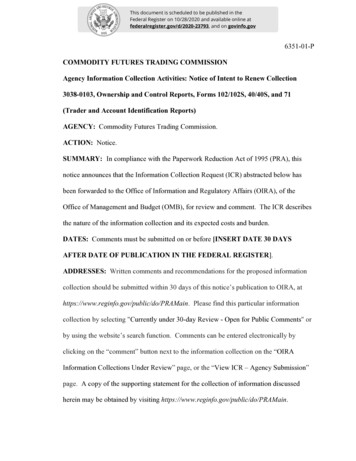
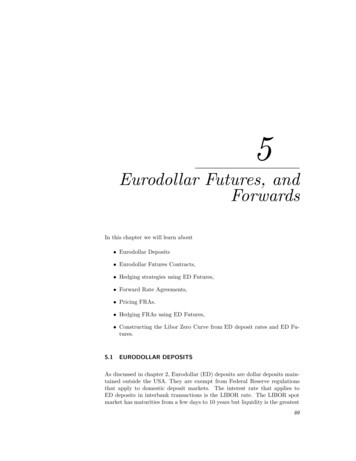
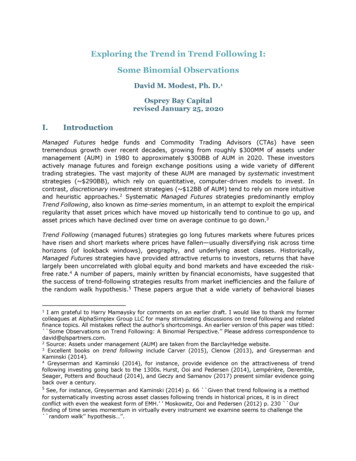
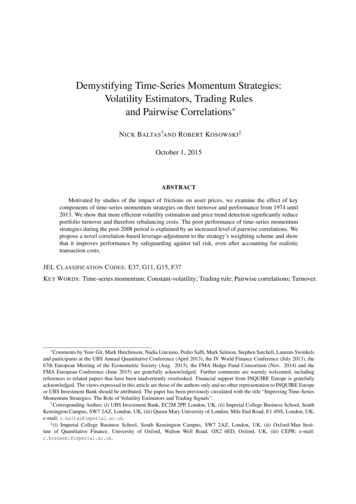
Over the period March 1979 - September 2004, a portfolio that equally weights the 31 commodity futuresconsidered in this study had a negative reward-to-risk ratio equal to -0.2442. Over the same period, the S&P500composite index had an expected Sharpe ratio of 0.3101. Simultaneously, the 13 profitable momentum strategiesin Table 1 had reward-to-risk ratios ranging from 0.3768 (for the 12-3 strategy) to 0.6681 (for the 1-6 strategy),with an average at 0.4978. This indicates that commodity-based relative-strength strategies perform better on arisk-adjusted basis than passive long-only strategies in equity and commodity futures markets.Given the recent interest of institutional investors in commodity futures, one may question whether themomentum profits identified over the period March 1979 - September 2004 in Table 1 will be sustained in thefuture. Although the past is not necessarily a reliable guide to the future, we compare the momentum riskadjusted returns in the later period (June 1998 – September 2004) to those earned in earlier periods (March 1979– July 1985, August 1985 – December 1991, January 1992 – May 1998) and use this information to test whetherthe momentum profits have decreased recently due to a rising interest of institutional investors in commodityfutures. If momentum profits have shrunk over time, it is likely that future profits will also be compressed. Thereward-to-risk ratios of the 16 momentum strategies are reported in Table 2 over four consecutive periods ofequal duration. 10 out of 16 strategies generated their best risk-adjusted return in the later period. Over the sameperiod, only one strategy (the 1-1 strategy) yielded its worst performance. As the recent interest of institutionalinvestors has not shrunk the momentum profits, one can expect the profits of the long-short strategies to besustainable in the near future too. It is also noted from Tables 1 and 2 that with relatively few exceptions (forthe 3-6 and 6-3 strategies over the period January 1992 – May 1998 and the 1-1 strategy over the period June1998 – September 2004), the 13 strategies that are profitable over the long run in Table 1 generate positive riskadjusted returns in each of the four sub-periods.Table 2 - Reward-to-risk ratios of momentum portfolios over timeThe table reports the reward-to-risk ratios of the momentum portfolios over 4 consecutive sub-periods and over the whole sample. The rewardto-risk ratio is measured as the portfolio’s annualised mean divided by its annualised standard deviation. H is the holding period of themomentum strategy.Figure 1 looks at the performance of the zero-cost winner minus loser portfolios over increasing holding periods.Consistent with Rouwenhorst (1998) and Jegadeesh and Titman (2001), the average return of the momentumportfolios for a given ranking period is U-shaped, suggesting that the initial positive relative strength (overhorizon of up to 12 months as reported in Table 1) is followed by first a negative performance (over horizons of18 to 24 months) and then a zero average return (beyond 24 months). This indicates that after the initial pricecontinuation, a subsequent price correction takes place. This is consistent with the idea that transactions byshort-term momentum traders temporarily move prices away from long-term equilibrium, eventually causingprices to overreact. Once the overreaction is acknowledged, the market is in for a correction (Barberis et al.,1998; Daniel et al., 1998; Hong and Stein, 1999). This adjustment occurs over horizons of 18 to 24 months. Notehowever that this interpretation should be treated with some caution, as the returns over holding periods of 18and 24 months, though mostly negative, are insignificant.
Figure 1 - Average momentum returns over different holding periodsThe figure presents the average returns of momentum portfolios for 4 ranking periods and for holding periods of increasing length. t-ratios forthe significance of the mean are reported in parentheses.Table 3 tests the sensitivity of the momentum results to the technique used to calculate futures returns. Relativeto Table 1, Table 3 assumes that i) the roll-over date is set to the second last Wednesday before maturity (asopposed to the last trading day of the month before maturity), and ii) at the time of the roll-over, the contractswhose maturity is the furthest away is used (as opposed to the contact with the second nearest maturity).The momentum strategies in Table 3 perform well at the 10% level for 8 combinations of ranking and holdingperiods. Across these 8 momentum strategies, the winners outperformed the losers by an average of 7.38% ayear. The momentum profits in Table 3 are therefore less significant in both economic and statistical terms thanthose reported in Table 1. Although momentum persists, the profitability of the trading strategy is found to besensitive to the way futures prices are compiled. It is likely also that the 7.38% average return is, at least in part, acompensation for the illiquidity of maturing contracts and contracts with far distant maturities. Net of liquidityrisk, the profits of the relative-strength strategies are expected to further decrease.Table 3 - Sensitivity of momentum profits to return definitionThe mean and standard deviation are annualized. The reward-to-risk ratio is measured as the ratio of the annualised mean to the annualisedstandard deviation. t-ratios for the significance of the mean are in parentheses. The difference with Table 1 is that we switch to the most distant(in place of the nearby) contract and use weekly (in place of monthly) settlement prices. Our definition of returns assumes that we hold the firstcontract up to two weeks before maturity, at which time we roll our long position to the contract whose maturity is the furthest away.4.2. Risk-based explanationsThe remainder of Section 4 focuses on the 13 momentum strategies that are profitable at the 10% level in Table1. This section tests whether the profits then identified are a compensation for risk. With this in mind, Table4 displays the sensitivities of each portfolio returns to the bond, equity and commodity futures markets and,subsequently, the abnormal performance of the momentum strategies (α in (1)). The results indicate that boththe winners and losers are sensitive to the risk factors. While the returns of 11 out of 13 momentum strategies
follow the ups and downs of GSCI, the relative-strength portfolios are truly neutral to the risks present in thebond and equity markets. As a result, the adjusted-R2 of the momentum regressions are very low.Table 4 - Static risk modelThe table reports coefficient estimates from (1). α measures abnormal performance, βB, βM and βC measures the sensitivities of returns tothe excess returns on Datastream government bond index, the S&P500 composite index and GSCI, respectively. t-ratios are in parenthesis. Tofacilitate comparison with Table 1, α has been annualised. R2 is the adjusted goodness-of-fit statistic.On average, the annualised abnormal returns of the 13 profitable momentum strategies equal 10.18%9, rangingfrom a low of 5.77% for the 1-12 strategy to a high of 16.04% for the 12-1 strategy. The 13 profitable strategiesof Table 1 have positive and significant α in Table 4. Therefore, the winner-loser profits cannot be described as acompensation for exposure to the risks we considered.10 As in Table 1, the momentum pattern is mainly driven bythe losers: at the 10% level, all 13 losers have negative and significant alphas, while only 2 winners have positiveand significant alphas. This result corroborates the conclusions of Hong et al. (2000) from equity markets.As a robustness check, Table 5 investigates whether the average returns of Table 1 are a compensation for timevarying risks. The possibility indeed remains that the profitability of the momentum strategies is driven by thewinners having higher systematic risks than the losers in up-markets and lower systematic risks than the losersin down-markets. If this is the case, the momentum profits identified in Table 1 could simply be a return forexposure to time-varying risks. To test this, model (2) conditions the measures of abnormal performance andrisks on business cycle variables. For model (2) to be well-specified, the hypotheses that α1 0, β1 {βB1, βM1,βC1} 0 and α1 β1 0 have to be rejected. Table 5 reports the p-values of these tests and α0, the conditionalabnormal performance of th
The article tests for the presence of short-term continuation and long-term reversal in commodity futures prices. While contrarian strategies do not work, the article identifies 13 profitable momentum strategies that generate 9.38% average return a year. A closer analysis of the constitue