Transcription
ANNUAL MANAGEMENT REPORT OF FUND PERFORMANCEFor the period ended December 31, 2021Short Term and Income FundNBI Preferred Equity Income FundNotes on forward-looking statementsThis report may contain forward-looking statements concerning the Fund, its future performance, its strategies or prospects or about future events or circumstances. Such forwardlooking statements include, among others, statements with respect to our beliefs, plans, expectations, estimates and intentions. The use of the expressions "foresee", "intend","anticipate", "estimate", "assume", "believe" and "expect" and other similar terms and expressions indicate forward-looking statements.By their very nature, forward-looking statements imply the use of assumptions and necessarily involve inherent risks and uncertainties. Consequently, there is a significant riskthat the explicit or implicit forecasts contained in these forward-looking statements might not materialize or that they may not prove to be accurate in the future. A number offactors could cause future results, conditions or events to differ materially from the objectives, expectations, estimates or intentions expressed in such forward-lookingstatements. Such differences might be caused by several factors, including changes in Canadian and worldwide economic and financial conditions (in particular interest andexchange rates and the prices of other financial instruments), market trends, new regulatory provisions, competition, changes in technology and the potential impact of conflictsand other international events.The foregoing list of factors is not exhaustive. Before making any investment decision, investors and others relying on our forward-looking statements should carefully considerthe foregoing factors and other factors. We caution readers not to rely unduly on these forward-looking statements. We assume no obligation to update forward-lookingstatements in the light of new information, future events or other circumstances unless applicable legislation so provides.This annual management report of fund performance contains financial highlights, but does not contain the complete annual financial statements of the investment fund. You canget a copy of the annual financial statements at your request, and at no cost, by calling 1-888-270-3941 or 514-871-2082, by writing to us at National Bank Investments AdvisoryService, 500, Place d’Armes, 12th floor, Montreal, Quebec, H2Y 2W3, by visiting our website at www.nbinvestments.ca, by visiting SEDAR’s website at www.sedar.com, or bycontacting your advisor. You may also contact us using one of these methods to request a copy of the investment fund’s proxy voting policies and procedures, proxy votingdisclosure record, or quarterly portfolio disclosure.
Management Discussion of Fund PerformanceInvestment Objective and StrategiesThe NBI Preferred Equity Income Fund’s investment objective is togenerate high dividend income while focusing on capital preservation.This Fund invests directly, or through investments in securities of othermutual funds, in a portfolio mainly composed of preferred shares ofCanadian companies and other income generating Canadian equities.The portfolio manager conducts fundamental research, but will alsoconsider quantitative and technical factors. The portfolio securitiesselection is based on knowledge of the company, its industry and itsgrowth prospects. An extensive credit analysis for each security and anassessment of the risk profiles, the relative performance and thegeneral conditions are completed in order to confirm the selection andthe relative weight of each portfolio security. It is expected thatinvestments in foreign securities will not exceed approximately 10% ofthe Fund's assets.RisksThe global investment risk of the Fund remains as described in thesimplified prospectus or any amendments thereto and Fund Facts.Results of OperationsFor the twelve-month period ended December 31, 2021, the NBIPreferred Equity Income Fund’s Investor Series units returned 24.50%compared to 19.35% for the Fund’s benchmark, the S&P/TSX PreferredShare Index (CAD). Unlike the benchmark, the Fund’s performance iscalculated after fees and expenses. Please see the Past Performancesection for the returns of all of the Fund’s series, which may vary mainlybecause of fees and expenses.The Fund's net asset value rose by 44.19% over the period, from 564.45 million as at December 31, 2020 to 813.88 million as atDecember 31, 2021.The increase stemmed mainly from unit purchases by investors in theFund and market fluctuations.The Canadian preferred share market had a remarkable year in terms ofperformance. In fact, 2021 was the best year since 2009, following thefinancial crisis. Many factors contributed to outstanding returnsincluding a significant rise in interest rates, the lack of new supply, aswell as the major redemption activity by issuers, which led to anunbalanced supply/demand environment.During the year, the 5-Year Government of Canada bond yield morethan doubled, starting at 0.39% and ending the period at 1.26%. Thesecircumstances were beneficial for floating rate and fixed-resetperpetuals which tend to perform well in a rising rate environment.Effectively, they stood out with gains of 52.9% and 29.5% respectively,while fixed-rate perpetuals lagged far behind with a return of 9.2%.The lack of supply in the preferred share market became more evidentQ1, with the launch of the first non-banks Limited Recourse CapitalNotes (LRCN) issued by Empire Life Insurance, followed a few days laterby Manulife Financial, which has been a significant preferred shareissuer in the past. Canadian financial institutions also transitionedtoward this new form of financing rather than traditional preferredshares. In addition to LRCN issuance, in Q4, Royal Bank of Canadaannounced a new innovative Additional Tier 1 Product for the Canadianmarket, a 1,000 Par fixed-reset Preferred Share with a Non-ViabilityContingency Clause (NVCC). The concept of a 1,000 Par preferred isquite common in the U.S. market but had never been introduced intoCanada until now. This new preferred share looks like a traditional 25par fixed-reset preferred share issue, but it was sold specifically toinstitutional investors, excluding retail investors. This is important tothe banks regulator (OSFI) as it feels like they would want to see theelimination of retail participation in long-term convertible capital (i.e.NVCC) at the Canadian Banks.In addition, massive redemptions of preferred shares by several issuerscontributed to price appreciation for shares trading in the secondarymarket, as investors attempted to replace redeemed securities andcould not rely on new issues.In this context, the Fund outperformed its benchmark by 515 bps for theyear. The strong performance is mainly the result of the changesundertaken over the last 18 months, more specifically since theannouncement of the first LRCN. At that time, the portfolio manager hasanticipated the significant redemption activity that would transpire anddecided to position the portfolio towards lower back end fixed-resetissues. The demand for that type of product would increase in hisopinion, as the market worked through redemptions and capitalredeployment, which turned out to be right.Recent DevelopmentsThe outlook for preferred shares has improved as we work through theCOVID-19 variants. In reviewing the key drivers of market performance,the portfolio manager notes that while some elements are more difficultto predict, there are nevertheless some encouraging signs for this assetclass over the next 12-18 months.However, the portfolio manager thinks that a decent part of the capitalappreciation has been realized, and expects limited spreadcompression potential on the horizon. Nonetheless, preferred sharesstill remain very attractive on a relative standpoint to other fixedincome markets.In addition, preferred shares tend to outperform bonds in a risinginterest rate environment, which can be particularly useful indiversifying and protecting fixed income portfolios against interest raterisk.Over the next few months, redemptions of preferred shares fromCanadian Banks are expected to continue, refinanced by LRCN issues.These circumstances will leave investors with cash that needs to bereinvested in the secondary market, due to the lack of new issues,which should be supportive for the overall asset class.On April 30, 2021, the Fund’s independent review committee (the“IRC”) was reduced to three members when Yves Julien resigned as IRCmember. On May 1, 2021, the Fund’s IRC was increased to fourmembers when Paul Béland was appointed as IRC member.Related Party TransactionsNational Bank of Canada (“the Bank”) and its affiliated companies’roles and responsibilities related to the Fund are as follows:Trustee, Custodian, and RegistrarNatcan Trust Company (“NTC”), a direct or indirect wholly-ownedsubsidiary of the Bank, is the Fund’s trustee. In this capacity, it is thelegal owner of the Fund’s investments.NTC acts as registrar for the Fund’s securities and the names ofsecurityholders. NTC also acts as the Fund’s custodian. The fees forNTC’s custodial services are based on the standard rates in effect atNTC.Agent for securities lending transactionsNTC acts as the agent for securities lending transactions acts on behalfof the Fund in administering securities lending transactions enteredinto by the Fund. NTC is an affiliate of the Manager.Fund ManagerThe Fund is managed by National Bank Investments Inc. (“NBII”), whichis a wholly-owned subsidiary of the Bank. Therefore, NBII provides orensures the provision of all general management and administrativeservices required by the Fund’s current operations, includinginvestment consulting, the arrangement of brokerage contracts for thepurchase and sale of the investment portfolio, bookkeeping and otheradministrative services required by the Fund.NBI Preferred Equity Income Fund
The Manager pays the operating expenses of the Fund other than its“Fund costs” (defined below) (the “variable operating expenses”), inexchange for the Fund’s payment to the Manager of annual fixed-rateadministration fees with respect to each series of the Fund.The administration fees are equal to a specified percentage of the netasset value of each series of the Fund, calculated and paid in the samemanner as the Fund’s management fees. The variable operatingexpenses payable by the Manager include, but are not limited to:transfer agency and recordkeeping costs; custodial costs; accountingand valuation fees; audit fees and legal fees; costs of preparing anddistributing financial reports, simplified prospectuses, annualinformation forms, Fund Facts, continuous disclosure material andother securityholder communications; and costs of trustee servicesrelating to registered tax plans, as applicable.In addition to administration fees, the Fund shall also pay certain Fundcosts, namely: taxes (including, but not limited to, GST/HST andincome taxes); costs of compliance with any changes to existinggovernmental or regulatory requirements introduced afterAugust 1, 2013; costs of compliance with any new governmental orregulatory requirements, including any new fees introduced afterAugust 1, 2013; interest and borrowing costs; costs related to externalservices that were not commonly charged in the Canadian mutual fundindustry as at August 1, 2013; Independent Review Committee costs,including compensation paid to IRC members, travel expenses,insurance premiums and costs associated with their continuingeducation; and variable operating expenses incurred outside of thenormal course of business of the Fund.The Manager may, from time to time and at its sole discretion, decide toabsorb a portion of a series’ management fees, administration fees orFund costs.As described under the heading Management Fees, the Fund paysannual management fees to NBII as consideration for its services.Distribution and Dealer CompensationNBII acts as principal distributor for the Fund. In this capacity, NBIIbuys, sells and swaps securities through Bank branches and theNational Bank Investments Advisory Service in Canadian provinces andterritories, and through external registered representatives. Fundsecurities are also offered by National Bank Financial Inc. (including itsdivision National Bank Direct Brokerage), CABN Investments (a divisionof NBII) and other affiliated entities. Brokers may receive, depending onthe distributed series, a monthly commission representing apercentage of the average daily value of the securities held by theirclients.As at December 31, 2021, Intact Insurance Company held 21,807,719.50Fund securities for a value of 253,841,855.00, which representedclose to 31.3073% of the net asset value of the Fund at that date.Transactions between Intact Insurance Company and the Fund werecarried out in the normal course of business and at the Fund’s net assetvalue as at the transaction date.Independent Review Committee Approvals and RecommendationsThe Fund followed the standing instructions of its Independent ReviewCommittee with respect to one or more of the following transactions:a) Purchasing or holding the securities of a related issuer, inparticular, those of National Bank of Canada;b) Investing in the securities of an issuer when an entity related tothe manager acts as an underwriter for the placement or at anytime during the 60-day period after the end of the placement;c) Purchasing or selling securities to another investment Fundmanaged by the manager or a company in the same group;d) Purchasing or selling debt securities on the secondary market,through related brokers that are main brokers in the Canadiandebt securities market (in accordance with an exemptionreceived from the Canadian Securities Administrators);e) Entering into foreign exchange transactions (including both spottransactions and forward transactions) with National Bank ofCanada.The Manager has implemented policies and procedures to make surethat the conditions applicable to each of the above transactions aremet. The applicable standing instructions require that thesetransactions be carried out in accordance with NBII policies, whichspecify, in particular, that investment decisions pertaining to theserelated party transactions must be made free from any influence by anentity related to NBII and without taking into account any considerationrelevant to an entity related to NBII. Furthermore, the investmentdecisions must represent the business judgment of the securitiesadvisor, uninfluenced by considerations other than the best interest ofthe Fund and must achieve a fair and reasonable result for the Fund.Registered Plan Trust ServicesNTC receives a fixed amount per registered account for servicesprovided as trustee for registered plans.Administrative and Operating ServicesThe provision of certain services was delegated by the Fund Manager,NBII, to National Bank Trust Inc. ("NBT"), a wholly-owned indirectsubsidiary of the Bank. These include accounting, reporting andportfolio valuation services. The fees incurred for these services arepaid to NBT by the Fund manager.Brokerage FeesThe Fund may pay broker’s commissions at market rates to acorporation affiliated with NBII. The brokerage fees paid by the Fund forthe period are as follows:Period endedDecember 31, 2021Total brokerage feesBrokerage fees paid to National BankFinancial528,907.25-HoldingsAs at December 31, 2021, National Bank Investments Inc. held 153.82Fund securities for a value of 1,790.52, which represented close to0.0002% of the net asset value of the Fund at that date. Transactionsbetween National Bank Investments Inc. and the Fund were carried outin the normal course of business and at the Fund’s net asset value as atthe transaction date.NBI Preferred Equity Income Fund
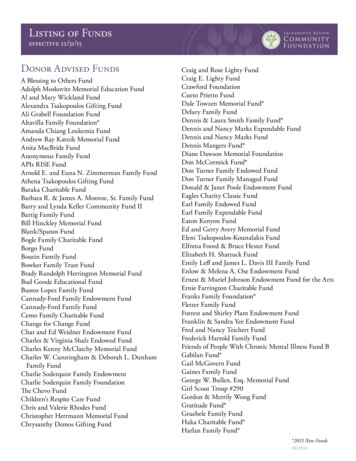
Management FeesAdvisor Series30%The Fund pays annual management fees to the Fund manager for itsmanagement services. The fees are calculated based on a percentageof the Fund’s daily net asset value before applicable taxes and are paidon a monthly basis. A portion of the management fees paid by the Fundcovers maximum annual trailer fees and sales commissions paid tobrokers. The remainder of the management fees primarily coversinvestment management and general administration services. Thebreakdown of major services provided in consideration of themanagement fees, expressed as an approximate percentage of themanagement fees is as 1920202021Series FSeriesManagementFeesInvestor 0.00%1.25%60.00%40.00%Back-end load - 1 to 6 years1.25%20.00%80.00%1.25%60.00%40.00%Low load - 1 to 3 years1.25%20.00%80.00%Low load - 4 years and more1.25%60.00%40.00%Series F0.50%—100.00%Series )Past urns for the period from October 30, 2015 (commencement of operations) toDecember 31, 2015.The performance of each series of the Fund is presented below andcalculated as at December 31 of each year. It assumes that alldistributions made in the periods shown were reinvested in additionalsecurities and does not take into account sales, redemption charges,distributions, or optional charges that would have reduced returns.Past performance of a series of a Fund does not necessarily indicatehow it will perform in the future.Annual Compounded PerformanceAnnual ReturnsNBI Preferred Equity Income Fund24.50202114.328.176.88There are no management fees paid by the Fund with respect to the Series O. Instead,Series O securityholders pay a negociated administration fee directly to National BankInvestments.Investor Series202026.31Excluding sales commissions paid on the Advisor Series with the low sales chargeoption and deferred sales charge option, which are not paid for out of themanagement fees.30%2019Series OIncludes all costs related to management, investment advisory services, generaladministration and profit.The bar charts indicate the performance for each the Fund's series inexistence greater than one year during the years shown, and illustratehow the performance has changed from year to year. They show, inpercentage terms, how much an investment made on January 1 (ormade commencing from the start of the series) would have grown ordecreased by December 31 of that year, in the case of the Annualmanagement report of fund performance, or by June 30, in the case ofthe Interim management report of fund performance.201840%20%(**)4.260.050%-20%Back-end load - 7 years andmore(†)7.556.23Advisor Series*Front-end load13.52The following table shows the Fund's annual compound returns foreach series in existence greater than one year and for each of theperiods ended on December 31, 2021, compared with the followingbenchmark: S&P/TSX Preferred Share Index (CAD)Since5 years 10 years inception1 year3 yearsInvestor ��–7.41%6.78%Advisor .29%3.19%––Series .19%––Series .19%––1Commencement of operations: October 30, 2015Commencement of operations: November 22, 2007Commencement of operations: May 16, 200820%212.6010%35.903.341.536.81A discussion of the Fund's relative performance in comparison to theindex (or indices) can be found in the Results of Operations Section ofthis ex DescriptionThe S&P/TSX Preferred Share Index is a subset of the S&P/TSX Indexand reflects the preferred share price fluctuations of a group ofcompanies listed on the Toronto Stock Exchange and weighted bymarket capitalization.NBI Preferred Equity Income Fund
Financial HighlightsThe following tables show selected key financial information about the Fund and are intended to help you understand the Fund’s financial performancefor the accounting periods shown.Investor* / Advisor Series(*)The Investor Series was created on October 30, 2015.(1)Net Assets per UnitCommencement of operations: November 22, 20072021December 31Accounting Period EndedNet Assets, Beginning of Accounting Period Shown(4)9.422020December 319.202019December 319.232018December 3110.212017December 319.34Increase (Decrease) from Operations ( )Total revenue0.490.500.490.470.44Total expenses(0.18)(0.14)(0.15)(0.17)(0.17)Realized gains (losses)0.21(0.16)(0.22)0.080.34Unrealized gains 18Total Increase (Decrease) from Operations ( ) (2)Distributions ( )From net investment income (excluding dividends)—————0.300.350.340.320.30From capital gains—————Return of capital—————Total Annual Distributions ( ) (3)0.300.350.340.320.30Net Assets, End of Accounting Period Shown ( ) (4)11.409.429.209.2310.21From dividendsRatios and Supplemental Data2021December 31Accounting Period EndedTotal net asset value (000's of )(5)2020December 312019December 312018December 312017December 757,32113,953,75115,812,36118,457,708Management expense ratio (%) (6)1.541.551.551.551.55Management expense ratio before waivers or absorptions (%)1.541.551.551.551.55Trading expense ratio (%) (7)0.070.100.120.140.16Portfolio turnover rate (%) (8)18.8324.2843.7247.9555.26Net asset value per unit ( )11.409.429.209.2410.21Number of units outstanding (5)Series F(1)Net Assets per UnitAccounting Period EndedNet Assets, Beginning of Accounting Period Shown (4)Commencement of operations: May 16, 20082021December 319.772020December 319.522019December 319.542018December 3110.542017December 319.61Increase (Decrease) from Operations ( )Total revenue0.510.520.510.490.45Total expenses(0.09)(0.07)(0.08)(0.09)(0.09)Realized gains (losses)0.22(0.15)(0.23)0.090.36Unrealized gains 24Total Increase (Decrease) from Operations ( ) (2)Distributions ( )From net investment income (excluding dividends)—————0.400.410.420.400.36From capital gains—————Return of capital—————Total Annual Distributions ( ) (3)0.400.410.420.400.36Net Assets, End of Accounting Period Shown ( ) (4)11.839.779.529.5410.54From dividendsRatios and Supplemental DataAccounting Period EndedTotal net asset value (000's of ) (5)2021December 312020December 312019December 312018December 312017December 301,69722,670,07323,227,74419,333,701Management expense ratio (%) (6)0.720.720.710.710.71Management expense ratio before waivers or absorptions (%)0.720.720.710.710.71Trading expense ratio (%) (7)0.070.100.120.140.16Portfolio turnover rate (%) (8)18.8324.2843.7247.9555.26Net asset value per unit ( )11.839.779.529.5510.54Number of units outstanding (5)NBI Preferred Equity Income Fund
Series O(1)Net Assets per UnitAccounting Period EndedCommencement of operations: November 22, 20072021December 31Net Assets, Beginning of Accounting Period Shown (4)9.612020December 319.362019December 319.372018December 3110.362017December 319.46Increase (Decrease) from Operations ( )Total revenue0.500.510.500.480.44Total expenses(0.01)(0.01)(0.01)(0.02)(0.02)Realized gains (losses)0.23(0.16)(0.23)0.080.34Unrealized gains 33Total Increase (Decrease) from Operations ( ) (2)Distributions ( )From net investment income (excluding dividends)—————0.460.470.460.470.44From capital gains—————Return of capital—————Total Annual Distributions ( ) (3)0.460.470.460.470.44Net Assets, End of Accounting Period Shown ( ) (4)11.649.619.369.3710.36From dividendsRatios and Supplemental DataAccounting Period Ended2021December 31Total net asset value (000's of ) (5)2020December 312019December 312018December 312017December 428,81815,532,26112,445,28111,876,802Management expense ratio (%) (6)0.020.020.020.020.02Management expense ratio before waivers or absorptions (%)0.020.020.020.020.02Trading expense ratio (%) (7)0.070.100.120.140.16Portfolio turnover rate (%) (8)18.8324.2843.7247.9555.26Net asset value per unit ( )11.649.619.369.3810.36Number of units outstanding (5)(1)This information is derived from the Fund's Annual Audited Financial Statements. The net assets per unit presented in the financial statements might differ from the net asset valuecalculated for fund pricing purposes. The differences are explained in the notes to the financial statements.(2)Net assets and distributions are based on the actual number of units outstanding at the relevant time. The increase or decrease from operations is based on the average number of unitsoutstanding over the accounting period.(3)Distributions were paid in cash or reinvested in additional units of the Fund, or both.(4)The net assets are calculated in accordance with IFRS.(5)This information is provided as at the last day of the accounting period shown.(6)Management expense ratio is based on total expenses including sales taxes for the accounting period indicated (excluding commission, other portfolio transaction costs and withholdingtaxes) and is expressed as an annualized percentage of daily average net value during the accounting period.(7)The trading expense ratio represents total commissions and other portfolio transaction costs expressed as an annualized percentage of daily average net asset value during the accountingperiod. The trading expense ratio includes, if necessary, the trading expenses from its underlying funds, as described in Article 15.2 of Regulation 81-106.(8)The Fund's portfolio turnover rate indicates how actively the Fund portfolio's manager manages its portfolio investments. A portfolio turnover rate of 100% is equivalent to the Fund buyingand selling all of the securities in its portfolio once in the course of the accounting period. The higher a Fund's portfolio turnover rate in an accounting period, the greater the trading costspayable by the Fund in the accounting period, and the greater the chance of an investor receiving taxable capital gains in the accounting period. There is not necessarily a relationshipbetween a high turnover rate and the performance of a Fund.NBI Preferred Equity Income Fund
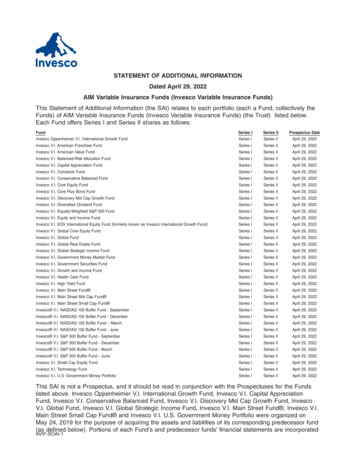
Summary of Investment PortfolioAs of December 31, 2021Portfolio Top HoldingsCash, Money Market and Other Net AssetsEnbridge Inc., 4.96%, Series LBrookfield Asset Management Inc., 3.01%, Series 24Brookfield Asset Management Inc., 3.47%, Series 26Power Financial Corp., 2.31%, Series PBank of Montreal, 3.90%, Series 29Brookfield Asset Management Inc., 2.73%, Series 28-ABrookfield Renewable Power Inc., 3.36%, Series 1TC Energy Corp., 4.25%, Series 9Brookfield Properties Corp., 3.78%, Class AAA, Series NToronto-Dominion Bank, 3.80%, Series 3Brookfield Renewable Power Inc., 4.40%, SeriesPower Financial Corp.Sun Life Financial Inc., 4.50%, Series 5Enbridge Inc., 3.42%, Series BEnbridge Inc., 4.00%, Series 3Brookfield Properties Corp., 4.16%, Class AAA, Series RCanadian Utilities Ltd., 4.60%, Series 1Power Financial Corp., 4.95%, Series KEnbridge Inc., 4.89%, Series JFortis Inc., 4.10%, Series MCanadian Imperial Bank of Commerce, 3.90%, Series 39Bank of Montreal, 4.00%, Series 27Brookfield Asset Management Inc., 4.50%, Series 40Power Financial Corp., 4.20%, Series TNet asset valueSector Allocation% of NetAsset UtilitiesCommunication ServicesReal EstateCash, Money Market and Other Net Assets% of NetAsset Value56.417.313.75.84.22.6 813,883,729The above table shows the top 25 positions held by the Fund. In the case of a Fund with fewer than 25 positions, all positions are indicated.The Summary of Investment Portfolio may change due to ongoing portfolio transactions of the investment Fund. A quarterly update is available. Pleaseconsult our Web site at www.nbinvestments.ca.NBI Preferred Equity Income Fund
normal course of business of the Fund. The Manager may, from time to time and at its sole discretion, decide to absorb a portion of a series' management fees, administration fees or Fund costs. As described under the heading Management Fees, the Fund pays annual management fees to NBII as consideration for its services.