Transcription
LUDWIGMAXIMILIANSUNIVERSITÄTMÜNCHENINSTITUTE FORINFORMATICSDATABASESYSTEMSGROUPThe 2010 SIAM International Conference on Data MiningOutlier Detection TechniquesqHans-Peter Kriegel, Peer Kröger, Arthur ans Universität MünchenMunich, zimek}@dbs.ifi.lmu.deTutorial Notes: SIAM SDM 2010, Columbus, Ohio
DATABASESYSTEMSGROUPGeneral Issues1. Please feel free to ask questions at any time during thepresentation2 Aim2.Ai off ththe ttutorial:t i l gett ththe bibig picturei t– NOT in terms of a long list of methods and algorithms– BUT in terms of the basic algorithmic approaches– Sample algorithms for these basic approaches will be sketched The selection of the presented algorithms is somewhat arbitrarygis missinggPlease don’t mind if yyour favorite algorithmAnyway you should be able to classify any other algorithm not coveredhere by means of which of the basic approaches is implemented3 The revised version of tutorial notes will soon be available3.on our websitesKriegel/Kröger/Zimek: Outlier Detection Techniques (SDM 2010)2
DATABASESYSTEMSGROUPIntroductionWhat is an outlier?Definition of Hawkins [Hawkins 1980]:“An outlier is an observation which deviates so much from the otherobservations as to arouse suspicions that it was generated by a differentmechanismmechanism”Statistics-based intuition– Normal data objects follow a “generating mechanism”, e.g. somegiven statistical process– Abnormal objects deviate from this generating mechanismKriegel/Kröger/Zimek: Outlier Detection Techniques (SDM 2010)3
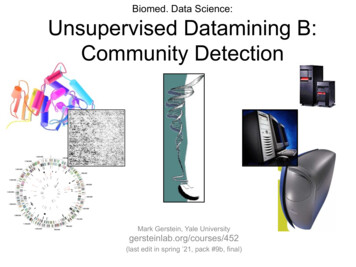
DATABASESYSTEMSGROUPIntroduction Example: Hadlum vs. Hadlum (1949) [Barnett 1978] The birth of a child to Mrs.Hadlum happened 349 daysafter Mr. Hadlum left formilitaryilitservice.i Average human gestationperiod is 280 days (40weeks). StatisticallyStatistically, 349 days is anoutlier.Kriegel/Kröger/Zimek: Outlier Detection Techniques (SDM 2010)4
IntroductionDATABASESYSTEMSGROUP Example: Hadlum vs. Hadlum (1949) [Barnett 1978] blue: statistical basis (13634observations of gestation periods) green: assumed underlyingGaussian processp Very low probability for the birth ofMrs. Hadlums child for beinggenerated by this process red:d assumptionti off Mr.M HadlumH dl(another Gaussian processresponsible for the observed birth,where the ggestation pperiodresponsible) Under this assumption thegestation period has an averageduration and highest-possibleprobabilityKriegel/Kröger/Zimek: Outlier Detection Techniques (SDM 2010)5
DATABASESYSTEMSGROUPIntroduction Sample applications of outlier detection– Fraud detection Purchasing behavior of a credit card owner usually changes when thecard is stolen Abnormal buying patterns can characterize credit card abuse– Medicine Unusual symptoms or test results may indicate potential health problemsof a patient Whether a particular test result is abnormal may depend on othercharacteristics of the patients (e.g. gender, age, )– Public health The occurrence of a particular disease, e.g. tetanus, scattered acrossvarious hospitals of a city indicate problems with the correspondingvaccination program in that city Whether an occurrence is abnormal depends on different aspects likefrequency, spatial correlation, etc.Kriegel/Kröger/Zimek: Outlier Detection Techniques (SDM 2010)6
DATABASESYSTEMSGROUPIntroduction Sample applications of outlier detection (cont.)– Sports statistics In many sports,sports various parameters are recorded for players in order toevaluate the players’ performances Outstanding (in a positive as well as a negative sense) players may beidentified as havingg abnormal pparameter values Sometimes, players show abnormal values only on a subset or a specialcombination of the recorded parameters– Detectingg measurement errors Data derived from sensors (e.g. in a given scientific experiment) maycontain measurement errors Abnormal values could provide an indication of a measurement error Removing such errors can be important in other data mining and dataanalysis tasks “One person‘s noise could be another person‘s signal.”– Kriegel/Kröger/Zimek: Outlier Detection Techniques (SDM 2010)7
DATABASESYSTEMSGROUPIntroduction Discussion of the basic intuition based on Hawkins– Data is usually multivariate, i.e., multi-dimensional basic model is univariate,univariate ii.e.,e 11-dimensionaldimensional– There is usually more than one generating mechanism/statisticalprocess underlying the data basicb i modeld l assumes onlyl one ““normal”l” generatingti mechanismh i– Anomalies may represent a different class (generating mechanism) ofobjects, so there may be a large class of similar objects that are theoutlierstli basic model assumes that outliers are rare observations Consequence:qa lot of models and approachespphave evolvedin the past years in order to exceed these assumptions and itis not easy to keep track with this evolution. NewNmodelsd l oftenft iinvolvel ttypical,i l new, ththoughh usuallyllhidden assumptions and restrictions.Kriegel/Kröger/Zimek: Outlier Detection Techniques (SDM 2010)8
DATABASESYSTEMSGROUPIntroduction General application scenarios– Supervised scenario In some applications,applications training data with normal and abnormal dataobjects are provided There may be multiple normal and/or abnormal classesOften the classification problem is highly unbalanced Often,– Semi-supervised Scenario In some applications, only training data for the normal class(es) (or onlythe abnormal class(es)) are provided– Unsupervised Scenario In most applications there are no training data available In this tutorial, we focus on the unsupervised scenarioKriegel/Kröger/Zimek: Outlier Detection Techniques (SDM 2010)9
DATABASESYSTEMSGROUPIntroduction Are outliers just a side product of some clusteringalgorithms?– Many clustering algorithms do not assign all points to clusters butaccount for noise objects– Look for outliers by applying one of those algorithms and retrieve thenoise set– Problem: Clustering algorithms are optimized to find clusters rather than outliers Accuracy of outlier detection depends on how good the clusteringalgorithm captures the structure of clusters A sett off many abnormalblddatat objectsbj t ththatt are similari il tto eachh otherth wouldldbe recognized as a cluster rather than as noise/outliersKriegel/Kröger/Zimek: Outlier Detection Techniques (SDM 2010)10
DATABASESYSTEMSGROUPIntroduction We will focus on three different classification approaches– Global versus local outlier detectionConsiders the set of reference objects relative to which each point’spoint s“outlierness” is judged– Labeling versus scoring outliersConsiders the output of an algorithm– Modeling propertiesConsiders the concepts based on which “outlierness” is modeledNOTE: we focusNOTEfon modelsd l andd methodsth d forf EuclideanE liddatad t butb t manyof those can be also used for other data types (because they onlyrequire a distance measure)Kriegel/Kröger/Zimek: Outlier Detection Techniques (SDM 2010)11
DATABASESYSTEMSGROUPIntroduction Global versus local approaches– Considers the resolution of the reference set w.r.t. which the“outlierness”outlierness of a particular data object is determined– Global approaches The reference set contains all other data objects Basic assumption: there is only one normal mechanism Basic problem: other outliers are also in the reference set and may falsifythe results– Local approaches The reference contains a (small) subset of data objects No assumption on the number of normal mechanisms Basic problem: how to choose a proper reference set– NOTE: Some approaches are somewhat in between The resolution of the reference set is varied e.g. from only a single object(local) to the entire database (global) automatically or by a useruser-defineddefinedinput parameterKriegel/Kröger/Zimek: Outlier Detection Techniques (SDM 2010)12
DATABASESYSTEMSGROUPIntroduction Labeling versus scoring– Considers the output of an outlier detection algorithm– Labeling approaches Binary output Data objects are labeled either as normal or outlier– ScoringS i approachesh Continuous output For each object an outlier score is computed (e.g. the probability forb i an outlier)beingtli ) Data objects can be sorted according to their scores– Notes Many scoring approaches focus on determining the top-n outliers(parameter n is usually given by the user) Scoring approaches can usually also produce binary output if necessary(e g by defining a suitable threshold on the scoring values)(e.g.Kriegel/Kröger/Zimek: Outlier Detection Techniques (SDM 2010)13
DATABASESYSTEMSGROUPIntroduction Approaches classified by the properties of the underlyingmodeling approach– Model-basedModel based Approaches Rational– Apply a model to represent normal data points– Outliers are points that do not fit to that model Sample approaches––––Probabilistic tests based on statistical modelsDepth-basedept based appapproachesoac esDeviation-based approachesSome subspace outlier detection approachesKriegel/Kröger/Zimek: Outlier Detection Techniques (SDM 2010)14
DATABASESYSTEMSGROUPIntroduction– Proximity-based Approaches Rational– Examine the spatial proximityy of each objectjin the data space– If the proximity of an object considerably deviates from the proximity of otherobjects it is considered an outlier Sample approaches– DiDistance-basedtbd approachesh– Density-based approaches– Some subspace outlier detection approaches– Angle-basedAngle based approaches Rational– Examine the spectrum of pairwise angles between a given point and all otherppoints– Outliers are points that have a spectrum featuring high fluctuationKriegel/Kröger/Zimek: Outlier Detection Techniques (SDM 2010)15
duction Statistical TestsDepth-based ApproachesDeviation-based ApproachesDistance based ApproachesDistance-basedDensity-based ApproachesHigh-dimensionalHighdimensional ApproachesSummaryKriegel/Kröger/Zimek: Outlier Detection Techniques (SDM 2010)statisticalt ti ti l modeld lmodel based on spatial proximityadaptation of different modelsto a special problem16
DATABASESYSTEMSGROUPStatistical Tests General idea– Given a certain kind of statistical distribution (e.g., Gaussian)– Compute the parameters assuming all data points have beengenerated by such a statistical distribution (e.g., mean and standarddeviation)– Outliers are points that have a low probability to be generated by theoverall distribution (e.g., deviate more than 3 times the standarddeviation from the mean) Basic assumption– Normal data objects follow a (known) distribution and occur in a highprobability region of this model– Outliers deviate strongly from this distributionKriegel/Kröger/Zimek: Outlier Detection Techniques (SDM 2010)17
Statistical TestsDATABASESYSTEMSGROUP A huge number of different tests are available differing in– Type of data distribution (e.g. Gaussian)– Number of variables,variables i.e.,i e dimensions of the data objects(univariate/multivariate)– Number of distributions (mixture models)– ParametricPt i versus non-parametrict i ((e.g. hihistogram-based)tbd) Examplep on the followingg slides––––Gaussian distributionMultivariate1 modelParametricKriegel/Kröger/Zimek: Outlier Detection Techniques (SDM 2010)18
DATABASESYSTEMSGROUPStatistical Tests Probability density function of a multivariate normaldistributionN ( x) 1(2π )d Σ e ( x μ ) T Σ 1 ( x μ )2– μ is the mean value of all points (usually data is normalized such thatμ 0)– Σ is the covariance matrix from the mean– MDist ( x, μ ) ( x μ ) T Σ 1 ( x μ ) is the Mahalanobis distance ofpoint x to μ– MDist follows a χ2-distribution with d degreesgof freedom ((d datadimensionality)– All points x, with MDist(x,μ) χ2(0,975)[ 3.σ]Kriegel/Kröger/Zimek: Outlier Detection Techniques (SDM 2010)19
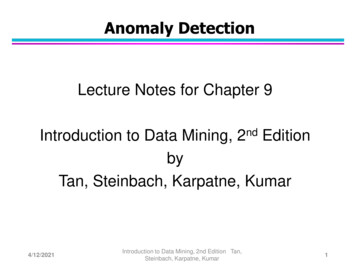
DATABASESYSTEMSGROUPStatistical Tests Visualization (2D) [Tan et al. 2006]Kriegel/Kröger/Zimek: Outlier Detection Techniques (SDM 2010)20
DATABASESYSTEMSGROUPStatistical Tests Problems– Curse of dimensionality The larger the degree of freedomfreedom, the more similar the MDist values forall pointsx-axis:xaxis: observed MDist valuesy-axis: frequency of observationKriegel/Kröger/Zimek: Outlier Detection Techniques (SDM 2010)21
Statistical TestsDATABASESYSTEMSGROUP Problems (cont.)– Robustness Mean and standard deviation are very sensitive to outliers These values are computed for the complete data set (including potentialoutliers) The MDist is used to determine outliers although the MDist values areinfluenced by these outliers Minimum Covariance Determinant [Rousseeuw and Leroy 1987]minimizes the influence of outliers on the Mahalanobis distance Discussion––––Data distribution is fixedLLowflflexibilityibili ((no mixtureimodel)d l)Global methodOutputs a label but can also output a scoreKriegel/Kröger/Zimek: Outlier Detection Techniques (SDM 2010)μDB22
duction Statistical Tests Depth-based ApproachesDeviation-based ApproachesDistance based ApproachesDistance-basedDensity-based ApproachesHigh-dimensionalHighdimensional ApproachesSummaryKriegel/Kröger/Zimek: Outlier Detection Techniques (SDM 2010)23
DATABASESYSTEMSGROUPDepth-based Approaches General idea– Search for outliers at the border ofthe data space but independent ofstatistical distributions– Organize data objects inconvex hull layers– Outliers are objects on outer layers Basic assumptionPicture taken from [Johnson et al. 1998]– Outliers are located at the border of the data space– Normal objects are in the center of the data spaceKriegel/Kröger/Zimek: Outlier Detection Techniques (SDM 2010)24
DATABASESYSTEMSGROUPDepth-based Approaches Model [Tukey 1977]– Points on the convex hull of the full data space have depth 1– Points on the convex hull of the data set after removing all points withdepth 1 have depth 2– – PointsP i t havingh i addepthth k are reportedt d as outlierstliPicture taken from [Preparata and Shamos 1988]Kriegel/Kröger/Zimek: Outlier Detection Techniques (SDM 2010)25
DATABASESYSTEMSGROUPDepth-based Approaches Sample algorithms– ISODEPTH [Ruts and Rousseeuw 1996]– FDC [Johnson et al. 1998] Discussion– Similar idea like classical statistical approaches (k 1 distributions)but independent from the chosen kind of distribution– CoConvexe hullu computationco putat o iss usuausuallyyoonlyyeefficientc e t in 2D / 33D spaces– Originally outputs a label but can be extended for scoring easily (takedepth as scoring value)– Uses a global reference set for outlier detectionKriegel/Kröger/Zimek: Outlier Detection Techniques (SDM 2010)26
duction Statistical Tests Depth-based Approaches Deviation-based ApproachesDistance based ApproachesDistance-basedDensity-based ApproachesHigh-dimensionalHighdimensional ApproachesSummaryKriegel/Kröger/Zimek: Outlier Detection Techniques (SDM 2010)27
DATABASESYSTEMSGROUP Deviation-based ApproachesGeneral idea– Given a set of data points (local group or global set)– Outliers are points that do not fit to the general characteristics of thatset, i.e., the variance of the set is minimized when removing theoutliers Basic assumption– Outliers are the outermost points of the data setKriegel/Kröger/Zimek: Outlier Detection Techniques (SDM 2010)28
DATABASESYSTEMSGROUP Deviation-based ApproachesModel [Arning et al. 1996]– Given a smoothing factor SF(I) that computes for each I DB howmuch the variance of DB is decreased when I is removed from DB– With equal decrease in variance, a smaller exception set is better– The outliers are the elements of the exception set E DB for whichthe following holds:SF(E) SF(I) for all I DB Discussion:– Similar idea like classical statistical approaches (k 1 distributions)but independent from the chosen kind of distribution– Naïve solution is in O(2( n) for n data objectsj– Heuristics like random sampling or best first search are applied– Applicable to any data type (depends on the definition of SF)– Originally designed as a global method– Outputs a labelingKriegel/Kröger/Zimek: Outlier Detection Techniques (SDM 2010)29
duction Statistical Tests Depth-based Approaches Deviation-based Approaches Distance based ApproachesDistance-basedDensity-based ApproachesHigh-dimensionalHighdimensional ApproachesSummaryKriegel/Kröger/Zimek: Outlier Detection Techniques (SDM 2010)30
DATABASESYSTEMSGROUPDistance-based Approaches General Idea– Judge a point based on the distance(s) to its neighbors– Several variants proposed Basic Assumption– Normal data objects have a dense neighborhood– Outliers are far apart from their neighbors, i.e., have a less denseneighborhoodKriegel/Kröger/Zimek: Outlier Detection Techniques (SDM 2010)31
DATABASESYSTEMSGROUPDistance-based Approaches DB(ε,π)-Outliers– Basic model [Knorr and Ng 1997] Given a radius ε and a percentage π A point p is considered an outlier if at most π percent of all other pointshave a distance to p less than εOutlierSet (ε , π ) { p Card ({q DB dist ( p, q ) ε }) π}Card ( DB )range-query with radius εεp1p2Kriegel/Kröger/Zimek: Outlier Detection Techniques (SDM 2010)32
DATABASESYSTEMSGROUPDistance-based Approaches– Algorithms Index-based [Knorr and Ng 1998]– Compute distance rangeg jjoin usingg spatial index structure– Exclude point from further consideration if its ε-neighborhood contains morethan Card(DB) . π points Nested-loop based [Knorr and Ng 1998]– DivideDi id bbufferff ini twotpartst– Use second part to scan/compare all points with the points from the first part Grid-based [Knorr and Ng 1998]– Build grid such that any two points from the same grid cell have a distance ofat most ε to each other– Points need only compared with points from neighboring cellsKriegel/Kröger/Zimek: Outlier Detection Techniques (SDM 2010)33
DATABASESYSTEMSGROUPDistance-based Approaches– Deriving intensional knowledge [Knorr and Ng 1999] Relies on the DB(ε,π)-outlier model Find the minimal subset(s)( ) of attributes that explainspthe “outlierness” of apoint, i.e., in which the point is still an outlier Example– Identified outliers– Derived intensional knowledge (sketch)Kriegel/Kröger/Zimek: Outlier Detection Techniques (SDM 2010)34
DATABASESYSTEMSGROUPDistance-based Approaches Outlier scoring based on kNN distances– General models Take the kNN distance of a point as its outlier score [Ramaswamy et al 2000] Aggregate the distances of a point to all its 1NN, 2NN, , kNN as anoutlier score [Angiulli and Pizzuti 2002]– Algorithms General approaches– Nested-Loop» Naïve approach:For each object: compute kNNs with a sequential scan» Enhancement: use index structures for kNN queries– Partition-based» Partition data into micro clusters» Aggregate information for each partition (e.g. minimum boundingrectangles)» Allows to prune micro clusters that cannot qualify when searching for thekNNs of a particular pointKriegel/Kröger/Zimek: Outlier Detection Techniques (SDM 2010)35
DATABASESYSTEMSGROUPDistance-based Approaches– Sample Algorithms (computing top-n outliers) Nested-Loop [Ramaswamy et al 2000]– Simple NL algorithmgwith index support for kNN queries– Partition-based algorithm (based on a clustering algorithm that has lineartime complexity)– Algorithm for the simple kNN-distance model LinearizationLii ti [Angiulli and Pizzuti 2002]– Linearization of a multi-dimensional data set using space-fill curves– 1D representation is partitioned into micro clusters– Algorithm for the average kNNkNN-distancedistance model ORCA [Bay and Schwabacher 2003]– NL algorithm with randomization and simple pruning– Pruning:g if a ppoint has a score ggreater than the top-np outlier so far ((cut-off),)remove this point from further consideration non-outliers are pruned works good on randomized data (can be done in linear time) worst-case:tnaïveï NL algorithml ith– Algorithm for both kNN-distance models and the DB(ε,π)-outlier modelKriegel/Kröger/Zimek: Outlier Detection Techniques (SDM 2010)36
DATABASESYSTEMSGROUPDistance-based Approaches– Sample Algorithms (cont.) RBRP [Ghoting et al. 2006],– Idea: tryy to increase the cut-off as uick as possible increase the pruninggpower– Compute approximate kNNs for each point to get a better cut-off– For approximate kNN search, the data points are partitioned into microclusters and kNNs are only searched within each micro cluster– Algorithm for both kNN-distance models Further approaches– Also applypp y ppartitioning-basedgalgorithmsgusingg micro clusters [[McCallum et al2000], [Tao et al. 2006]– Approximate solution based on reference points [Pei et al. 2006]– Discussion Output can be a scoring (kNN-distance models) or a labeling (kNNdistance models and the DB(ε,π)-outlier model) Approaches are local (resolution can be adjusted by the user via ε or k)Kriegel/Kröger/Zimek: Outlier Detection Techniques (SDM 2010)37
DATABASESYSTEMSGROUPDistance-based Approaches Variant– Outlier Detection using In-degree Number [Hautamaki et al. 2004] Idea– Construct the kNN graph for a data set» Vertices: data points» Edge:g if qq kNN(p)(p) then there is a directed edgeg from p to q– A vertex that has an indegree less than equal to T (user defined threshold) isan outlier Discussion– The indegree of a vertex in the kNN graph equals to the number of reversekNNs (RkNN) of the corresponding point– The RkNNs of a point p are those data objects having p among their kNNs– Intuition of the model: outliers are» points that are among the kNNs of less than T other points» have less than T RkNNs– Outputs an outlier label– Is a local approach (depending on user defined parameter k)Kriegel/Kröger/Zimek: Outlier Detection Techniques (SDM 2010)38
DATABASESYSTEMSGROUPDistance-based Approaches Resolution-based outlier factor (ROF) [Fan et al. 2006]– Model Depending on the resolution of applied distance thresholdsthresholds, points areoutliers or within a cluster With the maximal resolution Rmax (minimal distance threshold) all pointsare outliers With the minimal resolution Rmin (maximal distance threshold) all pointsare within a cluster Change resolution from Rmax to Rmin so that at each step at least onepoint changes from being outlier to being a member of a cluster Cluster is defined similar as in DBSCAN [Ester et al 1996] as a transitiveclosure of r-neighborhoods (where r is the current resolution) ROF valueclusterSizer 1 ( p ) 1ROF ( p) clusterSizer ( p)R min r R max– Discussion Outputs a score (the ROF value) Resolution is varied automatically from local to globalKriegel/Kröger/Zimek: Outlier Detection Techniques (SDM 2010)39
duction Statistical Tests Depth-based Approaches Deviation-based Approaches Distance based Approaches Distance-basedDensity-based ApproachesHigh-dimensionalHighdimensional ApproachesSummaryKriegel/Kröger/Zimek: Outlier Detection Techniques (SDM 2010)40
DATABASESYSTEMSGROUPDensity-based Approaches General idea– Compare the density around a point with the density around its localneighbors– The relative density of a point compared to its neighbors is computedas an outlier score– Approaches also differ in how to estimate density Basic assumption– The density around a normal data object is similar to the densityaround its neighbors– The densityy around an outlier is considerablyy different to the densityyaround its neighborsKriegel/Kröger/Zimek: Outlier Detection Techniques (SDM 2010)41
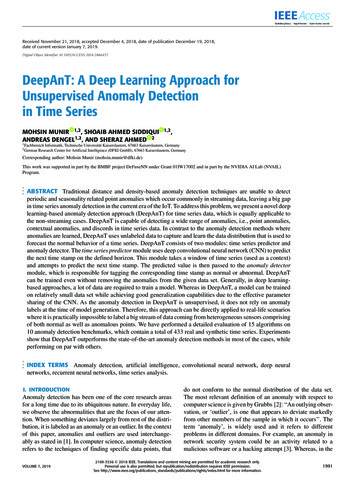
DATABASESYSTEMSGROUPDensity-based Approaches Local Outlier Factor (LOF) [Breunig et al. 1999], [Breunig et al. 2000]– Motivation: DistanceDistance-basedbased outlier detection models have problems with differentdensities How to compare the neighborhood of points from areas of differentdensities? Example– DB(ε,π)-outlier model» Parameters ε and π cannot be chosenso that o2 is an outlier but none of thepoints in cluster C1 (e.g. q) is an outlier– Outliers based on kNN-distance» kNN-distanceskNN di toff objectsbj t iin C1 (e.g.(q))are larger than the kNN-distance of o2– Solution: consider relative densityKriegel/Kröger/Zimek: Outlier Detection Techniques (SDM 2010)C1qC2o2o142
DATABASESYSTEMSGROUPDensity-based Approaches– Model Reachability distance– Introduces a smoothingg factorreach dist k ( p, o) max{k distance(o), dist ( p, o)} Local reachability distance (lrd) of point p– Inverse of the average reach-dists of the kNNs of p reach dist k ( p, o) o kNN ( p ) lrd k ( p) 1 / ()CardkNN(p) Local outlier factor (LOF) of point p– Average ratio of lrds of neighbors of p and lrd of plrd k (o) o kNN ( p ) lrd k ( p )LOFk ( p ) Card (kNN ( p ) )Kriegel/Kröger/Zimek: Outlier Detection Techniques (SDM 2010)43
DATABASESYSTEMSGROUPDensity-based Approaches– Properties LOF 1: point is in a cluster((regiongwith homogeneousgdensity around the point andits neighbors)D setData LOF 1: point is an outlierLOFs (MinPts 40)– Discussion Choice of k (MinPts in the original paper) specifies the reference setuser s Originally implements a local approach (resolution depends on the user’schoice for k) Outputs a scoring (assigns an LOF value to each point)Kriegel/Kröger/Zimek: Outlier Detection Techniques (SDM 2010)44
DATABASESYSTEMSGROUPDensity-based Approaches Variants of LOF– Mining top-n local outliers [Jin et al. 2001] Idea:– Usually, a user is only interested in the top-n outliers– Do not compute the LOF for all data objects save runtime Method– Compress data points into micro clusters using the CFs of BIRCH [Zhang et al.1996]– Derive upper and lower bounds of the reachability distances, lrd-values, andLOF-values for points within a micro clusters– Compute upper and lower bounds of LOF values for micro clusters and sortresults w.r.t. ascending lower bound– Prune micro clusters that cannot accommodate points among the top-noutliers (n highest LOF values)– Iteratively refine remaining micro clusters and prune points accordinglyKriegel/Kröger/Zimek: Outlier Detection Techniques (SDM 2010)45
DATABASESYSTEMSGROUPDensity-based Approaches Variants of LOF (cont.)– Connectivity-based outlier factor (COF) [Tang et al. 2002] Motivation– In regions of low density, it may be hard to detect outliers– Choose a low value for k is often not appropriate Solution– Treat “low density” and “isolation” differently ExampleData setLOFKriegel/Kröger/Zimek: Outlier Detection Techniques (SDM 2010)COF46
DATABASESYSTEMSGROUPDensity-based Approaches Influenced Outlierness (INFLO) [Jin et al. 2006]– Motivation If clusters of different densities are not clearly separatedseparated, LOF will haveproblemsPoint p will have a higher LOF thanpoints q or r which is counter intuitive– Idea TTakek symmetrict i neighborhoodi hb h d relationshipl tihi iintot accountt Influence space (kIS(p)) of a point p includes its kNNs (kNN(p)) and itsreverse kNNs (RkNN(p))kIS(p) kNN(p) RkNN(p)) {q1, q2, q4}Kriegel/Kröger/Zimek: Outlier Detection Techniques (SDM 2010)47
DATABASESYSTEMSGROUPDensity-based Approaches– Model Density is simply measured by the inverse of the kNN distance, i.e.,den(p)(p) 1/k-distance(p)(p) Influenced outlierness of a point p den (o )INFLOk ( p) o kIS ( p )Card ( kIS ( p ))den( p ) INFLO takes the ratio of the average density of objects in theneighborhood of a point p (i.e., in kNN(p) RkNN(p)) to p’s density– Proposed algorithms for mining top-ntop n outliers Index-based Two-way approach Micro cluster based approachKriegel/Kröger/Zimek: Outlier Detection Techniques (SDM 2010)48
DATABASESYSTEMSGROUPDensity-based Approaches– Properties Similar to LOF INFLO 1: ppoint is in a cluster INFLO 1: point is an outlier– Discussion Outputs an outlier score Originally proposed as a local approach (resolution of the reference setkIS can be adjusted by the user setting parameter k)Kriegel/Kröger/Zimek: Outlier Detection Techniques (SDM 2010)49
DATABASESYSTEMSGROUPDensity-based Approaches Local outlier correlation integral (LOCI) [Papadimitriou et al. 2003]– Idea is similar to LOF and variants– Differences to LOF Take the ε-neighborhood instead of kNNs as reference set Test multiple resolutions (here called “granularities”) of the reference setto get rid of any input parameter– Model ε-neighborhood of a point p: N(p,ε) {q dist(p,q) ε} LocalLlddensityit off an objectbj t p: numberb off objectsbj t iin N(N(p,ε)) Average density of the neighborhoodd ( p, ε , α ) den( N (q, α ε )) Cardεq N ( p , )q Card ( N ( p, ε )) Multi-granularity Deviation Factor (MDEF)MDEF ( p, ε , α ) den( p, ε , α ) Card ( N ( p, α ε ))Card ( N ( p, α ε )) 1 den( p, ε , α )den( p, ε , α )Kriegel/Kröger/Zimek: Outlier Detection Techniques (SDM 2010)50
DATABASESYSTEMSGROUPDensity-based ApproachesN(p1, α . ε)– IntuitionN(p,ε)N(p,α . ε)N(p2, α . ε)den( p, ε , α ) N(p3, α . ε)MDEF( p, ε ,α) Card ( N (q,α ε ))q N ( p ,ε )Card ( N ( p, ε ))den( p, ε ,α) Card(N( p,α ε ))Card(N( p,α ε )) 1 den( p, ε ,α)den( p, ε ,α)– σMDEF(p,ε,α) is the normalized standard deviation of the densities ofall points from N(p,ε)– Properties MDEF 0 for points within a cluster MDEF 0 for outliersor MDEF 3.σMDEF outlierKriegel/Kröger/Zimek: Outlier Detection Techniques (SDM 2010)51
DATABASESYSTEMSGROUPDensity-based Approaches– Features Parameters ε and α are automatically determined In fact,, all possiblepvalues for ε are tested LOCI plot displays for a given point p the following values w.r.t. ε– Card(N(p, α.ε))– den(p, ε, α)with a border of 3.σden(p, ε, α)εKriegel/Kröger/Zimek: Outlier Detection
outliers basic model assumes that outliers are rare observations Conseqqpuence: a lot of models and appproaches have evolved in the past years in order to exceed these assumptions and it is not easy to keep track with this evolution. N dlft i ltil th h ll