Transcription
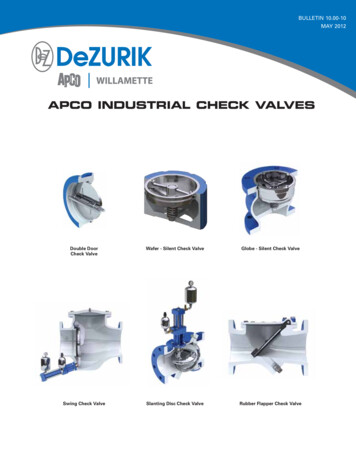
A Quick Check Method For The Design Of PneumaticConveying Systemsby Dr David Mills,Pneumatic Conveying Consultant, Old Wives Lees, EnglandINTRODUCTIONThe design of pneumatic conveying systems is usually carried out on the basis of scaling data obtained from the pneumatic conveying of the material to be transported. If previous experience of conveying a given material is not available, data is generally derived for the purpose by conveyingthe material through a test facility. Most manufacturers ofpneumatic conveying systems have such test facilities forthis purpose.If it is required to make a quick check on the potential of anexisting system, or to provide a check on design proposals,there is little information readily available for the engineerto use. Pneumatic conveying does not lend itself to simplemathematical analysis, and it is likely that many engineerswould not be able to undertake such a task easily, particularly if it were a low velocity dense phase system.Since pneumatic conveying systems tend to have highpower ratings, particularly for conveying in dilute phasesuspension flow, it is useful to be able to obtain a rough estimate of air requirements at the feasibility stage of a project.Most of the operating cost of a pneumatic conveying systemis in the drive for the air mover. If an estimate can be madeof the system air requirements, it is a simple matter to evaluate the operating cost in cents per ton conveyed to see if itis at an acceptable level before proceeding further.In this paper a straightforward method is presented whichwill allow a check to be made on the design of a pneumatic conveying system in a very short space of time, whetherfor a new or an existing system. Horizontal and verticalsections of pipeline and bends are all accommodated, aswell as dilute and dense phase conveying. For high-pressure systems the influence of stepped pipelines can also beincorporated.The Design ProcessThe pressure required to convey a material through apipeline can be divided into a number of component parts.The most important are the straight pipeline sections andthe bends. For each of these elements there are a multitudeof sub variables that can have an influence, but their incorporation necessarily adds to the complication of the process.A compromise is clearly needed in order to provide a QuickCheck Method.Straight PipelineA considerable amount of published data exists on the pneumatic conveying of materials through pipelines. Much of itwas generated by the author when commissioned by theDepartment of Industry in the UK to write a Design Guidefor Pneumatic Conveying (Ref 1). Typical data for the horizontal conveying of material through straight pipeline ispresented in Figure 1.Figure 1 is a graph of material flow rate plotted against airflow rate, which is the usual form for presenting conveyingcharacteristics for materials. In this case the family ofcurves that are drawn are lines of constant pressure gradientin lbf/sq. in. per 100 ft of pipeline. The data was initiallyderived from conveying trials with barytes and cement (Ref1), but has since been found to be reasonably close to thatfor many other materials.Lines of constant solids loading ratio can be drawn quiteeasily on this plot as they are simply straight lines throughthe origin. Solids loading ratio is the dimensionless ratio ofthe mass flow rate of the material conveyed to the mass flowrate of the air used. For powdered and granular materialsvalues below about 15 generally relate to high velocitydilute phase conveying, and values above about 50 indicatethat a material is capable of being conveyed at low velocityin dense phase.The data in Figure 1 represents the pressure gradient forconveying material through straight horizontal pipeline of 2inch bore. As will be seen, it covers both dilute and densephase, with a smooth transition between the two. This QuickCheck Method is based on the use of this data and so it willbe seen that there is no specific reference to material type. Itmust be recognized, therefore, that this is strictly a firstapproximate method only.November 2001 Powder/Bulk Solids 7
A DVANCESIND RY P ROCESSING 2002Material Flow Rate -lb/h x 1000240 200 160SolidsLoadingRatio601716 15 14 ssureGradientlbf/in2per 100 ft.4087 40306 305204 2032 10101004080120160 3Free Air Flow Rate - ft /min - VO200Figure 1: Pressure Gradient Data for Horizontal Conveying in 2 inch Bore PipelineTo the pressure drop for conveying the material must beadded the pressure drop for the air, and this will be considered later, as will the relationships between volumetric andmass flow rates for air. The effect of pipeline bore must alsobe considered, and this, of course, is also related to air flowrate. Straight vertical pipeline sections are another elementthat need to be taken into account, but these can conveniently be incorporated with Figure 1, as will be seen.Pipeline bends are a completely separate issue and will bedealt with later.Vertical PipelinesFor flow vertically up, the author has found that the pressuregradient is approximately double that for horizontal conveying, and that this applies over an extremely wide rangeof solids loading ratios (Ref 1). To take account of vertically up sections of pipeline, therefore, the pressure gradientvalues on Figure 1 simply need to be doubled for any operating point on the chart.For flows in vertically down sections of pipeline the situation is very different. In dense phase flows there is a pressure recovery, such that the pressure gradient has a negativevalue. For dilute phase flows, however, there is a pressureloss. The transition between the two occurs at a solids loading ratio of about 35 and at this value materials can be conveyed vertically down with no pressure drop at all (Ref 1).Figure 1, therefore, cannot be used in this case.If, in a long pipeline, there is only a short length of vertically down pipeline, it is suggested that it can be ignored, interms of the overall accuracy of the method. If a conveying8Powder/Bulk Solids November 2001system does have a significant proportion of pipeline that isvertically down, the user is referred to Reference 1.Pipeline BoreMaterial flow rate varies approximately in proportion topipe section area, and hence in terms of (diameter)2. Airflowrate, to maintain the same velocity in a pipeline of differentbore, varies in exactly the same way. To determine the pressure gradient for flow in a pipeline having a bore differentfrom that of the reference data in Figure 1, both the material and air flow rates should be adjusted in proportion to(d2/2)2, where d2 is the diameter of the plant pipeline ininches. It will be noted, therefore, that there will be nochange in the value of the solids loading ratio.It must be appreciated that along the length of a pipeline, asthe pressure drops and the conveying air velocity increases,the pressure gradient is likely to increase. In Figure 1 a singlevalue is given for the entire pipeline. This value can be takento be an average for the pipeline, but it is another feature thatreinforces the point that this is only an approximate method.Stepped PipelinesWhen high pressure air is employed it is usual to increasethe bore of the pipeline to a larger diameter along the lengthof the pipeline (Ref 1). By this means the very high velocities that will result towards the end of a single bore pipeline,from the expansion of the air, can be prevented. By thismeans it is often possible to gain a significant increase inperformance of the pipeline.The pressure drop in a stepped pipeline can be evaluated
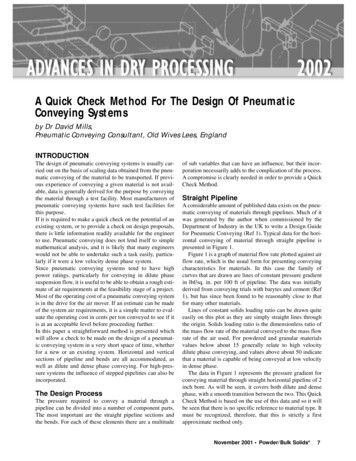
A DVANCESwww.powderbulksolids.comIND RY P ROCESSING 2002in exactly the same way as outlined above. A critical pointin stepped bore pipelines is the location of the steps alongthe length of the pipeline. At each step in the pipeline theconveying air velocity must not be allowed to fall below agiven minimum value. The solution, therefore, will be aniterative one since the velocity of the air at the step dependsupon the pressure at the step.for all bends, since 90 bends are likely to be in the majorityin any pipeline. In the absence of any reliable data on theinfluence of pipeline bore it is suggested that the data inFigure 2 is used for all bends, regardless of pipeline bore. Forlarger bore pipelines the material and air flow rates will haveto be scaled in the same way as outlined for the straightpipeline in Figure 1.Pipeline BendsAir Only Pressure DropPressure drop data for bends in pipelines is presented inFigure 2. This is an identical plot to that in Figure 1 and covers exactly the same range of conveying conditions. Thepressure drop in this case is for an individual bend in thepipeline and hence is in lbf/in2 per bend.As mentioned earlier, the data in Figure 1 relates only to theconveying of the material through the pipeline, and so thepressure drop required for the air alone must be added. InFigure 3 the influence of pipeline bore on this pressure dropfor a 500-ft. long pipeline is presented to illustrate theMaterial Flow Rate -lb/h x 1000240 200 3-20-8503Pressuredroplbf/in240403030202 2010101004080120160 3Free Air Flow Rate - ft /min - VO200Figure 2: Pressure Drop Data for 90 Radiused Bends in 2-inch Bore PipelineThe data given in Figure 2 relates to 90 radiused bends ina 2-inch bore pipeline. This is also data that was derived fromconveying trials with barytes and cement (Ref 1), which hassince been found to be reasonably close to that for other materials. From an extensive program of conveying trials withbends of different bend diameter, D, to pipe bore, d, ratios itwas found that pressure drop varied little over a range ofD/d ratios from about 5 to 30 (Ref 1). It has been found thatthe pressure drop in very sharp bends, and particularly blindtee bends, however, is significantly higher (Ref 1) and so anappropriate allowance should be made if any such bend hasto be used, or is found to be fitted into a pipeline.Little data exists for bends other than those having an angleof 90 and so it is suggested that the data in Figure 2 is usedpotential influence of the variables.Figure 3 shows the influence of air flow rate and pipelinebore on conveying line pressure drop for a representativepipeline length of 500 ft. It will be seen that conveying lineexit air velocity has been added to the horizontal axis forreference. Conveying line inlet air velocity is the criticaldesign parameter, but this cannot be added convenientlybecause it is also a function of the conveying line inlet airpressure. Because a range of pipeline bores are representedon this plot the air flow rate is in terms of that for the reference 2-inch bore pipeline (d2/2)2From Figure 3 it will be seen that the air only pressuredrop can be quite significant for long small bore pipelines.As there are many variables in this pressure drop relation-November 2001 Powder/Bulk Solids 9
A DVANCESIND RY P ROCESSING 2002www.powderbulksolids.comPressure Drop-lb f/in2102Pipelinebore-inch83Pipeline Length 500 ft.6464820Conveying Line Exit Air 2080009000160200Free Air Flow Rate - ft3/min x (d2/2)2Figure 3: Influence of Pipeline Bore and Air Flow Rate on the Empty Pipeline Pressure Dropship it is probably best to evaluate the pressure drop mathematically on an individual basis. Darcy’s Equation can conveniently be used for this purpose: For most cases a friction coefficient, f, can be taken as0 005. Mean values of both air density and velocity shouldbe used, but for quickness, since these two parameters will Pressure Drop-lb f/in21086500Pipeline Bore 4 in410020Conveying Line Exit Air 000500 Free Air Flow Rate - ft3/min - VO101000Pipelinelength - ftPowder/Bulk Solids November 2001700060080007009000800
A DVANCESwww.powderbulksolids.cominitially be unknown, conveying line exit values can betaken. For air at standard atmospheric pressure 0 0765 lb/ft3 and the velocity can either be obtainedfrom Figure 3 or be calculated.Another graph, plotted for a 4-inch bore pipeline, is presented in Figure 4 to further illustrate the influence ofpipeline length.IND RY P ROCESSING 2002where subscripts 1 and 2 can relate to any twopoints anywhere along the conveying pipeline.Or to relate a chosen point with free air or reference conditions:Air Flow RateThe air flow rate to be specified for a blower or compressoris generally expressed in volumetric terms and specificallyin terms of ‘free air conditions.’ Air is compressible withrespect to both pressure and temperature, and this is why ithas not been possible to represent conveying line inlet airvelocities on Figures 3 and 4.Conveying Air VelocityConveying air velocity, C, is derived by dividing the volumetric flow rate,, by the pipe section area:where:subscript o refers to reference conditions:usually po 14 7 lbf/in2 absoluteTo 519 R toF 460and o free air delivered in ft3/minand subscript 1 refers to actual conditions anywhere alongthe pipeline, but usually conveying line inlet (material feed or pick-up point).Pick-Up VelocityThe velocity at the pipeline inlet, C1, or pick-up velocity canbe determined by combining Equations 2 and 6 to give:Ideal Gas LawTo take account of compressibility on volumetric flow rate,and hence conveying air velocity, Equation 2 is used in conjunction with the Ideal Gas Law: and T absolute air temperature-RSince botha maand R will be constant, the usual workingform of this equation is: This is then used either to equate points along a pipeline:November 2001 Powder/Bulk Solids 11
A DVANCESIND RY P ROCESSING 2002www.powderbulksolids.comMaterial ClassificationMaterial CapabilityIt must be emphasised that the potential for dense phaseconveying of materials is strictly limited. Although thedesign method will cater for material
Department of Industry in the UK to write a Design Guide for Pneumatic Conveying (Ref 1). Typical data for the hori-zontal conveying of material through straight pipeline is presented in Figure 1. Figure 1 is a graph of material flow rate plotted against air flow rate, which is the usual form for presenting conveying characteristics for materials. In this case the family of