Transcription
2418JOURNAL OF CLIMATEVOLUME 23Probing the Fast and Slow Components of Global Warming by ReturningAbruptly to Preindustrial ForcingISAAC M. HELD AND MICHAEL WINTONNOAA/Geophysical Fluid Dynamics Laboratory, Princeton, New JerseyKEN TAKAHASHIInstituto Geofisico del Peru, Lima, PeruTHOMAS DELWORTH AND FANRONG ZENGNOAA/Geophysical Fluid Dynamics Laboratory, Princeton, New JerseyGEOFFREY K. VALLISAtmospheric and Oceanic Sciences Program, Princeton University, Princeton, New Jersey(Manuscript received 6 October 2009, in final form 17 December 2009)ABSTRACTThe fast and slow components of global warming in a comprehensive climate model are isolated by examining the response to an instantaneous return to preindustrial forcing. The response is characterized by aninitial fast exponential decay with an e-folding time smaller than 5 yr, leaving behind a remnant that evolvesmore slowly. The slow component is estimated to be small at present, as measured by the global mean nearsurface air temperature, and, in the model examined, grows to 0.48C by 2100 in the A1B scenario from theSpecial Report on Emissions Scenarios (SRES), and then to 1.48C by 2300 if one holds radiative forcing fixedafter 2100. The dominance of the fast component at present is supported by examining the response to aninstantaneous doubling of CO2 and by the excellent fit to the model’s ensemble mean twentieth-centuryevolution with a simple one-box model with no long times scales.1. IntroductionIt is informative to take a simulation of the future climate and, at several times along this trajectory, abruptlyreturn to preindustrial forcing. Matthews and Caldeira(2007) describe calculations of this type using a climatemodel of intermediate complexity, motivated by geoengineering proposals. Similar calculations with comprehensive climate models have the potential to increaseour understanding of the variety of time scales involvedin the climate response.In this work, we describe such calculations for a particular model, the Geophysical Fluid Dynamics Laboratory’s (GFDL’s) Climate Model version 2.1 (CM2.1).Corresponding author address: Isaac M. Held, P.O. Box 308,NOAA/Geophysical Fluid Dynamics Laboratory, Princeton, NJ08542.E-mail: isaac.held@noaa.govDOI: 10.1175/2009JCLI3466.1The qualitative behavior resulting from the return topreindustrial radiative forcing is that of a fast cooling,with ,5-yr relaxation time, leaving behind a much moreslowly evolving component that we also refer to as ‘‘recalcitrant’’ because it is difficult to remove from the system by manipulating the radiative forcing. The magnitudeof this remaining slow, or recalcitrant, component growsas one moves the time of the return to preindustrialforcing to a later date.The presumption here is that the climate exhibits nolarge hysteresis effects, allowing for a relatively simple description of the time scales involved in the returnto preindustrial conditions. The analyzed model has neither dynamic glaciers nor dynamic vegetation, which aretwo potential sources of hysteresis. We also do not consider the carbon cycle here, which has its own fast andslow components, but instead focus exclusively on thephysical climate system’s response to changing radiative forcing.
1 MAY 20102419HELD ET AL.The fast responses we consider here have time scalesof a few years. There are even faster responses on atmospheric relaxation times of a few months or less, withthe stratospheric adjustment to CO2 being the classicexample. One can define these ultrafast responses asthose that occur with a fixed ocean temperature. Gregoryand Webb (2008) have emphasized the significance of ultrafast responses in the troposphere as well as the stratosphere. We treat all ultrafast responses, both stratosphericand tropospheric, as modifications to the radiative forcing,following Hansen et al. (2005).After introducing an energy balance model with twotime scales in section 2 to help frame the discussion, wethen turn to the coupled atmosphere–ocean GCM andfirst examine, in section 3, the response to the instantaneous doubling of CO2, which is an experiment described, in particular, by Hasselmann et al. (1993) andHansen et al. (2005). This computation serves to illustrate the sharpness of the separation of slow and fasttime scales in the specific climate model that we analyze.Also in section 3, we show that one can understand thismodel’s twentieth-century global mean warming withconsiderable accuracy with no back effect of the slowcomponent of the response onto the surface temperature,even though heat uptake by the ocean is clearly importantin setting the magnitude of the warming. This picture isconsistent with the discussion in a number of studies,including Allen et al. (2000), Stott and Kettleborough(2002), Kettleborough et al. (2007), and Gregory andForster (2008). The implication is that the slow component of the warming has not yet grown to an amplitudethat is sufficient to alter global mean surface temperature significantly. In section 4, we describe the experiments in which all forcing agents are abruptly returnedto preindustrial values. These confirm the current smallness of the slow component in this model, and illustratehow this slow component grows in time.2. A simple model with two time scalesWe consider a very simple model with fast and slow timescales to help fix ideas and terminology. For simplicity, weuse a two-box model (Gregory 2000) rather than the morecommon box-plus-diffusion model for incorporating heatexchange between shallow and deeper ocean layers:cFcDdT5 bT H 1 F ,dtdT D5 H.dt(1)(2)Here, T as the global mean surface temperature perturbation, b the derivative of the outgoing flux to spacewith respect to T, and cF the heat capacity of the oceanlayers that respond rapidly to the atmosphere, which onecan think of as the waters reached by the surface mixedlayer in its seasonal cycle. The heat exchange with themore slowly evolving ocean depths is denoted by H. Thesedeeper layers are characterized by a heat capacity cD cF and a temperature TD. The forcing is denoted by F .We assume that the heat exchange is proportional to thedifference between the two temperatures:H [ g(T T D ).(3)When TD is small, this expression is consistent withRaper et al. (2002). In the unperturbed state T 5 TD 5 0,and the equilibrium response is T 5 T D 5 F /b.As long as F only varies on time scales that are longerthan the fast relaxation time t F [ cF/(b 1 g), we canignore the term involving cF in (1) and setT’F 1 gT D.b1g(4)Substituting into the evolution equation for the slowcomponent then givescDdT DbggT 1F,’ b1g D b1gdt(5)so that TD relaxes to the equilibrium response F /b onthe slow time scaletS [cD b 1 g.b g(6)This time scale increases as the strength of the couplingbetween the fast and slow components g decreases.For early enough times for which the slow componenthas not yet responded significantly, the climate can bethought of as responding to the instantaneous forcing,with a transient sensitivity replacing the equilibrium sensitivity asT ’ TF [F,b1g(7)where the subscript F refers both to fact that this response is fast and that it is directly proportional to theforcing F . The importance of this regime for our understanding of the twentieth-century warming has beenemphasized by Gregory and Forster (2008). At times forwhich (7) is a good approximation, the committed warming, defined as the difference between the equilibriumresponse, holding F fixed, and the realized warming, isg/b times the realized warming.
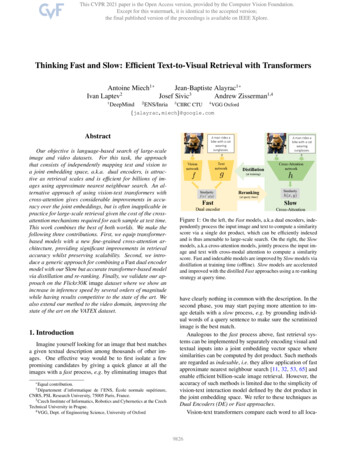
2420JOURNAL OF CLIMATEReferring to (1) and (3), if one returns F to zerorapidly, then T returns quickly to the value TR, the recalcitrant warming, which is the surface manifestation ofthe slow warming of the ocean depths, given byTR 5gT .b1g D(8)If the forcing is evolving slowly, (4) implies that thetemperature T at any time is the sum of TF and TR asdefined by (7) and (8). Therefore, the growth of TR isa measure of the extent to which the warming wouldbe underestimated by assuming a self-similar evolutionwith a constant (transient) climate sensitivity. Once equilibrium is reached, the ratio of the recalcitrant to the fastresponse TR/TF is g/b.An important limitation of this model of the fast response is discussed by Williams et al. (2008) and Wintonet al. (2010). As the climate evolves toward equilibrium,the spatial pattern of the warming evolves, so that therelationship between global mean surface temperatureand outgoing flux to space changes. Because this evolvingspatial pattern can be related to the oceanic heat uptake,Winton et al. argue that a natural way of retaining theglobal mean perspective is by introducing an efficacyfactor for H in (1),1cFcDdT5 bT H 1 F ,dtdT D5 H.dt(9)(10)Winton et al. find that the efficacy of the heat uptake,evaluated at the time of doubling in 1% yr21 CO2 increase experiments, is greater than unity in almost allmodels, with a median value near 1.3, reaching values aslarger as 2. For our purposes, as long as we focus on theresponse for given TD we can replace g with g. Inparticular, the transient response for early times forwhich TD ’ 0 becomesT ’ TF [F.b 1 g(11)1The underlying physical assumption is more apparent if onerearranges the first of these equations to read cF dT/dt 5 bT ( 1)g(T T D ) H 1 F , with the sum of the first two terms onthe RHS now thought of as the parameterization of perturbationsto the radiative flux at the top of the atmosphere. As the systemapproaches equilibrium, with T / TD, the sensitivity of the flux tothe global mean surface temperature approaches b, but in theinitial stages of the response, with TD ’ 0, the different spatialstructure of the response results in a larger flux response for a givenchange in global mean temperature, as measured by the extent towhich . 1.VOLUME 233. GCM response to an instantaneous increase inforcing and to twentieth-century forcingWe have generated four realizations of the experimentin which the CO2 concentration in the atmosphere isdoubled instantaneously using GFDL CM2.1 (Delworthet al. 2006). Each experiment covers 100 yr. The evolutionof global mean surface air temperature is shown in the leftpanel of Fig. 1. The model warms rapidly, but then thewarming plateaus until year 70, after which time it recommences to grow slowly. The plateau occurs at a valueof about 1.5 K. This is the same value obtained in thismodel at the time of doubling in the standard experimentin which CO2 is increased 1% yr21 (Stouffer et al. 2006).The model’s equilibrium climate sensitivity for doubling,as estimated from slab-ocean simulations, is roughly3.4 K. Consistent results for the equilibrium response areobtained by extrapolation from experiments in which adoubling or quadrupling of CO2 is maintained for hundreds of years. Thus, the system is clearly still far fromequilibrium when it plateaus, and Fig. 1 shows only theinitial steps of the transition to the equilibrium response.The right-hand panel in Fig. 1 focuses on the evolutionover the first 20 yr, showing the model’s relaxation toa global mean response consistent with its transient climate sensitivity. Exponential evolution with relaxationtimes of 3 and 5 yr, asymptoting to the transient climatesensitivity of 1.5 K, are also shown. A time scale of 4 yrfits the model’s relaxation reasonably well. In thinkingof the smallness of this fast time constant, it is importantto keep in mind both the effect of heat exchange withthe deep-ocean layers, which replace t F 5 cF /b withcF /(b 1 g) in the simple model of section 2, and the effectof the efficacy of heat uptake that is larger than unity,which reduces this time scale further to cF/(b 1 g). Ourfocus here is not on the precise value of this time constant, but rather on its clear separation from the longertime scales in the model. A similar response to the instantaneous increase in CO2, with a very sharp distinction between fast and slow components of the response,is evident in the model of intermediate complexity described in Knutti et al. (2008).The flatness of the plateau in this response is of interest,because it differs from the gradual emergence of the slowresponse expected from either a two-box or a box diffusion model. One tentative interpretation is suggested bya preliminary analysis indicating that a weakening of theAtlantic meridional overturning occurs during this plateau phase, restraining the warming in particular by enhancing Northern Hemisphere sea ice cover. The modeldescribed by Hasselmann et al. (1993) has a hint of thesame plateau structure, but this is less evident in Hansenet al. (2005). Further realizations are needed to determine
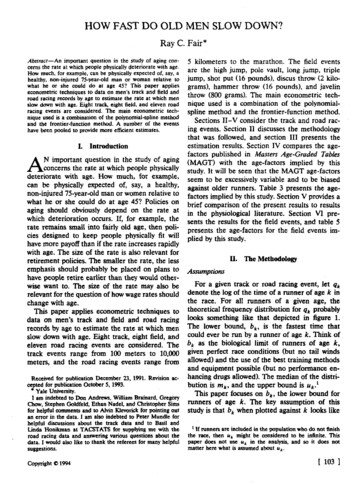
1 MAY 20102421HELD ET AL.FIG. 1. (left) Four realizations of global mean near-surface air temperature in 100-yr simulations of CM2.1 inresponse to instantaneous doubling of CO2; (right) the first 20 yr of the response, compared to exponential relaxationto the value of 1.5 K with time scales of 3 and 5 yr.the robustness of this feature. Indeed, the inspection ofthe individual realizations shows that only three out offour display a clear plateau in their response. We deferfurther analysis of this feature and associated oceanicdynamics to future work.We now check whether the simplest one-box modelwith TD 5 0 provides a good fit to the twentieth-centuryevolution produced by CM2.1. To determine this, we firstneed to estimate the forcing F (t). For this purpose, following Hansen et al. (2005), we examine simulations of theatmosphere–land component of the model over prescribedsea surface temperatures (SSTs) and sea ice distributions,both with and without the perturbations to the model thatproduce the radiative forcing over the past century (wellmixed greenhouse gases, ozone, solar irradiance, anthropogenic and volcanic aerosols, and land use changes). Thistechnique allows the ultrafast tropospheric responses discussed by Gregory and Webb (2008), along with the traditional ultrafast stratospheric adjustment, to modify F .We take advantage of the existence of a 10-memberensemble of such simulations, using the time-evolvingprescribed boundary conditions from the 1870–2000period, and using the identical forcing agents as in theCM2.1 simulations provided to the phase 3 of the CoupledModel Intercomparison Project (CMIP3) archive utilizedby the Intergovernmental Panel on Climate Change(IPCC) Fourth Assessment Report. (A 10-member ensemble is overkill for this purpose, because ocean temperatures are prescribed, limiting the internal variabilityin the model.) Differencing the ensemble mean fluxesat the top of the atmosphere both with and withoutperturbations in the forcing agents, the result for the netincoming flux is displayed in Fig. 2. In addition to thevolcanic signals that are evident in this time series, thereis a gradual increase over time that is dominated by theeffects of greenhouse gases, with some compensation resulting from aerosol forcing. We also compute the analogous forcing resulting from doubling CO2 in isolation byperturbing a fixed SST–sea ice model and obtaining F2X 53.48 W m22 for the net flux at the top of the atmospherein this model after the ultrafast responses have taken place.We set F (t) equal to the net flux, and solvecFdT 1F5 bTdt(12) 5 F /1.5 K; from the perspective of the boxwith b2Xmodel with the efficacy correction, we can think of 5 4 yr. In the left panel of 5 b 1 g. We also set c /bbFFig. 3, we compare the resulting evolution of T with theglobal mean surface temperature obtained from the fullGCM. For this purpose, we average over five realizationsof the full model.22For consistency with our fixed SST–sea ice forcing computation, before generating this figure we compute the difference in theglobal mean surface temperatures obtained from the prescribedSST simulations both with and without changes in the radiativeforcing agents, and subtract this small change from the coupledmodel’s response. These fixed SST global mean responses, resulting from the ultrafast land warming that manages to occur despitethe fixed SSTs and sea ice, amount to less than 0.1 K in CM2.1, sothat the basic result in the figure is not affected by this detail, butthe agreement is improved marginally.
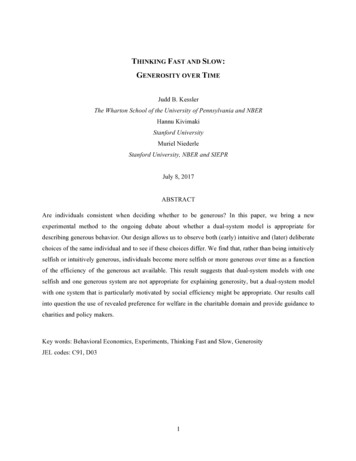
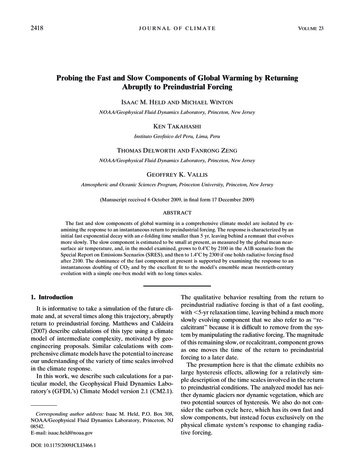
2422JOURNAL OF CLIMATEFIG. 2. The net forcing at the top of the atmosphere resultingfrom all forcing agents in CM2.1 computed as described in the text.The annual mean forcing is shown for each year.It is evident that this simple box model provides animpressive fit to the global mean temperature evolutionof the GCM. The right panel in Fig. 3 is identical to theleft panel, except that we simply plot the instantaneous Theresponse to the annual mean forcing T 5 F /b.agreement is maintained, except for the exaggeratedresponses to the volcanic forcing. The net response overthe twentieth century increases slightly. On annual timescales, the evolution of the warming over the twentiethcentury is well approximated by the evolution of theforcing and effective transient climate sensitivity, exceptfor the volcanic responses for which one needs to includea memory of a few years to smooth the response. ThisVOLUME 23picture is consistent with that advocated by Gregory andForster (2008). The long time scales play little role because there is a gap between the fast and slow time scalesof the response in this model, with the twentieth-centurywarming mostly falling within this gap, more or less as inthe derivation of (4) for the simple two-box model.To avoid misinterpretations, we emphasize the importance of using the transient rather than equilibriumsensitivity in this calculation. There is substantial heatbeing taken up by the oceans, but the results are consistent with the assumption that this uptake is proportionalto the warming itself, resulting in a replacement of theequilibrium with the transient sensitivity. In addition, despite the resulting warming of the deeper oceanic layers(and the associated sea level rise resulting from thermalexpansion in the GCM), the global mean surface temperatures are substantially unaffected by this warming.We prefer the concept ‘‘transient climate sensitivity’’(‘‘TCS’’) to the more commonly used ‘‘transient climateresponse’’ (‘‘TCR’’), which is the response at the time ofdoubling in the standard 1% yr21 increase in CO2. Thetwo expressions are simply related by the radiativeforcing resulting from CO2 doubling: TCS 5 TCR/F2X,but the key point is that TCS is also relevant for manyother forcings as long as the focus is on time scales residing in the gap between the fast and slow responses. Inparticular, these intermediate time scales are evidentlydirectly relevant for nearly all of the twentieth-centuryresponses to anthropogenic forcing.We do not argue that there is no effect at all of thedeep-ocean warming on surface temperatures on thesetime scales. For example, a closer examination of thespatial pattern of the response to the instantaneousFIG. 3. (left) Fit to global mean warming of surface air temperature in CM2.1 over the 1870–2000 time period usinga one-box model with an effective transient climate sensitivity and a relaxation time scale of 4 yr. The GCM result isan average over a five-member ensemble; (right) the analogous fit assuming instead an instantaneous response to theannual mean forcing, obtained by dividing the forcing by the transient climate sensitivity.
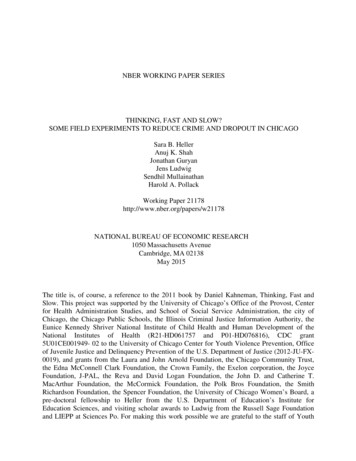
1 MAY 2010HELD ET AL.2423doubling of CO2 uncovers changes over the 100-yr timeframe in Fig. 1, especially in the tropics. But these variations in spatial structure do not have a substantial effect on the global mean temperature.It may be that the separation in the time scales is lessclear in other comprehensive models, necessitating consideration of a more complex frequency-dependent response to explain the models’ behavior over the twentiethcentury. It is also likely that models with more substantialaerosol forcing would at least require consideration ofthe efficacy of the aerosol forcing in order to obtain a fitof this quality to the global mean evolution.4. The recalcitrant componentWe now describe the response of CM2.1 to the instantaneous return to preindustrial forcing. We first construct a simulation of the period 1860–2300 by appendinga simulation of the A1B scenario of the Special Reporton Emissions Scenarios (SRES) for the twenty-first century to one of the simulations of the 1860–2000 periodwith estimated historical forcings. In this scenario, CO2increases to 720 ppm by 2100. We extend this integrationto 2300, holding all forcing agents fixed from 2100 to 2300.We then perform four additional 100-yr experiments,initialized from this 1860–2300 simulation, in which theforcing agents are instantaneously returned to their1860 values in the years 2000, 2100, 2200, and 2300. Theresult is shown in Fig. 4.As a rough estimate of the magnitude of the slow, orrecalcitrant, warming, we average temperatures over years10–30 following the switch off of the forcing. The thinblack line in Fig. 4 connects these points. These estimatesconfirm that the recalcitrant component is still small atpresent, roughly 0.1 K according to this GCM. In 2100 itis roughly 0.4 K, and grows to 1.4 K by 2300. At equilibrium, the total response is expected to be a combination of fast and recalcitrant components, with the ratioTR/TF 5 g/b in the simple model of section 2, where gwould be replaced by g in a model taking into accountthe efficacy of heat uptake. We estimate this ratio to beroughly unity in CM2.1, but somewhat smaller than unityin most models, based on comparisons of transient andequilibrium warmings.The evolution after the instantaneous return to preindustrial forcing in years 2000 and 2100 suggeststhe possibility of some modest overshooting and nonmonotonic behavior, perhaps indicating that the slowwarming has some momentum, which would require atleast two effective degrees of freedom within the slowcomponent. (We have removed an estimate of a smalldrift in the control simulation from these global meantemperatures, but this behavior does not appear to beFIG. 4. The global mean surface air temperature in CM2.1 simulations with historical forcing (black), with A1B forcing, stabilizedin 2100 and extended for 200 additional years with fixed forcingagents (blue), and four experiments in which the forcing agents arereturned to their 1860 values instantaneously in years 2000, 2100,2200, and 2300 (red). An estimate of the recalcitrant component ofthe response (thick black line) obtained by averaging over years10–30 after the switch-off.sensitive to the method used to remove this drift.) Additional realizations would be required to make a casefor more complex time dependence. There is also a suggestion that the interannual variability of global meantemperature, dominated by ENSO, increases once thefast response is peeled away and the recalcitrant component is made visible. The evolution of ENSO in thesereturn-to-preindustrial simulations may repay a closerexamination, which we do not attempt here.In Fig. 5, we plot the evolution over the first 20 yr ofthe three switch-off experiments starting in 2100, 2200,and 2300. We subtract from each time series the globalmean recalcitrant warming as estimated in Fig. 4. Theresponses are all of the same magnitude, as expected forthe fast response (7), because the forcing is held fixedfrom 2100 to 2300. The implication is that the growth ofthe total response during this period is due to the growthof the recalcitrant component. The reduction in forcing that leads to this fast response is the sum of thepreindustrial-to-2000 forcing, roughly 2 W m22 fromFig. 2, and the 2000–2100 forcing in the A1B scenario,estimated to be 4.5 W m22 for this model (Table 1 in Levyet al. 2008), for a total of about 6.5 W m22. Using thesame value of effective sensitivity, 1.5 K/(3.5 W m22),used to generate the fit in Fig. 3, we expect a fast coolingof 2.8 K, which is roughly consistent with the 2.6–2.7-Krange seen in these three cases.The results are compared once again to exponentialdecays with time scales of 3 and 5 yr in Fig. 5. In this
2424JOURNAL OF CLIMATEFIG. 5. The initial cooling after instantaneous return of all radiative forcing agents to their values in 1860, with the magnitude ofthe recalcitrant response subtracted. The three cases switched offin years 2100, 2200, and 230, are nearly indistinguishable in amplitude as well as temporal evolution. Also shown for reference, areexponential relaxation curves with times scales of 3 and 5 yr.case, the fit suggests a relaxation time closer to 3 yr,which is somewhat shorter than that seen in the instantaneous doubling experiment. The fast early exponentialrelaxation helps justify the use of the 10–30-yr averageas the definition of the slow component.It has been understood since the first GCM comparisons of transient and equilibrium climate change (Manabeet al. 1991) that the spatial pattern of the surface warmingin transient simulations differs from the equilibrium pattern. In the initial stages of transient simulations, there isrelatively more tropical warming and less polar amplification, and especially smaller warming in the SouthernOceans. We expect to see this difference enhanced if wecompare the pattern of the slow component with that of thefast component, because the transient warming is dominated by the fast component while the equilibrium warming is a combination of both fast and slow components.We compute the patterns of the fast and slow components around the years 2100, 2200, and 2300. The slowcomponent is once again computed by averaging overyears 10–30 after the switch off in each case, while thefast component is computed as the difference betweenthe full A1B response, averaging over the 20 yr centeredon the date of the switch-off and the slow component.The zonal means of these patterns are shown in Fig. 6,normalized by the global mean in each case. We onlyshow the fast component for the 2100, 2200, and 2300cases, and the slow component for 2200 and 2300. Thepatterns are less robust for earlier times, especially for theslow component, because the forced responses are smallenough that internal variability is significant. MultipleVOLUME 23FIG. 6. Structure of the zonal mean response of surface air temperature in the recalcitrant and fast components, normalized sothat the global mean of each is unity. Two computations are shownfor the recalcitrant component (2200 and 2300) and three for thefast component (2100, 2200, and 2300), as simulated by CM2.1.realizations would be needed to study the detailed evolution of these spatial patterns. For the cases shown, thelatitudinal structures of the fast and slow responses areroughly conserved in time. As expected, the more pronounced differences between the patterns characterizingthe fast and slow components are in high southern latitudes, where the slow component is dominant in thesenormalized patterns, and in subtropical and middle latitudes in the Northern Hemisphere, where the normalizedfast component is larger. At least at the level of detailevident in these zonal means, there seems to be value inthinking of the response as a sum of two patterns withstructures that are conserved in time.The latitude–longitude structures of the normalizedresponses are shown for these same cases in Fig. 7. Thecooling in the subpolar North Atlantic is only apparentin the slow component, but weakens as time progresses(with or without normalization) despite the increase inthe amplitude of the slow component. Comparison withthe trend shown in Winton et al. (2010) for the forcingstabilized section of the same integration indicates a similar pattern to that of the slow component in Fig. 7, butwith no cooling in the subpolar North Atlantic. Thus, theassumption that the response is the sum of only two distinct patterns may be a useful idealization on the level ofzonal means, but of limited validity on closer inspectionof the spatial structure. We suspect that an additionaldegree of freedom measuring the strength of the Atlantic meridional overturning circulation is needed to fitthe evolution of these spatial structures.In the tropical Pacific, the fast pattern is La Niña–like,with maximum warming in the west, but this maximum
1 MAY 2010HELD ET AL.2425FIG. 7. The spatial pattern of the surface air temperature in the recalcitrant and the fast responses, normalized tounity over the sphere, for the same cases as shown in Fig. 6. The thick contour corresponds to a warming of 18C,separating those regions with responses larger and smaller than the global mean.moves to the east Pacific, becoming more El Niño–likein the slow pattern (cf. Cai and Whetton 2001). Thisevolution is consistent with the mechanism described byClement et al. (1996) as being active on fast time scales,with the eastern tropical Pacific temperatures held backby the continued upwelling of cold waters that have notyet felt the effects of warming. The normalized responsein this region grows on longer time scales as the upwelling waters warm. Further inspection reveals that there issignificant evolution toward the El Niño-like tropicalwarming pattern in the instantaneous doubling experiment of Fig. 1 over years 20–70 during which the globalmean response is temporarily equilibrated, suggestingthat this pattern emerges more quickly than does the globalmean amplitude of the slow response, which is indicativeof another limitation to a two-mode decomposition.Amplification of the response over land is evident inthe fast response, but much less so in the slow component.Lambert and Chiang (2007) describe how the ratio ofwarming over land and ocean is roughly constant in timein GCM simulations of the twentieth century and in future projections. Our results suggest some reduction inthis ratio is to be expected as the recalcitrant componentof the warming becomes significant. More generally, theaccuracy of the pattern scaling approximation, in whichthe geograp
The fast and slow components of global warming in a comprehensive climate model are isolated by ex-amining the response to an instantaneous return to preindustrial forcing. The response is characterized by an initial fast exponential decay with an e-folding time smaller than