Transcription
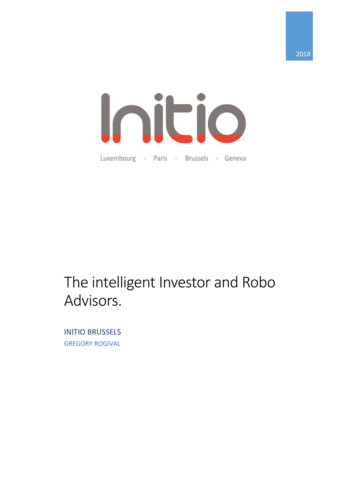
Investor PresentationQ1 2018
Cautionary StatementsThis presentation contains forward-looking information that reflects the current expectations,estimates and projections of management about the future performance and opportunities forChartwell and the seniors housing industry. The words “plans,” “expects,” “scheduled,” “estimates,”“intends,” “anticipates,” “projects,” “believes” or variations of such words and phrases or statements tothe effect that certain actions, events or results “may,” “will,” “could,” “might” occur and other similarexpressions identify forward-looking statements. Forward-looking statements are based upon anumber of assumptions and are subject to a number of known and unknown risks and uncertainties,many of which are beyond our control, and that could cause actual results to differ materially fromthose that are disclosed in or implied by such forward-looking statements.While we anticipate that subsequent events and developments may cause our views to change, we donot intend to update this forward-looking information, except as required by applicable securities laws.This forward-looking information represents our views as of the date of this presentation and suchinformation should not be relied upon as representing our views as of any date subsequent to the dateof this document. We have attempted to identify important factors that could cause actual results,performance or achievements to vary from those current expectations or estimates expressed orimplied by the forward-looking information. However, there may be other factors that cause results,performance or achievements not to be as expected or estimated and that could cause actual results,performance or achievements to differ materially from current expectations. There can be noassurance that forward-looking information will prove to be accurate. Accordingly, readers should notplace undue reliance on forward-looking information. See the "Risks and Uncertainties" section in our2017 MD&A and risk factors highlighted in materials filed with the securities regulatory authorities inCanada from time to time, including but not limited to our most recent Annual Information Form.In this document we use a number of performance measures that are not defined in generallyaccepted accounting principles (“GAAP”) such as Funds from Operations (“FFO”), “Net Debt”,“Adjusted EBITDA”, “Net Debt to Adjusted EBITDA Ratio”, “Imputed Cost of Capital”, “Lease-upLosses”, “Adjusted Development Costs”, “Unlevered Yield”, “Adjusted Resident Revenue”, “AdjustedDirect Property Operating Expense”, and any related per unit amounts to measure, compare andexplain the operating results and financial performance of the Trust (collectively, the “Non-GAAPFinancial Measures”). These Non-GAAP Financial Measures do not have a standardized meaningprescribed by GAAP and, therefore, may not be comparable to similar measures used by otherissuers. Please refer to the Q1 2018 MD&A for details.In this document we use various financial metrics and ratios in our disclosure of financial covenantssuch as “Consolidated EBITDA to Consolidated Interest Expense Ratio”, “Indebtedness Percentage”,“Consolidated EBITDA”, “Consolidated Interest Expense”, “Consolidated Indebtedness”. Thesemetrics are calculated in accordance with the definitions contained in our Credit Agreements, and maybe described using terms which differ from standardized meanings prescribed by GAAP. Thesemetrics may not be comparable to similar metrics used by other issuers. Please refer to the “Liquidityand Capital Resources – Financial Covenants” section of the Q1 2018 MD&A for details.making people’s lives BETTER 2
Why Chartwell?Guided by our Vision, Mission and Values of Respect we focuson providing quality care and services to our residents which webelieve will translate in sustainable earnings growth and longterm value creation for our unitholders.making people’s lives BETTER 3
Why Chartwell?1. Unmatched national operating platform2. Well-located and well-maintained real estate portfolio3. Significant long-term growth potentialDemographic trends more demandGovernment fiscal constraints more private pay demandFragmented industry consolidation opportunities4. Strong earnings growth potential1% growth in occupancy or rate 2 cents growth in FFOFourth consecutive annual increase in distributions effectiveMarch 31, 20185. Solid financial position and investment gradecreditmaking people’s lives BETTER 4
Profile - CorporateMember of S&P/TSXComposite Indexsince 2005Largest CanadianOwner/ OperatorSignificantEmployer 3.3 Billion (1)209 / 30,903(2)14,360Market CapitalizationCommunities / Suites & BedsEmployeesRevenueAdjusted EBITDAHigh Occupancy Rates 905.6 Million (3) 282.3 Million (3)92.1% (4)Interest CoverageRatioNet Debt toAdjusted EBITDA3.2 (3)7.7 (3)Debt toCapitalization36.2% (1)As at March 31, 2018(1) Trust Unit price 15.65 at March 29, 2018(2) Includes development properties and Batimo development properties under management(3) Rolling twelve months ended March 31, 2018 including proforma adjustments(4) Same property portfolio for the quarter ended March 31, 2018making people’s lives BETTER 5
Profile – Property Portfolio Majority owned, well-maintained, well-located properties Diversified geographically and by service offeringBy Ownership (1)By Geographic Location (3)BritishColumbia,10%PartiallyOwned, 31%Alberta, 3%100%Owned, 63%Quebec, 32%Ontario, 55%Managed, 6%Leader in each of its markets:Province1)2)3)4)Share of Market (4)Ontario17%Quebec8%British Columbia7%Alberta6%Based on number of suites. Excluding development properties and development properties managed for Batimo.Minimum ownership of partially owned properties is 50%.Based on number of suites as of March 31, 2018.Ratio of Chartwell operated suites to total retirement suites inventory as reported by CMHC in their Seniors‟ Housing Report (2017)making people’s lives BETTER 6
Profile - IndustryIndependentSupportive Living(ISL) & IndependentLiving (IL)Assisted Living (AL)& Memory Living(ML)Long Term Care (LTC)Level of Care:Low to mediumMedium to highVery highTargetResident:More active, healthy seniorsSeniors with somecognitive and/or physicalimpairmentsSeniors with acute cognitiveand/or physical impairmentsrequiring higher levels of dailypersonal careServiceOffering:Activities, transportation,securityAvailability of meals,housekeeping, basicassistance with daily livingISL/IL services Careservices and specific MLprogramming included24-hour registered nursingcare or supervisionFunding:Predominantly private payMostly private payPredominantly governmentfundedRegulations:Mostly consumer protectionMostly consumerprotectionHeavily regulatedLong TermCare, 16%Chartwell’s Portfolioby Level of CareIndependentLiving, 5%MemoryCare, 1%AssistedLiving, 6%83%ISL/IL/AL/MLmaking people’s lives BETTER IndependentSupportiveLiving, 72%7
Profile - IndustrySignificant Future Demand in CanadaProjected Aged 75 and over Population, 2017-2036, Projected 75 2,800Average Annual Increase87,300113,200147,800175,000179,900Source: Statistics Canada, Population Projections for Canada, Provinces, and Territories, 2009 to 2036, Catalogue no. 91-520-X Current supply is 425,000 suites 600,000 new suites are required by 2036Total SupplyRequired Annual Supply1,200,000Long Term 0020182021202620312036Retirement demand is estimated by applying the current national capture rate of 8.98% (CMHC Seniors Housing Report Canada) to 75 population as reported by Statistics Canada.LTC demand is estimated based on 97.8 beds per 1,000 people aged 75 and over. This estimate represents the LTC Beds/Populationratios reported by Statistics Canada in their Residential Care Facilities reports.making people’s lives BETTER 8
Profile - IndustryCanadian Supply ConcentrationLargest Retirement OperatorsNo. of PropertiesOperated (1)No. of SuitesOperated (2)Largest Long Term Care OperatorsNo. of PropertiesOperated (1)No. of SuitesOperated (2)1Chartwell Retirement Residences18127,2111Extendicare Inc.10113,5622Revera Inc.10012,1752Revera Inc.7510,0993BayBridge Senior Living698,6943Sienna Senior Living426,7384Réseau Sélection338,5504Chartwell Retirement Residences283,6925Cogir347,6035Schlegel Villages152,3016Le Groupe Maurice277,5796Retirement Concepts171,9187Groupe Savoie145,3317Group Champlain141,7468Verve Senior Living364,4758Park Place Seniors Living151,6929All Seniors Care294,3839Shannex Inc.141,64810Atria Senior Living293,35410Rykka Care Centres91,52011Shannex Inc.122,14211Jarlette Health Care141,48612Retirement Concepts192,03112Omni Health Care181,47513Schlegel Villages81,82013Caressant Care151,24714Good Samaritan Society251,71314Good Samaritan Society131,22815Sienna Senior Living151,50215Steeves & Rozema792863198,56339751,280Total15 Largest Operators’ Share of Total Suites43%Total15 Largest Operators’ Share of Total Suites(1) Includes properties under development; Includes managed properties for third parties(2) Includes only IL, AL and MC suites within the above-noted properties(1) Includes properties under development; Includes managed properties for third parties(2) Includes only LTC units within the above-noted propertiesSource: CBRE Limited and ChartwellSource: CBRE Limited and Chartwellmaking people’s lives BETTER 26%9
Profile – Strong GovernanceGlobe and Mail Board Games 2017 - Ranked #7 in the Country(Top Real Estate and Healthcare Company)Board Members - IndependentRelevant ExperienceTenure onChartwell’s Board Senior business advisor at Fasken Martineau Du Moulin LLP Director of Canaccord Genuity, Colliers International, Route 1 Former Premier of OntarioLiseBastarache1,2 Director of Laurentian Bank of Canada and Jean Coutu Group Former RBC ExecutiveAnnDavis1,2 Director of Gluskin Sheff Associates Inc., Director ofWomen’s College Hospital Foundation, Canada GuarantyMortgage Insurance Company Former partner of KPMGAndreKuzmicki2 Director of Dorsay Development Corporation Former Executive Director of the Brookfield Centre in RealEstate, Schulich School of Business, York University Director of RIO2 Limited and Amerigo Resources Inc. Former Senior Partner of Torys LLPSharonSallows2,3 Trustee RioCan REIT Director, Home Capital Group Inc. and AMICO Former principal at Ryegate Capital CorporationHuwThomas1,3 CEO and Trustee of SmartCentres REIT Director of Dollarama6 See management team page14Michael D.Harris3(Chair)(Chair, InvestmentCommittee)SidneyRobinson1,3(Chair, CG&NCommittee)(Chair, AuditCommittee)W. Brent Binions14131131481Member of the Audit CommitteeMember of the Investment Committee3 Member of the Compensation, Governance and Nominating Committee (“CG&N”)2making people’s lives BETTER 10
Profile - ExperiencedExecutive Team 100 years of collective industry experienceName & TitleTenureIndustrywithExperienceChartwellW. Brent Binions1President andChief ExecutiveOfficer Past President of the Ontario Long TermCare Association and a past VicePresident of the Ontario Residential CareAssociation1436Vlad VolodarskiChief FinancialOfficer & ChiefInvestment Officer Prior to joining Chartwell, was a SeniorManager with KPMG LLP1414 Prior to joining Chartwell, heldprogressive positions over a 21 yearcareer at the Ontario Long Term CareAssociation, including six years as theirExecutive Director1031 Prior to joining Chartwell, held variouspositions at Retirement ResidencesREIT including Senior Vice President ofFinance and Director of CorporateAccounting1118 Prior to joining Chartwell, practicedcorporate and securities law at TorysLLP1010Karen SullivanChief OperatingOfficerSheri ChateauvertChiefAdministrativeOfficerJonathan M.BoulakiaChief Legal Officer1Past ExperienceAlso on the Board of Directors. Only non-independent board member.making people’s lives BETTER 11
Profile – Customer Satisfactionand Employee EngagementEmployee Engagement:Very Engaged 41.4%(1)Customer Satisfaction:Very Satisfied: 53.0%(1)(1)Only “top box” scores of very satisfied and very engaged are considered in this scoremaking people’s lives BETTER 12
Profile – Historical PerformanceResident Revenue ( millions)874.5922.7 927.8834.7750.6EBITDA ( millions)877.4260.1246.4 2.32011250.7201220132014201520162017Source: Company disclosure. Includes Chartwell’s proportionate share of equity accounted joint ventures.In 2015 Chartwell sold its U.S portfolio of 35 properties.1Note:Proven track record of profitable growth39making people’s lives BETTER 13
Profile – Historical PerformanceFFO ( 420112012201320162017Same property portfolio performance Same property portfolio as defined in each yearmaking people’s lives BETTER 14
Profile – Credit MetricsInterest Coverage Ratio (1)3.73.53.0Net Debt to Adjusted EBITDA (1)3.27.77.77.32015201620172018 YTDIndebtedness Percentage (2)201520166.920172018 YTDDebt to Capitalization (3)BBB(l) rated by DBRS43.1%40.3%35.4%36.2%20172018 YTD50.1%49.3%49.3%45.0%2015201620172018 YTD(4)20152016(4)Demonstrated ability to rationalize capital structure(1)(2)(3)(4)Rolling 12 months, including proforma adjustmentsAs of the end of the period, including proforma adjustmentsAt market value of Trust UnitsAs at March 31, 2018making people’s lives BETTER 15
Building Sustainable ValueStrategic PrioritiesGrow corepropertyportfoliocontributionMaintaina strongfinancialpositionExceptionalservices andquality careImprovequality andefficiency ofour corporatesupportservicesmaking people’s lives BETTER Build valueof ourreal estateportfolio16
Building Sustainable ValueGrow Core PropertyPortfolio ContributionMaintain andgrow occupancyExceptional Services,Quality CareBrandingGrow revenueControl costsOccupancyLabour relationsRate managementand suite turnoverCentralizedpurchasingAncillary servicesprogramEnergy managementmaking people’s lives BETTER SalesImproved training programsPerformance-basedcompensation0.6ppin Q1 2018 *3.3%in Q1 2018 *Adjusted NOI4.3%in Q1 2018 *1.3% in Q1 2018 ** Same property for the quarter ended March 31, 2018 compared to the same period of 2017making people’s lives BETTER 17
Building Sustainable ValueImprove Quality and Efficiency ofour Corporate Support ServicesContinuinginvestmentsin ITinitiatives2011- Budgeting and forecasting system2012- Consolidation and reporting system2013- Core financial system- Prospect management system- Standardized IT infrastructure rollout- Capital budget system2014- Procurement and payment system- Capital asset management and reporting system2015- Internalized business support centre “At yourService”2016-2018- Implementation of Human Capital ocial MediaSearch Engine Optimization and MarketingChartwell Contact Centremaking people’s lives BETTER 18
Building Sustainable ValueDebt Maturities* 10% of total debt 184.2 millionMortgage PortfolioAt March 31, 2018Amount ( millions)Weighted average rateAverage term to maturity (years) At December 31, 2017Fixed RateVariable .84%3.86%7.66.17.67.872% of total mortgages are CMHC insured.making people’s lives BETTER 19
Building Sustainable ValueBuild Value of our Real Estate PortfolioPortfolio andAsset ManagementDevelopmentMarket andIndustry ResearchAcquisitionsRiskManagement2Q1 2018 Ongoing focus on portfolio optimization resulted in the sale of threenon-core properties in Quebec for 32.0 million. Work continues on our development pipeline of 1,338 suites with sixprojects in construction and three projects in pre-development. Strong acquisition pipeline of development projects from Batimo with2,784 suites.making people’s lives BETTER 20
Building Sustainable Value Improving portfolio by selling older assets and buying/building newer,high-quality assets. Since 2013, the average age of suites acquired/developed is 8.1 years. Since 2013, the average age of suites sold is 26.5 years.Average Age of Assets Acquired/Developed vs. SoldSuites Acquired/DevelopedSuites 1,3811,9575,53740025050921making people’s lives BETTER 21
Building Sustainable Value2.538.426.458ILC17.51.118.612.4Toronto, Lively, ONOrangeville,ONAjax, 021Q42020Q32021Q22021Q42018Q12022ExpectedUnlevered Yield (2)35.9Estimated Stabilized NOI (2)( millions)CExpectedStabilized Occupancy (%)Adjusted Development Costsincurred as at December 31, 2017 (2)( millions)ILSuiteTypeExpectedStabilized Occupancy DateEstimatedAdjusted Development Costs (3)( millions)105Suites/ BedsActual / ExpectedCompletion DateEstimated Imputed Cost of Capitaland Lease-up-Losses (2)( millions)Burnaby, BCKitchener,ONLocationChartwell CarltonRetirement ResidenceChartwell BanksideRetirement ApartmentsThe Sumach byChartwell (4)Chartwell WescottRetirement ResidenceChartwell GuildwoodRetirement Residence (5)Chartwell MeadowbrookVillageChartwell MontgomeryVillageChartwell Ballycliffe LTCEstimated Development Cost( millions)ProjectCurrent Project Status (1)Highlights of Development roject by Signature Retirement Living (“Signature Living”)Kingston Project (7)Kingston, ON1651,338(1)(2)(3)(4)(5)(6)(7)ISL/ALCCurrent project status is defined where „C‟ means „Construction‟ and „P‟ means „Pre-Development‟.Non-GAAP. The definition of this metric and the discussion of its significance can be found at the beginning of this section onpage 7 of this MD&A.Non-GAAP; represents the total of Estimated Development Costs and Estimated Imputed Cost of Capital and Lease-upLosses.Chartwell owns a 45% interest in this project and manages pre-opening and lease-up.Redevelopment of the existing 83-suite residence to a 172-suite residence. Chartwell owns a 50% interest in this project.We filed an application with the Ontario Ministry of Health and Long Term Care (the “MOH”) to redevelop the existing 100-bedClass C LTC and 40-suite retirement residence into a 192-bed LTC residence. The MOH agreed to provide the additional 92licensed LTC beds. The retirement operations have been discontinued at this location, however, the existing LTC operationswill continue during this phased redevelopment.The site includes excess land for potential development of 84 additional suites. Chartwell owns a 60% interest in this projectand Signature Living and its affiliates own the remaining 40% interest and provide development and operations managementservices. Chartwell expects to acquire the remaining 40% interest upon the property achieving the expected stabilizedoccupancy. Signature Living is entitled to a promote payment if the project‟s return on equity exceeds certain targets.Estimated Development Costs here include such estimated promote payment to Signature Living.making people’s lives BETTER 22
Building Sustainable ValueHighlights of Batimo Acquisition PipelineSuites /BedsSuite TypeCurrentProjectStatus (1)Actual / ExpectedCompletionDateExpectedStabilized OccupancyDateProjectLocationChartwell L’Unique IIISt. Eustache, QC163ISLOMarch 2017Q4 2018Chartwell Le PrescottVaudreuil, QC324ISLOJune 2017Q4 2019Chartwell Le MontcalmCandiac, QC283ISLOSeptember 2017Q1 2020Chartwell St. GabrielSt. Hubert, QC345ISL / ALOMay 2018Q4 2018Chartwell Le Teasdale IITerrebonne, QC221ILCQ3 2018Q4 2019Chartwell Greenfield ParkLongueuil, QC368ISL / ALCQ2 2019Q2 2020Chartwell L’EnvolCap Rouge, QC360ISL / ALCQ3 2019Q1 2021Charlesbourg ProjectQuebec City, QC381ISL / ALPQ4 2019Q2 2021Chartwell AtwaterMontreal, QC339ISL / AL / MCPQ2 2021Q3 20232,784(1)Current project status is defined where „O‟ means „Operating‟, „C‟ means „Construction‟ and „P‟ means „Pre-Development‟.making people’s lives BETTER 23
Building Sustainable ValueDevelopment Case StudiesChartwell WaterfordChartwell MalaspinaCare Residence 131 suites 136 suites Opened December 2017 Opened June 2017 Unleveraged cash yield 8.1% Unleveraged cash yield 9.3% 43.6 million developmentcost 27.5 million developmentcostmaking people’s lives BETTER 24
2018 YTD Acquisitions*GriesbachSt. ,AlbertaSt. erwoodPark, Alberta268 suites230 suites72 suites205 suites256 suites 418 million*Closed in Q2 2018.making people’s lives BETTER 25
2017 ean,ONNepean,ONThunderBay, ONVineland,ONTerrebonne,QC161 suites161 suites200 suites66 suites107 suites343 suites85% interestacquired for 6.95M 121 million combinedmaking people’s lives BETTER Le TeasdaleTerrebonne, 22.0M 60.8MQC343 suites – 85%interest acquired for 60.8 million26
Financial PerformanceQ1 2018 Highlights FFO up 1.7% Same property adjusted NOI up 1.3% Same property occupancy was 92.1%Q12018Q12017Increase/(Decrease)Net income (loss) ( millions) 15.5( 4.2) 19.7FFO ( millions) 42.8 42.1 0.7FFO per unit (1) 0.20 0.22( 0.02)Average occupancy – same property92.1%92.7%(0.6pp)Adjusted NOI – same property ( millions) 66.0 65.2 0.8(1) Per unit amounts impacted by the issuance of 17.7 million of Trust Units in Q4 2017 for financing of the acquisition of fourproperties in Alberta which closed in Q2 2018.making people’s lives BETTER 27
Financial PerformanceOntario Retirement PlatformQ1 2018Q1 2017Increase/(Decrease) %Adjusted NOI ( millions) 32.8 32.0 0.82.6%Occupancy88.2%88.6%N/A(0.4pp)Same property statistics: Adjusted NOI growth driven by rate increases in line with competitivemarket conditions and lower utility costs. Competitive pressures in certain markets from new 9%88.6%Q3 16Q4 16Q1 1787.4%88.3%88.8%88.2%Q3 17Q4 17Q1 1885%80%75%70%Q1 16Q2 16making people’s lives BETTER Q2 1728
Financial PerformanceWestern Canada PlatformQ1 2018Q1 2017Increase/(Decrease) %Adjusted NOI ( millions) 12.7 12.4 0.32.4%Occupancy96.2%96.2%N/A-Same property statistics: Adjusted NOI growth driven by rental rate increases in line withcompetitive market conditions.Occupancy100%95%95.8%94.8% 95.0%97.0% 96.2% 96.3% 96.8% 97.1% 96.2%90%85%80%75%70%Q1 16Q2 16Q3 16making people’s lives BETTER Q4 16Q1 17Q2 17Q3 17Q4 17Q1 1829
Financial PerformanceQuebec PlatformQ1 2018Q1 2017Increase/(Decrease) %Adjusted NOI ( millions) 14.4 14.6( 0.2)(1.2%)Occupancy92.3%93.5%N/A(1.2pp)Same property statistics: Adjusted NOI decreased due primarily to lower occupancies andhigher staffing costs. Competitive pressures in certain markets from new 3.5%92.7%92.9%93.2%Q1 17Q2 17Q3 17Q4 1792.3%90%85%80%75%70%Q1 16Q2 16Q3 16making people’s lives BETTER Q4 16Q1 1830
Financial PerformanceOntario LTC PlatformQ1 2018Q1 2017Increase/(Decrease) % 6.1 6.2( 0.1)(2.1%)97.7%98.0%N/A(0.3pp)Same property statistics:Adjusted NOI ( millions)Occupancy Adjusted NOI decreased primarily due to timing of certain expenses.Occupancy100%98.7% 98.9% 99.0% 98.6% 98.0% 98.5% 98.7% 98.7%97.7%95%90%85%80%75%70%Q1 16 Q2 16 Q3 16 Q4 16 Q1 17 Q2 17 Q3 17 Q4 17 Q1 18making people’s lives BETTER 31
Supportive Living (ISL) & Independent Living (IL) Assisted Living (AL) & Memory Living (ML) Long Term Care (LTC) Level of Care: Low to medium Medium to high Very high Target . 8 Verve Senior Living 36 4,475 9 All Seniors Care 29 4,383 10 Atria Senior Living 29 3,354 11 Shannex Inc. 12 2,142 12 Retirement Concepts 19 2,031 .