Transcription
Lab manual forDigital Signal Processing LabIII B. Tech II SemesterPrepared byJ. Sunil Kumar, P.Saritha&Ch.Sateesh kumar reddyDepartment of Electronics & Communication EngineeringTurbomachinery Institute of Technology & Sciences(Approved by AICTE & Affiliated to JNTUH)Indresam(v), Patancheru(M), Medak(Dist). Pin: 502 319
Date: DSP Lab Manual Turbomachinery Institute of Technology & SciencesCertificateThis is to certify that Mr. / Ms. . RollNo . of I/II/III/IVB.Tech I / II Semester of . . branch has completed the laboratory worksatisfactorily in . . . Lab for the academic year 20 to 20 as prescribed in thecurriculum.Place: . .Date: . .Lab In chargeHead of the DepartmentPrincipal.1Turbomachinery Institute of Technology & Sciences, Hyd. 319
Date: DSP Lab Manual LIST OF EXPERIMENTS:1. Generation of Sinusoidal Waveform / Signal2. To find the DFT / IDFT of given DT Signal3. To find the frequency response of a given system in transfer function4. Implementation of FFT of given sequence5. Implementation of LP FIR filter for given sequence6. Implementation of HP FIR filter for given sequence7. Implementation of LP IIR filter for given sequence8. Implementation of HP IIR filter for given sequence9. Determination of power spectrum of a given sequence10. Generation of DTMF Signals11. Implementation of Decimation Process12. Implementation of Interpolation Process2Turbomachinery Institute of Technology & Sciences, Hyd. 319
Date: DSP Lab Manual 1. INTRODUCTION TO MATLAB.GENERATION OF BASIC SIGNALS USING MATLABAIM: Generation of Sine Wave & Illustration of the Sampling Process in the Time DomainEQUIPMENT REQUIRED:P – IV ComputerWindows Xp SP2MATLAB 7.0THEORY:3Turbomachinery Institute of Technology & Sciences, Hyd. 319
Date: DSP Lab Manual PROGRAM :% Generation of Sine Wave & Illustration of the Sampling Process in the Time Domainclc;t 0:0.0005:1;a 10f 13;xa l('Time, msec');ylabel('Amplitude');title('Continuous-time signal x {a}(t)');axis([0 1 -10.2 10.2])subplot(2,1,2);T 0.01;n 0:T:1;xs a*sin(2*pi*f*n);k 0:length(n)-1;stem(k,xs);gridxlabel('Time index n');ylabel('Amplitude');title('Discrete-time signal x[n]');axis([0 (length(n)-1) -10.2 10.2])a 10EXPECTED GRAPH:4Turbomachinery Institute of Technology & Sciences, Hyd. 319
Date: DSP Lab Manual RESULTViva Questions:1. Define sinusoidal signal2. Define C.T.S3. Define D.T.S.4. Compare C.T.S & D.T.S5. DefineStem, Plot, Plot3,fplot, ezplot, linspace, flyplr, grid,mesh and legend6. Draw the C.T.S & D.T.S diagramsEXERCISE QUESTIONS:1. Write program to get Discrete time Sinusoidal Signal2. Write program to get Fourier Transform of Sinusoidal Signal3. Write program to get Inverse Fourier Transform of Sinusoidal Signal4. Write Program for the following FunctionY exp(-2* *f*t) exp(-8* *f*)Y ((exp(-1.56 f)*Sin(2 f) cos(2 f)5Turbomachinery Institute of Technology & Sciences, Hyd. 319
Date: DSP Lab Manual 2. DFT/IDFT of a sequence without using the inbuilt functionsAIM: To find the DFT/IDFT of a sequence without using the inbuilt functionsEQUIPMENT REQUIRED:P – IV ComputerWindows Xp SP2MATLAB 7.0THEORY:6Turbomachinery Institute of Technology & Sciences, Hyd. 319
Date: DSP Lab Manual PROGRAM:%program to find the DFT/IDFT of a sequence without using the inbuilt functionsclcclose all;clear all;xn input('Enter the sequence x(n)'); %Get the sequence from userln length(xn);%find the length of the sequencexk zeros(1,ln);%initilise an array of same size as that of input sequence%initilise an array of same size as that of input sequenceixk zeros(1,ln);%code block to find the DFT of the -----------------for k 0:ln-1for n 0:ln-1xk(k 1) xk(k 1) (xn(n ------------------------------------------%code block to plot the input ------------------t 0:ln-1;subplot(221);stem(t,xn);gridylabel ('Amplitude');xlabel ('Time Index');title('Input ------------------------magnitude abs(xk); % Find the magnitudes of individual DFT points%code block to plot the magnitude ------------------t 0:ln-1;subplot(222);stem(t,magnitude);gridylabel ('Amplitude');xlabel ('K');title ('Magnitude ---------------------phase angle(xk); % Find the phases of individual DFT points%code block to plot the magnitude ------------------t 0:ln-1;subplot(223);stem(t,phase);gridylabel ('Phase');xlabel ('K');title('Phase ---------------------% Code block to find the IDFT of the ------------------for n 0:ln-1for k 0:ln-17Turbomachinery Institute of Technology & Sciences, Hyd. 319
Date: DSP Lab Manual ixk(n 1) ixk(n 1) (xk(k 1)*exp(i*2*pi*k*n/ln));endendixk ------------------%code block to plot the input ------------------t 0:ln-1;subplot(224);stem(t,xn);grid;ylabel ('Amplitude');xlabel ('Time Index');title ('IDFT sequence');Expected Output Waveform:RESULT:VIVA QUESTIONS:1. How many additions and multiplications are needed in DFT?2. What is the relation between Fourier transform and Z-transform?.8Turbomachinery Institute of Technology & Sciences, Hyd. 319
Date: DSP Lab Manual 3. Study Frequency Response Of Second Order SystemAIM: To study frequency response of second order system using MATLAB & Code Composer Studio3.1.EQUIPMENT REQUIRED:P – IV ComputerWindows Xp SP2MATLAB 7.0THEORY:9Turbomachinery Institute of Technology & Sciences, Hyd. 319
Date: DSP Lab Manual PROGRAM:clcclose allx 1num [10];dem [0.01 1.2 1.0];c tf(num,dem); %Specify transfer functionsw 0:0.1:10;H freqresp(c,w);for i 1:1:101p(i) abs(H(:,:,i))endplot(w,p)grid;title('frequency response of sencond order system')xlabel('w')ylabel('Amplitude')OUTPUT WAVE FORM:RESULT:10Turbomachinery Institute of Technology & Sciences, Hyd. 319
Date: DSP Lab Manual 4. IMPLEMENTATION OF FFT OF GIVEN SEQUENCEAIM: Implementation of FFT of given sequenceEQUIPMENT REQUIRED:P – IV ComputerWindows Xp SP2MATLAB 7.0THEORY:11Turbomachinery Institute of Technology & Sciences, Hyd. 319
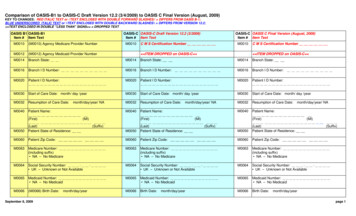
Date: DSP Lab Manual PROGRAM%To compute the FFT of the impulse sequence and plot magnitude and phase responseclc;clear all;close all;%impulse sequencet -2:1:2;y [zeros(1,2) 1 zeros(1,2)];subplot (3,1,1);stem(t,y);grid;input('y ');disp(y);title ('Impulse Response');xlabel ('time -- ');ylabel ('-- Amplitude');xn y;N input('enter the length of the FFT sequence: ');xk fft(xn,N);magxk abs(xk);angxk angle(xk);k );ylabel(' x(k) el('k');ylabel('arg(x(k))');outputs:y 0 0100enter the length of the FFT sequence: 101.00000.3090 - 0.9511i-0.8090 - 0.5878i-0.8090 0.5878i 0.3090 0.9511i1.00000.3090 - 0.9511i-0.8090 - 0.5878i-0.8090 0.5878i 0.3090 0.9511i12Turbomachinery Institute of Technology & Sciences, Hyd. 319
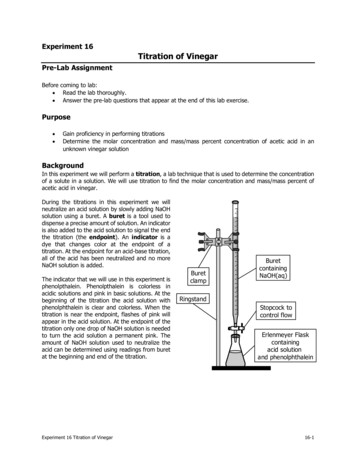
Date: DSP Lab Manual EXPECTED WAVEFORMS-- AmplitudeImpulse Response10.50-2-1.5-1-0.50time -- 0.511.52 x(k) 10.50012345678956789karg(x(k))50-501234k%To compute the FFT of the step sequence and plot magnitude and phase responseclc;clear all;close all;%Step Sequences input ('enter the length of step sequence');t -s:1:s;y [zeros(1,s) ones(1,1) ones(1,s)];subplot(3,1,1);stem(t,y);gridinput('y ');disp(y);title ('Step Sequence');xlabel ('time -- ');ylabel ('-- Amplitude');xn y;N input('enter the length of the FFT sequence: ');xk fft(xn,N);magxk abs(xk);angxk angle(xk);k ');Turbomachinery Institute of Technology & Sciences, Hyd. 319
Date: DSP Lab Manual ylabel(' x(k) l('k');ylabel('arg(x(k))');outputs:enter the length of step sequence: 5y 0 0 0 0 0 1 1 1 1enter the length of the FFT sequence: 10115.0000-1.0000 3.0777i0-1.0000 0.7265i-1.0000 - 0.7265i0-1.0000 - 3.0777i0-1.0000EXPECTED WAVEFORMS-- AmplitudeStep Sequence10.50-5-4-3-2-10time -- 12345 x(k) 50012345678956789karg(x(k))50-501234k%To compute the FFT of the Ramp sequence and plot magnitude and phase responseclc;clear all;close all;%Ramp Sequences input ('enter the length of Ramp sequence: ');t 0:s;y tsubplot(3,1,1);14stem(t,y);Turbomachinery Institute of Technology & Sciences, Hyd. 3190
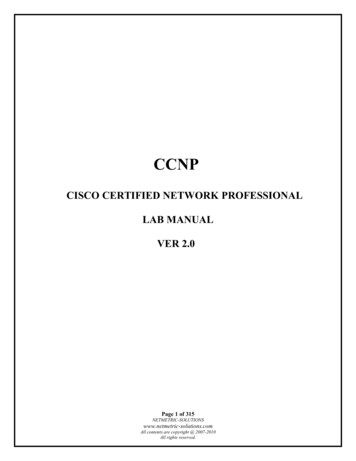
Date: DSP Lab Manual gridinput('y ');disp(y);title ('ramp Sequence');xlabel ('time -- ');ylabel ('-- Amplitude');xn y;N input('enter the legth of the FFT sequence: ');xk fft(xn,N);magxk abs(xk);angxk angle(xk);k ;ylabel(' x(k) l('k');ylabel('arg(x(k))');OUTPUT: enter the length of Ramp sequence: 5y 0 1 2 3 4 5enter the length of the FFT sequence: 1015.0000-7.7361 - 7.6942i2.5000 3.4410i-3.00002.5000 - 0.8123i-3.2639 1.8164i-3.2639 - 1.8164i2.5000 - 3.4410i2.5000 0.8123i-7.7361 7.6942iEXPECTED WAVEFORMS15Turbomachinery Institute of Technology & Sciences, Hyd. 319
Date: DSP Lab Manual -- Amplituderamp Sequence5000.50111.522.5time -- 33.544.55 x(k) 201002345678956789karg(x(k))50-501234k%To compute the FFT of the Exponential sequence and plot magnitude and phase responseclc;clear all;close all;%exponential sequencen input('enter the length of exponential sequence: ');t 0:1:n;a input('enter "a" value: ');y exp(a*t);input('y onential (y);xn y;N input('enter the length of the FFT sequence: ');xk fft(xn,N);magxk abs(xk);angxk angle(xk);k k');Turbomachinery Institute of Technology & Sciences, Hyd. 319
Date: DSP Lab Manual ylabel(' x(k) el('k');ylabel('arg(x(k))');OUTPUTS:enter the length of exponential sequence: 5enter "a" value: 0.8y 1.00002.22554.9530 11.0232 24.5325 54.5982enter the length of the FFT sequence: 1098.3324-37.3613-73.5207 -30.9223i 50.9418 24.7831i38.8873 - 7.3387i -41.7941 16.0579i-41.7941 -16.0579i50.9418 -24.7831i38.8873 7.3387i-73.5207 30.9223i3.54.55EXPECTED WAVEFORMSexponential responseamplitude10050000.50111.522.5time34 x(k) rbomachinery Institute of Technology & Sciences, Hyd. 319
Date: DSP Lab Manual 18Turbomachinery Institute of Technology & Sciences, Hyd. 319
Date: DSP Lab Manual 5. IMPLEMENTATION OF LP FIR FILTERSAIM: Implementation of Low Pass FIR filter for given sequence.EQUIPMENT REQUIRED:P – IV ComputerWindows Xp SP2MATLAB 7.0THEORY:A Finite Impulse Response (FIR) filter is a discrete linear time-invariant system whose outputis based on the weighted summation of a finite number of past inputs. An FIR transversal filterstructure can be obtained directly from the equation for discrete-time convolution.In this equation, x(k) and y(n) represent the input to and output from the filter at time n. h(n-k) isthe transversal filter coefficients at time n. These coefficients are generated by using FDS(Filter Design Software or Digital filter design package).FIR – filter is a finite impulse response filter. Order of the filter should be specified. Infiniteresponse is truncated to get finite impulse response. placing a window of finite length doesthis. Types of windows available are Rectangular, Barlett, Hamming, Hanning, Blackmann windowetc. This FIR filter is an all zero filter.PROCEDURE:1.2.3.4.Enter the passband ripple (rp) and stopband ripple (rs).Enter the passband frequency (fp) and stopband frequency (fs).Enter the sampling frequency (f).Calculate the analog passband edge frequency (wp) and stop band edge frequency (ws)wp 2*fp/fws 2*fs/f5. Calculate the order of the filter using the following formula,(-20log10 (rp.rs) –13)n (14.6 (fs-fp)/f).[Use ‘ceil( )’ for rounding off the value of ‘n’ to the nearest integer] if ‘n’ is anodd number, then reduce its value by ‘1’.6. Generate (n 1)th point window coefficients.For example boxcar(n 1) generates a rectangularwindow. y boxcar(n 1)7. Design an nth order FIR filter using the previously generated (n 1) length window function.b fir1(n,wp,y)8. Find the frequency response of the filter by using ‘freqz( )’ function. [h,o] freqz(b,a,k) Thisfunction returns k-point complex frequency response vector ‘h’ and k-point frequency vector ‘o’in radians/samples of the filter.H(eiw) B(ejw) b(1) b(2)e-jw .b(m 1)e-jmwA(ejw) a(1) a(2)e-jw .a(n 1)e-jnwWhere a, b are vectors containing the19denominatorandnumeratorTurbomachinery Institute of Technology & Sciences, Hyd. 319
Date: coefficients.DSP Lab Manual Here a 1.9. Calculate the magnitude of the frequency response in decibels (dB). m 20*log10(abs(h))10. Plot the magnitude response [magnitude in dB Vs normalized frequency (o/pi)]11. Give relevant names to x- and y- axes and give an appropriate title for the plot.PROGRAMclc;close all;clear all;rp 0.05%input('enter the passband ripple');rs 0.04%input('enter the stopband ripple');fp 1500%input('enter the passband frequency');fs 2000%input('enter the stopband frequency');f 8000%input('enter the sampling freq');wp 2*fp/f;ws 2*fs/f;num -20*log10(sqrt(rp*rs))-13;dem 14.6*(fs-fp)/f;n ceil(num/dem);n1 n 1;if(rem(n,2) 0)n1 n;n n-1;endy boxcar(n1);b fir1(n,wp,y);[h,o] freqz(b,1,256);m 20*log10(abs(h));an angle(h);figure(1)plot(o/pi,m);title('******** LOW PASS FIR FILTER RESPONSE ********');ylabel('GAIN in db--- ');20Turbomachinery
Lab manual for Digital Signal Processing Lab III B. Tech II Semester Prepared by J. Sunil Kumar, P.Saritha & Ch.Sateesh kumar reddy Department of Electronics & Communication Engineering Turbomachinery Institute of Technology & Sciences (Approved by AICTE & Affiliated to JNTUH) Indresam(v), Patancheru(M), Medak(Dist). Pin: 502 319