Transcription
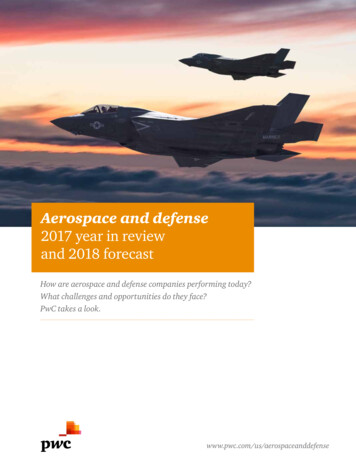
Aerospace and defense2017 year in reviewand 2018 forecastHow are aerospace and defense companies performing today?What challenges and opportunities do they face?PwC takes a look.www.pwc.com/us/aerospaceanddefense
MethodologyOur data is drawn from financial reports on fiscal year (FY)2017, results for the largest 100 aerospace and defense (A&D)companies by revenue (see Appendix A) and other publiclyavailable information, such as company websites and pressreleases. Our cut-off date for publication was April 1, 2018.A&D companies include those that generate the majority ofrevenue from aerospace or defense activities or, for diversifiedcompanies, those reportable segments that derive a majorityof their revenue from A&D activities. The results are reportedin US dollars. Foreign currencies were translated at averageexchange rates for years ending December 31, 2017 andDecember 31, 2016 respectively.Our report also expresses PwC’s point of view on topicsaffecting the industry, developed through interactions with ourclients and other industry leaders and analysts.PwCAerospace and defense2
Aerospace and defense overviewPwC4Commercial aerospace14Defense24Mergers and acquisitions32Summary34Appendix36Additional resources40Aerospace and defense3
Aerospace and defense overview2017 reviewAerospace anddefense industryreports record profitRevenue increases 4%;operating profitincreases 18%Boeing reports 10 billion inoperating profit toregain “most profitablecompany” statusThe aerospace and defense industry reported record profits of 77 billion in 2017, an 18% increase over the prior year, andsurpassing the previous record set in 2014 by 5%. Industryrevenue was 728 billion, an increase of 4% over 2016, andnearly matching the record revenues of 729 billion in 2014.Boeing’s operating profit exceeded 10 billion, a first forany A&D company. Boeing’s 4.4 billion profit improvementexceeded the total profits for all but two other companies(GE Aviation and Lockheed Martin). Boeing’s performancecatapulted it back to become the industry’s most profitablecompany by a large margin, an honor which was taken by GEAviation in 2016. GE Aviation retained second place, with a 9%profit improvement to 6.6 billion.Commercial revenuepassenger miles growthaccelerates to 7.6%PwCAerospace and defense4
The top 100 A&D companies (see Appendix A), by revenue,reported 728 billion in revenue and 77 billion in operatingprofit in 2017. Operating margin improved by 130 basis pointsto 10.6%. Industry operating margin has reached doubledigits only once before in 2014. The improvement in operatingprofit and operating margin were broad based. There were 13companies with profit fluctuations greater than 400 million(see Figure 2).Figure 1: Key industry metrics (US billions)RevenueOperating profitOperating margin20172016Change 728 7044% 77 6518%10.6%9.3%130 bpsSource: PwC analysisFigure 2: Profit fluctuations 400 millionBoeing(millions) 4,444Rolls-Royce 1,680Airbus 1,359Cobham 1,186Triumph 1,148GE Aviation 527Safran 485Bombardier 454General Dynamics 443CSRA 435Mitsubishi- 951Korea Aerospace Industries- 455BAE Systems- 448Source: PwC analysisPwCAerospace and defense5
One trend we have been watching for several years is a shiftin operating margin. The top quartile now reports operatingmargin on par or better than the industry average, duemostly to significant improvements at Boeing and Airbus, theindustry’s two largest companies. Boeing’s operating margin isnow 11%, slightly better than the industry average, while Airbusis less than half of that, at 5.1%, which included a non-recurringcharge for A400M. Only the third quartile reported a decreasein operating profit and operating margin, which was mostlyattributable to Korea Aerospace Industries’ performance. Theimprovement in the top quartile profitability was significantlyinfluenced by Boeing’s performance. Profit improvementin the second quartile was primarily due to the absence ofrestructuring charges at Triumph Group ( 1.1 billion profitimprovement) and Cobham ( 1.2 billion profit improvement).Figure 3: Key metrics by eTop quartile3.0%17.3%10.9% 140 bpsSecond quartile5.8%55.3%9.2% 290 bpsThird quartile3.9%-6.2%11.2%-120 bpsFourth quartile3.5%10.6%8.1% 50 bpsSource: PwC analysisProspects continue to be bright for commercial aerospace.Growth in revenue passenger miles accelerated to 7.6% in 2017(see Figure 11), more than twice global GDP growth. And that’son top of the two preceding years above 6% growth and greaterthan 5% growth since the Great Recession of 2008-2009. Thisgrowth is driving demand for new equipment and aftermarket inthe near and long term. Also, new aircraft deliveries increased3%, and the industry set a new record of 1,481 large aircraftdeliveries in 2017 (see Figure 10), 45 more than 2016 and a45% increase since 2011, and further production increases areplanned for narrowbodies. Book-to-bill was back above 1:1 in2017, after a modest dip in 2016, which resulted in new recordbacklog in excess of 13,000 aircraft and approximately nineyears of production at current rates.PwCAerospace and defense6
The defense industry reported accelerating revenue growthin 2017. In March 2018, President Trump signed the omnibusspending bill, which sets the Department of Defense (DoD)budget at 700 billion, about a 20% increase in two years.Therefore, we expect continued acceleration of revenue andprofit in 2018.During 2017 and into early 2018 the global threatenvironment continued to evolve. Coalition forces havesubstantially defeated ISIS. And while terrorist threats arelikely to persist, the Pentagon is pivoting toward Russia,China, North Korea and Iran, particularly North Korea’sescalating nuclear missile program, causing the US to bolsterits presence in the region. Furthermore, China’s militarymodernization is continuing to cause tension, particularlyin the South China Sea. All these events underscore thecomplex and dynamic global security environment, whichcould cause rapid changes in US defense priorities.There were few changes to the top 100 list in 2017. BWXTand VSE were added to the list and B/E Aerospace andDigital Globe were deleted. There were, however, somesignificant deal announcements, which are pending or haveclosed in 2018, including UTC’s acquisition of RockwellCollins and Northrop Grumman’s acquisition of Orbital ATK.Figure 4: Top 100 additions and deletionsAdded to the listBWXT#71 Spinoff from Babcock and WilcoxVSE Corporation#92 Acquisitions and organic growthDeleted from the listB/E AerospaceAcquired by Rockwell CollinsDigital GlobeAcquired by Maxar TechnologiesSource: PwC analysisPwCAerospace and defense7
PwCAerospace and defense8
Figure 5: Analysis highlightsLargest increase in revenue (dollars)Lockheed Martin 3,800mLargest increase in revenue(percentage)Leidos 44%Largest increase in profit (dollars)Boeing 4,444mLargest increase in profit (percentage)Rolls-RoyceHighest operating marginTransDigmLargest increase in top 100 listSercoLargest decrease in revenue (dollars)BoeingLargest decrease in revenue(percentage)Korea AerospaceIndustriesLargest decrease in profit (dollars)BAE SystemsLargest decrease in profit (percentage)HAECOLargest decrease in top 100 listKorea AerospaceIndustries 2827%42.2% 12- 1,179m-31%- 448m-648%-17Source: PwC analysisRevenueBoeing was again the industry’s largest company in 2017. Itreported 95 billion in revenue, which reflects a 2% decreasedriven partly by defense revenues and lower commercialaircraft revenues due to mix of aircraft. Airbus reported flatrevenue of 66.8 billion compared with 66.7 billion in theprior year, which resulted in a 2% increase in US dollars dueto currency fluctuation. Lockheed Martin reported the largestrevenue growth, for consecutive years, of 3.8 billion. Leidosreported the largest percentage growth in revenue, 44%, as aresult of its acquisition of Lockheed Martin’s IS&GS business.PwCAerospace and defense9
Profitability Boeing regained most profitable status in 2017, with 10.3billion in operating profit, the first time any company in theindustry has achieved the 10 billion mark. Boeing also reported the largest increase in profit of 4.4billion, achieved mostly in its commercial aircraft segment. BAE Systems reported the largest decline in profit of 448 million.Operating marginIndustry operating margin improved 130 basis points to 10.6%(see Figure 1), a record double-digit growth only previouslyachieved in 2014. Transdigm had the industry’s best operatingmargin at 42.2%, while GE Aviation improved 100 basis pointsto an operating margin of 24.3%, after achieving 20% for thefirst time in 2014.Figure 6: Companies with operating margin 20%GE AviationHoneywell AerospaceTransdigmSESHeicoAselsanCrane Aerospace & ElectronicsTop 100 rank #Operating 3.2%Source: PwC analysisPwCAerospace and defense 10
Total shareholder returnsThe A&D industry delivered strong total shareholder returns(TSR) – defined as the annualized change in share value dividends / buybacks – of 39.9% in 2017. These returnsoutperformed the S&P 500 TSR of 21.8% in 2017, continuingthe sector’s outperformance over the last five years withthe A&D index delivering 24.7% vs. the S&P 500’s 15.8%.Within the A&D index, the performance was led by the A&Dairframers, which have delivered a 1 Year TSR of 88.4%,followed by the A&D primes’ 43.3% and suppliers’ 31.9%.Figure 7: A&D industry vs. S&P 500 total shareholder returns (2012–2017)350%A&D peers300%250%S&P Dec-17Source: S&P Global Market Intelligence, Capital IQ; PwC Leadership Information ConsoleFigure 8: A&D historical total shareholder returnsIndex1 year TSR5 year TSRA&D airframers88.4%30.7%A&D prime43.3%26.3%A&D index39.9%24.7%A&D suppliers31.9%18.4%S&P 50021.8%15.8%Source: S&P Global Market Intelligence, Capital IQ; PwC leadership information consolePwCAerospace and defense 11
Shareholder returns are a factor of operating performance,and the market’s reaction to this operating performancein terms of future expectations and capital distribution(dividends and buy backs). Over the past year the overallA&D index TSR have been driven by an increase in marketexpectations of 16.5%, followed by capital distributionof 11.9% and profit growth of 11.5%. This increasedmarket expectations for the 2017 TSR is true for each ofthe A&D segments, with the exception of A&D airframers,whose strong performance was driven by Boeing’s overalloutstanding year.Figure 9: 1 Year total shareholder return disaggregationTSR impact ofprofit growthTSR impactof changein marketexpectationsTSR impactof capitaldistributionTSR(2015–2016)A&D airframers47.6%16.2%24.7%88.4%A&D prime13.6%16.9%12.8%43.3%A&D index11.5%16.5%11.9%39.9%A&D suppliers5.8%16.4%9.7%31.9%S&P 5008.0%5.4%8.4%21.8%IndexSource: S&P Global Market Intelligence, Capital IQ; PwC leadership information consoleThe A&D index TSR driven by market expectations was16.5%, roughly 11.1% higher than the S&P 500’s marketexpectations of 5.4%. This is consistent with capitaldistributions as the A&D index TSR driven by capitaldistributions was 11.9% vs. 8.4% for the S&P 500. Highermarket expectations imply that investors anticipate A&D’sfuture performance to exceed its historical performancefaster than the market. This will likely increase pressure onmanagement to deliver improved operating performancein 2018 and beyond in order to maintain and increase itsvaluation. At the same time, high levels of capital distributionas a driver of TSR means that management will likely need tosustain this growth while still instituting a disciplined capitalallocation process that returns excess cash to shareholdersin the form of dividends or buybacks. A reduction in currentlevels of dividend and distributions could have a negativeimpact on TSRs going forward.PwCAerospace and defense 12
2018 forecastCommercial aviation manufacturers (OEMs) and the defense sector are expected toreport continued strong revenue improvement in 2018, with projected increases in aircraftdeliveries, aircraft aftermarket and substantial increases in defense spending. The industryis also expected to show modest continued improvement in operating margin. It isdifficult to predict any future impairment or restructuring charges. In the absence of suchcharges, operating margin should remain above 10%. Accordingly, we expect continuedimprovement and a record year for revenue and operating profit in 2018.PwCAerospace and defense 13
Commercial aerospace2017 reviewRecord deliveriesand unit backlogBoeing delivered 763 aircraft in 2017, beating its previousrecord, set in 2015, by one aircraft. Airbus delivered 718aircraft in 2017, an increase of 30 over the prior year,marking its 15th consecutive year of record production. Totaldeliveries of 1,481 set another industry record for output.Airbus reported 1,109 net orders and won the sales racewith Boeing for a fifth consecutive year. Industry net orderswere 2,021, 540 more than deliveries, such that unit backlogset a new record of 13,129. The backlog represents aboutseven years of production for Boeing and about 10 years ofproduction for Airbus, at current production rates.Figure 10: Aircraft backlog (US billions)12/31/1712/31/1612/31/1512/31/14Boeing 421 473 432 440Airbus* 1,071 1,060 1,001 919Sources: The Boeing Company 2017 annual report, Airbus Group 2017 annual report*at list priceFigure 11: Aircraft backlog (units)BoeingAirbusTotal5,7156,87412,589Net 13,129Backlog on Dec. 31, 2016Backlog on Dec. 31, 2017Sources: The Boeing Company 2017 annual report, Airbus Group 2017 annual report.PwCAerospace and defense 14
For 2017, the International Air Transportation Association(IATA) reported revenue passenger miles growth of 7.6%,the third consecutive
08.06.2018 · Largest increase in top 100 list Serco 12 Largest decrease in revenue (dollars) Boeing - 1,179m Largest decrease in revenue (percentage) Korea Aerospace Industries-31% Largest decrease in profit (dollars) BAE Systems - 448m Largest decrease in profit (percentage) HAECO -648% Largest decrease in top 100 list Korea Aerospace Industries-17