Transcription
HindawiInternational Journal of Forestry ResearchVolume 2018, Article ID 6583948, 11 pageshttps://doi.org/10.1155/2018/6583948Research ArticleHeight-Diameter Modeling of Cinnamomum tamala Grown inNatural Forest in Mid-Hill of NepalMukti Ram Subedi ,1 Bishwa Nath Oli,2 Surendra Shrestha,3 and Sophan Chhin11Forest Resources Management Program, Division of Forestry and Natural Resources, West Virginia University,Morgantown, WV, USA2Ministry of Forests and Environment, Kathmandu, Nepal3Graduate School of Geography, Clark University, Worcester, MA, USACorrespondence should be addressed to Mukti Ram Subedi; mrs0070@mix.wvu.eduReceived 14 May 2018; Revised 9 September 2018; Accepted 10 October 2018; Published 28 November 2018Academic Editor: Scott D. RobertsCopyright 2018 Mukti Ram Subedi et al. This is an open access article distributed under the Creative Commons AttributionLicense, which permits unrestricted use, distribution, and reproduction in any medium, provided the original work is properlycited.Tree height (H) and diameter at breast height (D) are key variables to calculate tree volume and biomass. We developed a heightdiameter (H-D) model for Cinnamomum tamala by evaluating 18 nonlinear models. Akaike Information Criterion (AIC), BayesianInformation Criterion (BIC), Root Mean Square Error (RMSE), mean bias, Mean Absolute Error (MAE), graphical appearance,and biological logic were the criteria used to evaluate the predictive performance of the models. Gompertz model (M14) performedthe best for predicting the total height of C. tamala trees with the least RMSE (1.742 m), mean bias (0.012 m), and MAE (1.342 m)and satisfied model assumptions and biological logic. Validation data ranked the Gompertz model as the best model with RMSE(1.546 m), mean bias (-0.106 m), and MAE (1.149 m). Despite the consistent performance of the Gompertz model, it tended tounderestimate the height prediction for taller (dominant crown class) and larger trees. Further work on refitting and validation ofthe proposed model with data from a larger geographic area, wider-ranging sites, and stand conditions is recommended.1. IntroductionTree height (H) and diameter at breast height (D) arefundamental variables in most forest inventories which arerequired to calculate tree volume, biomass, carbon storage,and survival analysis [1–4]. Accurate in situ measurement ofD is easy and cost-effective. However, height measurementis labor-intensive, time-consuming, expensive, and proneto observational and measurement errors [5, 6]. Predictingforest dynamics through growth and yield simulation alsorequires individual tree level information, such as H and D.A height-diameter (H-D) relationship model can be easilybuilt when both H and D variables are measured. The modelthen can be used to estimate missing tree height, biomassproduction, and stand dynamics.The allometric equation [7] serves as a tool to relateeasily measurable morphometric variables (e.g., D) to thetotal height of the tree. Conventionally, H-D relationshipmodels have been developed and applied to pure even-agedstands or plantations using D as a predictor variable [1, 2].Recent studies employ other stand attributes (e.g., site quality,stand age, stand density, and dominant height) in mixedeffect H-D relationship models [8–13]. In mixed effects H-Drelationship models, population-averaged (fixed parameterscommon to population), as well as subject-specific effects asrandom effects, are allowed. Mixed-effect H-D relationshipmodels improve accuracy over nonlinear models that arebased on the minimization of sums of squares.Generally, the site-specific H-D relationship models thatare developed as H-D relationship can vary with differencesin age, site quality, competition, stand age, and silviculturaltreatment applied [14–17]. Although stand specific H-Drelationship models are labor-intensive, costly, and timeintensive, these models have been proved to be more accuratein the realistic description of forest structure, growth simulations, and plot-level volume [18]. Due to a limited geographical range of natural C. tamala stands, cross-sectionalnature of data, and for simplicity of model use, we employed
2ordinary nonlinear least square equations. The model developed should be considered as a site-specific model as it wasbuilt considering fewer stands.Cinnamomum tamala T Nees and Eberm (family Lauraceae) is a moderate-sized, evergreen, monoecious treespecies distributed at 900–2000 m above sea level in thetropical and subtropical Himalayas [19]. Natural stands ofC. tamala, being a moderate shade-tolerant species [20], aremostly found in shady-moist sites and grow well under fullillumination. C. tamala is native to Nepal, China, India,and Bhutan [21]. C. tamala trees are extensively managed,in situ and ex situ, for leaf and bark production due todwindling natural population and high economic potentials[22]. The bark is traded to India [19] and is often used as asubstitute for Cinnamomum zeylanicum [23]. Department offorests, Nepal [24], has prioritized C. tamala for research andmanagement because C. tamala bark forms a significant partof national nontimber forest product trade, by both volumeand economic value.Despite receiving a priority for research and managementin Nepal and conservation in India, studies on C. tamalaforests are limited. Since bark is a highly traded product,H-D relationship model is an essential decision-makingtool both for management institutions and government forestimating forest volume and above-ground biomass, growthand yield modeling, and modeling ecophysiological processbased models of forests. However, research in this directionis limited within the distribution range of C. tamala andhas mostly focused on conservation, ethnopharmacologicalproperties, dispersion pattern, cultivation, and harvestingpractices [25–29]. In Nepal, Tree Improvement and Silviculture Component, TISC [30], and Poudel et al. [31] developedbark biomass production models in farm-grown trees andnatural forests [32]. Equations for the H-D relationshipfor Cinnamomum tamala grown in the natural forest havenot been reported in past studies. Tree height increasesnonlinearly with stem diameter [33, 34]. Therefore, linearmodels are inadequate for predicting tree height [35]. In thispaper, we evaluated 18 nonlinear models to develop the HD relationship model for C. tamala trees. To the best of ourknowledge, this is probably the first attempt to establish anH-D relationship model for natural C. tamala forests. Ourmodel would be beneficial to researchers, managers, andacademicians within the distributional range of C. tamala.However, precaution should be used for accurate predictionof height outside the size and height ranges, site, and standcondition that differs from our study.2. Materials and Methods2.1. Study Area. The study was conducted at Mijure DandaVillage Development Committee (VDC) of Kaski district,Nepal, which extends from 28 13 57 to 28 20 57 N latitudeand 84 08 53 to 84 12 42 E longitude. The forest in thestudy area is managed by the Sikles unit of AnnapurnaConservation Area Project (ACAP) and constitutes C. tamalaas a dominant species having contiguous distribution patternand with an Important Value Index (IVI) of 158.0 [27].International Journal of Forestry ResearchAn IVI value was calculated by summing relative density,relative frequency, and relative dominance. The most frequentcommon associate species, with their IVI values, are Schimawallichii (77.89), Castanopsis indica (26.35, Madhuca latifolia(5.29), and Macaranga postulata (4.30) [27]. The study sitefalls under the humid subtropical monsoon climatic zonewith hot and wet summers and relatively cold winters.The average monthly climate normal (1981-2010) temperature (minimum, maximum) to the nearest weather stationwas 21.1 C (13.4 C, 26.1 C) and precipitation was 325 mm(17.8 mm, 940.3 mm). Average annual precipitation was about3900 mm year 1 [47].2.2. Data Collection and Processing. We collected the datathrough the inventory of natural stands of C. tamala, whichincludes 30 destructively sampled trees covering a widerrange of H and D. Trees were selected for felling coveringall the site conditions and tree size (H and D) distributionsacross the study sites in and outside of sampling plots.Nondestructive sample data came from a phytosociologicalsurvey of same forests [27]. We used systematic samplingplots with a size of 10 m 10 m. Each plot has 5 m 5 msubplots at northeast and southwest corners and 1 m 1 msubplots at four corners. Information on species such as Hand D were collected from 10 m 10 m and 5 m 5 m plots.The combined dataset size (n 179) is smaller comparedto other studies (e.g., [12, 13, 18, 48, 49]), but it can beused to construct H-D relationship models [50–52]. Thecombined dataset was split randomly into fitting (80%) andvalidation (20%) using R [53]. Summary statistics for H andD for both fitting and validation dataset are presented inTable 1.2.3. Model Development and Evaluation. Initially, we selected18 candidate nonlinear H-D relationship models (11 biparametric, and seven triparametric) based on a literature review(Table SA) to fit the model. We assumed that the total treeheight is a function of diameter. In the later stage, we includedonly the models with all significant parameter estimates at5% level of significance for further evaluation to comparetheir performance (Table 2). These models take the followingfunctional form:Hi 1.3 f (Di , b) 𝜀i(1)where Hi is the ith observation of the dependent variabletree height (m), Di is the ith observation of the independentvariable diameter at breast height (cm), b is the vector ofparameter to be estimated, 𝜀i is the random error term, f (.)is a nonlinear function, and i is the ith observation with i 1, 2, 3, . . ., n. A constant term 1.3 is the height of stem aboveground at which D was measured. We added this term in thefunction to avoid prediction of zero H when D approacheszero.The nonlinear function “nls2”, an improved version ofthe function nls, in statistical software R [54, 55] was usedto estimate model parameters using the ordinary least squaremethod. There are several criteria to assess model performance [56]. We evaluated model performance based on
International Journal of Forestry Research3Table 1: Descriptive statistics of the variables for both fitting and validation dataset.Fitting (n 143)Diameter (cm)Height imumMeanMaximumStandard DeviationValidation (n 36)Diameter (cm)Height (m)2.002.4011.147.0930.0013.587.473.15Table 2: Models selected for further evaluation, their designation, and parameters of the models.Model𝐻𝑖 1.3 𝑏0 𝐷𝑏1 𝜀𝑖𝑏2𝐻𝑖 1.3 𝑏0 [1 exp( 𝑏1 𝐷 ) ] 𝜀𝑖( 𝑏1 𝐷 ) 𝑏2] 𝜀𝑖𝐻𝑖 1.3 𝑏0 [1 exp𝐷 𝜀𝑖𝐻𝑖 1.3 (𝑏0 𝑏1 𝐷)𝐻𝑖 1.3 exp (𝑏0 𝐷𝑏1 ) 𝜀𝑖 𝑏𝐻𝑖 1.3 𝑏0 exp ( 1 ) 𝜀𝑖𝐷𝑏1𝐷] 𝜀𝑖𝐻𝑖 1.3 [(1 𝑏0 𝐷)𝑏0 𝐷 𝜀𝑖𝐻𝑖 1.3 (1 𝐷) (𝑏1 𝐷)3𝐷] 𝜀𝑖𝐻𝑖 1.3 [(𝑏0 𝑏1 𝐷)𝑏0𝐻𝑖 1.3 𝜀𝑖(1 1/ (𝑏1 𝐷𝑏2 ))2𝐷 𝜀𝑖𝐻𝑖 1.3 2(𝑏0 𝑏1 𝐷)𝑏0 𝐷𝐻𝑖 1.3 𝜀𝑖(𝑏1 𝐷)𝑏0𝐻𝑖 1.3 𝜀𝑖1 𝑏1 exp (𝐷𝑏2 )𝐻𝑖 1.3 𝑏0 exp( 𝑏1 exp 𝑏2 𝐷) 𝜀𝑖2𝐻𝑖 1.3 𝑏0 exp( 𝑏1 𝐷 ) M33[36]M42[37]M52[38]M62[39]M72[1, 2]M82[40]M92[41] cited in [13]M103[42]M112[43]M122[40, 44]M133[45]M143[46]M152[2]Hi is total height (m) of tree i 1, 2, 3,. . .,n, D-diameter at breast height (cm), b0 , b1 , and b2 are parameters to be estimated, 1.3 is added to avoid prediction ofzero height when D approaches zero, and 𝜀i is a random error term which is assumed to be normally and identically distributed with mean 0 and variance 𝜎2[NID (0, 𝜎2 )].numeric analysis of the following: (1) asymptotic t-statisticsof parameters, (2) Root Mean Square Error (RMSE: see (2)),also known as a measure of model’s precision, (3) meanbias (see (3)), and Mean Absolute Error (MAE: see (4)),and (4) information criteria—Akaike Information Criteria(AIC: see (5)) [56, 57] and Bayesian Information Criteria [58](BIC: see (6)), followed by graphical presentation such ashistogram, probability plots of residuals, and observed versusmodel predicted values. Criteria RMSE, AIC, BIC, Meanbias, and MAE are collectively called performance criteria.A coefficient of determination is not advisable to employfor assessing nonlinear regression. A statistic analogous tothe coefficient of determination also called a fit index ormodeling efficiency [14, 59] could be used. However, in thisstudy, we did not use the fit index to evaluate our models asa fit index also suffers all the weaknesses of the coefficient ofdetermination [14].RMSE n12 (yi ̂yi )n p 1 i 1 ni 1 (yi ̂yi )n n y ŷi MAE i 1 inMean bias (2)(3)(4)AIC n ln (RSS) 2kn(5)BIC n ln (RSS) ln (n) kn(6)
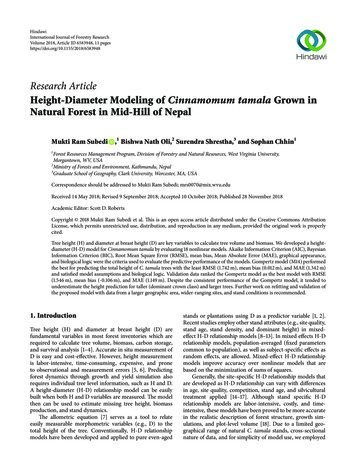
4where yi , ̂yi are the observed and predicted values of height,respectively; n is the total number of observations used inmodel fitting; ln is natural logarithm; RSS is the residual sumsof squares; and k is the number of parameters in the model.Models with least RMSE, AIC, BIC, mean bias, and MAEare considered to perform the best [60]. Reliability andvalidity of the model increase with its performance outsidethe test data [61–63]. However, due to limitation of dataset,model validation with an independent dataset covering moreextensive geographical regions and management conditionacross the distributional ranges of species can be a potentialtopic for future research.We evaluated models based on the significance of modelparameters, performance criteria, and practical application.After initial performance screening, models were subjectedto further comparison by ranking the performance criteriaand considering the practical application of the model. Themodels with the least value of performance criteria (RMSE,AIC, BIC, mean bias, and MAE) received the highest rankingand vice versa. The rank value of each criterion was addedto get the total sum of ranking, which was then ranked inascending order—the lower the value, the better the model.The model with the smallest rank value was considered thebest H-D relationship model of C. tamala naturally grown inmid-hill of Nepal.3. Results3.1. Descriptive Statistics and Parameter Estimates. Modelparameters were estimated using nonlinear least squarestechniques for the model fitting dataset. Descriptive statisticsincludes mean st.dev (minimum, maximum) for bothdiameter and height [D (cm): 13.26 7.72 (1.0, 32.0) andH (m): 8.07 3.26 (2.1, 14.2)] for fitting dataset; and [D(cm): 11.14 7.47 (2, 30) and H (m): 8.07 3.15 (2.4, 13.58)for validation dataset]. All models were evaluated againstmultiple model performance criteria. Almost all (15) models(Table 3) showed significant parameter estimates (p 0.05,unless otherwise mentioned) and were considered for furtherevaluation.3.2. Model Performance and Selection. Parameter estimatesof models indicate that the best model cannot be determined solely based on significant t-statistics. We additionallyconsidered performance criteria values to assess the model’sperformance. Table 4 presents the parameter estimates and fitstatistics associated with the selected models for fitting andvalidation dataset.Among 15 models, M14 produced the least bias (0.012 m),followed by M1 (0.016 m). The values of RMSE ranged from1.742 m (M14) to 2.42 m (M15). M14 yielded the least MAE(1.342 m) and AIC (568.541), while M15 produced the highestAIC (661.457) and BIC (670.346). M14 performed significantly better than other models, produced similar parameterestimates for validation dataset (Table 6), and similar fitstatistics for fitting and validation dataset (Table 4).We ranked models based on values of performancecriteria and calculated average rank on sum ranks of performance criteria. M14 performed the best (rank 1) forInternational Journal of Forestry Researchthe fitting dataset, while M14, M12, and M4 performed thebest with equal rank (rank 1) for the validation dataset(Table 5). Although M14, M12, and M4 have identical rank forvalidation dataset, we considered M14 the best model becauseit performed the best (rank 1) for fitting dataset too, whileM4 and M12 were the third best models for fitting dataset.Parameter estimates of M4 and M12 for validation dataset(Table SB), graph of the model, and residual distribution(Figures SA and SB) confirm that the models M4 and M12 arethe best alternatives to model M14. Interestingly, M12 an M4yielded strikingly similar performance statistics (identical tothe three-decimal place) for model fitting, validation, andcombined dataset (Tables 4 and SB).3.3. Residual Analysis and Shapiro-Wilk Test. To come upwith the best model, we used test for residual normality.Residuals graphs (histograms, probability plots) and plotof fitted line overlaid on the observed heights data wereproduced for a visual check. Figure 1 presents the plot ofresiduals against the observed diameters of fitting data. Mostof the models showed no systematic departure from randompattern.The Shapiro-Wilk test of residuals of the best three models[M14- (W 0.990, p 0.4143) for fitting and (W 0.978,p 0.6858) for validation; M12- (W 0.984, p 0.627)for fitting and (W 0.984, p 0.871) for validation; M4(W 0.984, p 0.627) for fitting and (W 0.984, p 0.871)] showed a p value greater than 0.05, which suggests thatresiduals do not violate the assumption of normal randomerror. Figure 2 shows curves of the best fitting model M14 forfitting and validation dataset and histogram of residuals witha superimposed normal curve. Normally, the model tendedto overestimate for shorter trees with larger diameter size.3.4. Paired t-Tests. The paired t-test of M14 with observedheight values revealed insignificant statistics [t (142) 0.084,p 0.933]. Similarly, the paired t-test of observed heightvalues with predicted heights of M12 [t (142) 0.1734, p 0.8625] and M4 [t (142) 0.1368, p 0.8914] for fittingdataset also resulted in statistically insignificant statistics.To determine the better model between M12 and M4, wecompared the predicted height from both models betweenthem and with the predicted height from the best model, i.e.,M14. Our results of paired t-test to compare the predictedheights showed significant statistics between M4 and M12 [t(142) 3.1143, p 0.002] and between M12 and M14 [t (142) -2.8968, p 0.0044]. The M4 showed no significant differencein mean predicted heights from the M14 [t (142) -0.8743,p 0.3983]. This suggests that the M14 has more accurateprediction power followed by M4.4. DiscussionAlmost all the candidate models performed well in explainingH-D relationship for C. tamala trees grown under naturalforest. Model selection based on multiple criteria suggestedthat M14, M12, and M4 were more effective in predictingC. tamala tree height compared to other candidate models.
International Journal of Forestry Research5Table 3: Parameter estimates of the selected 0.001The Gompertz model (M14) demonstrated competitive performance statistics for both fitting and validation dataset.Although Gompertz model follows growth theory ([8], NordLarsen and Cao 2006; Schmidt et al. 2011), it generallyunderestimates tree heights [10, 52]. Several studies haveused the Gompertz model to describe the height-diameterrelationship (Rupšys et al. 2011; Özçelik et al. 2013; [52, 64]).Zhang (1997) selected six models for evaluating H-D relationship and found that the Gompertz model underestimatestree heights for larger sizes trees (D 100 cm). Similarly, in ourcase, the Gompertz model tended to underestimate heights(10.84%) for taller trees with a larger diameter (H 12 m andD 17 cm). C. tamala trees from dominant crown categorygrow taller, larger, and faster. Trees under shade allocate morebiomass to diameter growth than height as height growthrequires more competitive advantage [65, 66]. This indicatesStd. 60615.923610.19977.076622.1983-11.628p-value 0.001 0.001 0.001 0.001 0.001 0.0010.0255 0.001 0.001 0.001 0.001 0.001 0.001 0.001 0.001 0.001 0.001 0.001 0.001 0.0010.0035 0.001 0.001 0.001 0.001 0.001 0.001 0.001 0.001 0.001 0.001 0.001 0.001 0.001 0.001that C. tamala H-D relationship at our study site mighthave been mediated by shade tolerance or crown dominancy.Studies have shown that shade tolerance and climate jointlyeffect on allometric variation [66–68]. However, assessing thepossible variation in C. tamala H-D relationship is beyond thescope of this study due to the small size of our dataset.H-D relationship models are often developed basedon sampling data from permanent sample plots that aremonitored for a relatively extended period [59, 64, 69, 70].Studies that employed longitudinal data along with otherplot-level covariates in nonlinear mixed H-D relationshipmodels show improved model performance compared toordinary nonlinear least square models [18, 52, 59, 71, 72].Although the inclusion of stand variables may improve theprediction power of the model, this often requires greatersampling efforts especially when data collection involves an
6International Journal of Forestry ResearchTable 4: Performance statistics of selected models for fitting and validation dataset.Performance 1.1851.2771.1791.1381.1491.743Table 5: Rank of selected models based on performance criteria for fitting and validation dataset.Performance CriteriaFitting ation 32115678312141351110931215invasive sampling approach. Our study did not include suchcovariates because of the cross-sectional nature of data thatwere collected from both inside and outside of sample plots.Future researchers can test the validity of our model andimprove the predictive performance utilizing stand and plotlevel covariates when available.Predictive performance of the models beyond theobserved range was not possible as the fitting dataset haslarger sizes and taller trees. Independent datasets fromdifferent geographical locations and management systemswith larger and taller trees than those used in this )45(15)could confirm the predictive power of the model [14].Motallebi and Kangur [73], using the annual height anddiameter increment data of 114 trees (observation periodsspanned from 40 to 115 years) from three European countries, indicated a variable allometric relationship (significantcoefficients across sites) between tree height and diameterwhich did not follow elasticity or geometric scaling rulesacross sites. H-D relationship varies among ecoregions due todifferences in bioclimatic conditions [48, 69, 74] and amongmanagement regimes [32]. Therefore, H-D relationship ofspecies should be evaluated across climatic and management
International Journal of Forestry Research7Table 6: Prediction statistics of the best model (M14) for validation dataset.DatasetValidation Datan 02Std. 3p-value0.00291 0.00010.01084RMSE1.439Model 1Model 2Model 3Model 4Model 5Model 6Model 7Model 8Model 9Model 10Model 11Model 12Model 13Model 14Model 15Mean Bias0.000850 5Residuals50 550 5010203001020300102030 0Diameter (cm)1020300102030Figure 1: Residuals analysis plots of 15 H-D relationship models fitted for Cinnamomum tamala.systems to understand the changes in the stem allometryof species. As C. tamala prefers moisture rich areas, waterstress could change the H-D relationship. Therefore, theinclusion of water availability in original H-D relationshipmodels and a mixed-effect modeling approach could further optimize the model’s performance. Since this study’sfitting and validation data came from same climatic andmanagement conditions, validation of these models withindependent data from different geographic, climatic, andmanagement practices could be a potential topic for futureresearch.5. ConclusionWe calibrated and tested 18 nonlinear models on Cinnamomum tamala trees grown under the natural multilayer treestructure in mid-hills of Nepal. The best model was selectedbased on multiple performance criteria, error diagnostics,growth theory, and practical application. Results showed thatthe Gompertz model (M14) best fitted the fitting dataset andperformed consistently on the validation dataset and can beused reliably in biomass estimation and management for C.tamala trees in the mid-hills of Nepal.
8International Journal of Forestry Research140.20120.15DensityHeight (m)1080.1060.0540.00610141822Diameter (cm)2630 2.5(a)0.0Residual2.5(b)140.20120.15DensityHeight (m)1080.1060.0540.00610141822Diameter (cm)2630 4 2(c)0Residual24(d)Figure 2: Scatter plot of total height (H) against D superimposed with M14 for fitting data (a) and validation data (c); a histogram of residualsof M14 for fitting data (b) and validation dataset (d).The existing studies on C. tamala height-diameter (HD) modeling are limited to even-aged stands or plantationand have not attempted to develop H-D relationship modelsunder natural forests. The methodology presented in thispaper utilizes ordinary nonlinear models to generate H-Drelationship in the uneven-aged natural forest of C. tamala.Since we considered diameter as the only predictor variable,caution should be applied while using our model to otherforests stands that differ in site and stand conditions to thebasis of this study. In future research, our model can beextended to other regions and management regimes (e.g.,the tree outside forestry), following updates through refittingand validation against independent data from the broadestpossible ranges of size, site, and stand conditions, includingstand and plot attributes across the distributional ranges ofC. tamala.Data AvailabilityThe data used in this paper came from phytosociologicalsurvey of Cinnamomum tamala forests (natural). Of the totaltrees used in the analysis, 30 trees were sampled destructivelywhich was previously used in bark biomass productionmodel. If required, raw dataset can be made available. Rcode used in the analysis is presented at the end of theSupplementary Materials.
International Journal of Forestry ResearchConflicts of InterestThe authors declare that they have no conflicts of interest.AcknowledgmentsWe want to thank The National Trust for Nature Conservation/Annapurna Conservation Area Project (NTNC/ACAP),for providing financial support to this study. This work wasalso supported by the United State Department of Agriculture(USDA), National Institute of Food and Agriculture (NIFA),McIntire Stennis Project # 1017946. We extend our thanksto Conservation Area Management Committee members ofMijure danda Village Development Committee. Thanks aredue to people who rendered assistance during field works,especially, Bishwa Kiran Giri, Hari Prasad Subedi, and RishiRanabhat.Supplementary MaterialsTable SA: selected 18 models. Table SB: parameter estimatesand fit statistics of M4 and M12. Figure SA: fitted model andhistogram for validation dataset of M4 and M12. Figure SB:fitted model and histogram for combined dataset of M4 andM12. R-Code used in the analysis. (Supplementary Materials)References[1] R. O. Curtis, “Height-diameter and height-diameter-age equations for second-growth douglas-fir,” Forest Science, vol. 13, pp.365–375, 1967.[2] S. Huang, D. Price, and S. J. Titus, “Development of ecoregionbased height-diameter models for white spruce in borealforests,” Forest Ecology and Management, vol. 129, no. 1-3, pp.125–141, 2000.[3] J. Chave, C. Andalo, S. Brown et al., “Tree allometry andimproved estimation of carbon stocks and balance in tropicalforests,” Oecologia, vol. 145, no. 1, pp. 87–99, 2005.[4] P. Saud, T. B. Lynch, and J. M. Guldin, “Twenty five yearslong survival analysis of an individual shortleaf pine trees,” inProceedings of the 18th biennial southern silvicultural researchconference, J. S. Callie, K. C. Wayne, and C. M. Oswalt, Eds., pp.555–557, 2016.[5] K. C. Colbert, D. R. Larsen, and J. R. Lootens, “Heightdiameter equations for thirteen midwestern bottomland hardwood species,” Northern Journal of App
ResearchArticle Height-Diameter Modeling of Cinnamomum tamala Grown in Natural Forest in Mid-Hill of Nepal