Transcription
7th Grade Texas Mathematics: Unpacked ContentWhat is the purpose of this document?To increase student achievement by ensuring educators understand specifically what the new standards mean a student must know,understand and be able to do. This document may also be used to facilitate discussion among teachers and curriculum staff and toencourage coherence in the sequence, pacing, and units of study for grade-level curricula. This document, along with on-goingprofessional development, is one of many resources used to understand and teach the new math standards.What is in the document?Descriptions of what each standard means a student will know, understand, and be able to do. The “unpacking” of the standards donein this document is an effort to answer a simple question “What does this standard mean that a student must know and be able to do?”and to ensure the description is helpful, specific and comprehensive for educators.
At A Glance:New to 7th Grade: Visual representation to describe relationships between sets of rational numbersSolve problems using addition, subtraction, multiplication and division of rational numbers (8th grade)multiple representations of constant rates (8th grade)determine the constant of proportionality (Algebra I)solve problems with percent increase and decrease and financial literacy problems (8th grade)convert between measurement systems including the use of proportions and unit rates (8th grade)describe π as the ratio of the circumference of a circle to its diameter and determine area for circumference and area of a circle(6th grade)simulations for simple and compound events (8th grade)probability of simple event and its complement (6th grade)make inferences from sampling (8th grade)solve problems using data in bar graphs, dot plots and circle graphs (6th)solve problems using qualitative and quantitative predictionslinear relationships using verbal descriptions, tables, graphs, and equations: y mx b (8th grade)volume comparisons of prisms and pyramids (8th grade)lateral & total surface area of prisms and pyramids (8th grade)model, write, solve, graph inequalities (Algebra I)write and solve equations using geometry concepts, including the sum of angles in a trianglecompare and use data in random samples from populationsanalyze shapes, center, and spread of comparative dot plots and box plotsFinancial Literacy: income tax; personal budget; financial assets and liabilities; budgets; net worthMoved from 7th Grade: convert between frac/dec/percentssquares & square rootsmodel multiplying and dividing fractions & decimalscompare, order, model, solve integersorder of operations & exponentsarithmetic sequences
classify angles pairs , triangles, quadrilaterals, 3-D figurescoordinate planegraph reflections and translationssketch 3-D figures with different viewsdescribe and justify data using mean, median mode and rangeInstructional Implications for 2013-14: Sometime between 2013/14 6th gr current TEKS and 2014/15 7th gr new TEKS, students will need to have instruction onmultiplying and dividing fractions and decimals and all operations with integers Including inequalities as well as equations All probability instruction happens at 7th grade Measurements of circular 2-D figures are introduced in 7th grade (no longer 6th)Professional Learning Implications for 2013-14: Learning the new verbage and structure of TEKS (ex. Measurement strand isn’t formulas anymore, its data.)PD and resources regarding Personal Financial LiteracyPD related to the Data and Measurement strand, related to the new terminology and approach to data analysisTeachers will need to identify the gaps that will need to be addressed in the 2013-14 school year.Embed the process standards into instruction and applicationIdentify academic vocabularyInitial learning of the teachers’ grade level TEKS (teachers unpacking the TEKS at their grade level)Vertical study of the strands to know how the TEKS align and progress from 6th through 8th grade
Grade 7 Primary Focal Areas:The Primary Focal Areas are designed to bring focus to the standards at each grade by describing the big ideas that educators can useto build their curriculum and to guide instruction.The primary focal areas in Grade 7 are number and operations; proportionality; expressions, equations, and relationships; andmeasurement and data. Students use concepts, algorithms, and properties of rational numbers to explore mathematical relationshipsand to describe increasingly complex situations. Students use concepts of proportionality to explore, develop, and communicatemathematical relationships, including number, geometry and measurement, and statistics and probability. Students use algebraicthinking to describe how a change in one quantity in a relationship results in a change in the other. Students connect verbal, numeric,graphic, and symbolic representations of relationships, including equations and inequalities. Students use geometric properties andrelationships, as well as spatial reasoning, to model and analyze situations and solve problems. Students communicate informationabout geometric figures or situations by quantifying attributes, generalize procedures from measurement experiences, and use theprocedures to solve problems. Students use appropriate statistics, representations of data, and reasoning to draw conclusions,evaluate arguments, and make recommendations. While the use of all types of technology is important, the emphasis on algebrareadiness skills necessitates the implementation of graphing technology.Mathematical process standards. The student uses mathematical processes to acquire and demonstrate mathematicalunderstanding. The student is expected to:(A) apply mathematics to problems arising in everyday life, society, and the workplace;(B) use a problem-solving model that incorporates analyzing given information, formulating a plan or strategy, determining a solution,justifying the solution, and evaluating the problem-solving process and the reasonableness of the solution;(C) select tools, including real objects, manipulatives, paper and pencil, and technology as appropriate, and techniques, includingmental math, estimation, and number sense as appropriate, to solve problems;(D) communicate mathematical ideas, reasoning, and their implications using multiple representations, including symbols, diagrams,graphs, and language as appropriate;(E) create and use representations to organize, record, and communicate mathematical ideas;(F) analyze mathematical relationships to connect and communicate mathematical ideas; and(G) display, explain, and justify mathematical ideas and arguments using precise mathematical language in written or oralcommunication.
Number and Operations:TEKS: 7.2The student applies mathematical process standards to represent and userational numbers in a variety of forms. The student is expected to:7.2(A) Extend previous knowledge of sets andsubsets using a visual representation to describerelationships between sets of rational numbers.In 6th grade, students “classify” sets of numbers (whole, integers, and rational numbers). In7th grade, the verb changes to “describe relationships” between sets of rational numbers.Students need to have experiences using visual representations (such as a Venn diagrams)to classify number systemsExample1:How are integers and whole numbers alike? different?Example 2:Name all the sets to which each number belongs.,Misconceptions:1. Knowing only a limited number of models for interpreting fractions; for example, notrecognizing fractions as locations on a number line or as division calculations.2. Understanding the symbol “-“ as subtraction and as a negative.
Number and Operations:TEKS: 7.3The student applies mathematical process standards to add, subtract,multiply, and divide while solving problems and justifying solutions. Thestudent is expected to:7.3(A) Add, subtract, multiply, and divide rationalnumbers fluentlyExtend the fluent computation with positive rational numbers from 6th grade to 7th grade bynow including all rational numbers (includes negative). Apply rational number operations inproblem situations. Students will need to have a solid understanding of integer rules to beable to apply to rational numbers. While students need to be fluent in operations with bothpositive and negative rational numbers, the application problems will may tend to focus onpositive numbers for meaningful examples, such as change in temperature, stock marketloss and gains7.3(B) Apply and extend previous understandings ofoperations to solve problems using addition,subtraction, multiplication, and division of rationalnumbers.Example 1:A recipe that makes 1.5 dozen cookies requires 0.75 cups of sugar. Shanika wants to make6 dozen cookies. How many cups of sugar will she need?Example 2:Ocean water freezes at about 2 ½ degrees C. Fresh water freezes at 0 degrees C.Antifreeze, a liquid used to cool most car engines, freezes at 64 degrees C.Imagine that the temperature is exactly at the freezing point for ocean water. How manydegrees must the temperature drop for the antifreeze to turn to ice?Misconceptions:1. Students may believe that all rational numbers are positive.2. Students have trouble using models to illustrate operations or to connect operations onobjects to algorithms.Proportionality:TEKS: 7.4The student applies mathematical process standards to represent and solveproblems involving proportional relationships.7.4(A) Represent constant rates of change inmathematical and real-world problems givenpictorial, tabular, verbal, numeric, graphical,and algebraic representations, including d rtStudents’ understanding of the multiplicative reasoning used with proportions continues from 6thgrade. Students will need to learn the vocabulary related to these TEKS: direct variation, constantof proportionality (k), etc. Students understand that the constant of proportionality is the unit rate.Students identify this amount from pictorial, tabular, verbal, numeric, graphical, and algebraicexpressions. Students understand that the equation y kx is read “y varies directly as x”. Studentsunderstand that d rt is a proportional relationship and a specific example of y kx7.4(B) Calculate unit rates from rates in
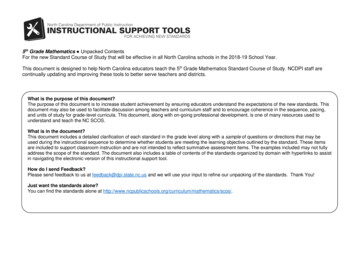
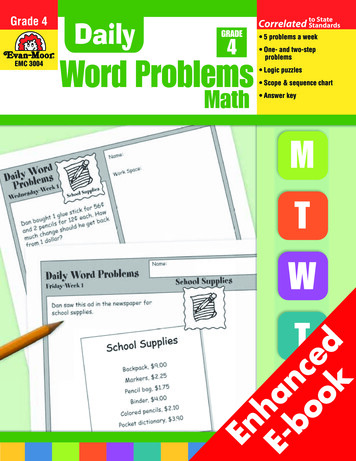
mathematical and real-world problems7.4(C) Determine the constant ofproportionality (k y/x) within mathematical andreal-world problemsExample 1:The graph below represents the price of the bananas at one store. What is the constant ofproportionality?From the graph, it can be determined that 4 pounds of bananas is 1; therefore, 1 pound ofbananas is 0.25, which is the constant of proportionality for the graph.Students need to know that any point on the graph will give them the constant of proportionality.K y/x denotes that K 0.25/1 or 1.00/4 or 1.50/6All will give 0.25 as the constant of proportionality; y 0.25xExample 2:The price of bananas at another store can be determined by the equation: P 0.35n, where P isthe price and n is the number of pounds of bananas. What is the constant of proportionality (unitrate)?Students need to be able to express this from words and equations. Constant of proportionality is0.35 given the equation.Example 3:The table below gives the price for different numbers of books. Do the numbers in the tablerepresent a proportional relationship?
Solution:Students can examine the numbers to determine that the prices is the number of books multipliesby 3, except for 7 books. The row with seven books for 18 is not proportional to the otheramounts in the tables; therefore, the table does NOT represent a proportional relationship.If students had graphed the data in the table, they would see that it does not form a straight line,indicating that it is not proportional. Would they have seen this graphing only the first 3 sets ofcoordinates? No – they needed to graph (7,18)There is no constant of proportionality since it is not proportional.These TEKS are a pre-requisite for Algebra I and lead students to solving direct variationequations.
Misconceptions:1. Sometimes students struggle with the conversion of words to symbols.7.4(D) Solve problems involving ratios, rates,and percents, including multi-step problemsinvolving percent increase and percentdecrease, and financial literacy problemsStudents apply their previous knowledge of ratio, rate, and percent (single-step) problems from6th grade to multi-step problems and financial literacy problems in 7th grade. Students need toknow multiple strategies for solving proportion problems, such as cross products, equivalentratios, unit rate, ratio tables, etc. Students should be able to explain or show their work using arepresentation (numbers, words, pictures, physical objects, or equations) and verify that theiranswer is reasonable. Students use models to identify the parts of the problem and how thevalues are related. For percent increase and decrease, students identify the starting value,determine the difference, and compare the difference in the two values to the starting value.Students understand the use of proportional relationships is also extended to solve percentproblems involving sales tax, markups and markdowns, simple interest (I prt, where I interest,p principal, r rate, and t time (in years)), gratuities and commissions, fees, percent increaseand decrease, and percent error.Multi-Step Ratio/Rate::- applying two unit rates within the same question (ie. mpg, mph)Multi-Step Percent::- finding the final cost after tax, tip, and/or discount- percent of change (increase and decrease)
- discount off of a discounted price- simple interest- find tax rate when given the final cost and cost of an item before tax- commission problems--finding commission, amount needed to sell to make a certain amountExample 1:A generator can run for 11 hours on 3 gallons of gasoline. If the gasoline costs 3 per gallon,which is closest to the cost per hour to run the generator?Example 2:A 24,000-gallon pool is being filled at a rate of 40 gallons per minute. At this rate,how manyminutes will it take to fill this pool ¾ full?Example 3:Jamal needs to purchase a countertop for his kitchen. Jamal measured the countertop as 5 ft.The actual measurement is 4.5 ft. What is Jamal’s percent error?Example 4:Games Unlimited buys video games for 10. The store increases their purchase price by 300%.What is the sales price of the video game?Using proportional reasoning, if 10 is 100% then what amount would be 300%? Since 300% is 3times 100%, 30 would be 10 times 3. Thirty dollars represents the amount of increase from 10so the new price of the video game would be 40.
Example 5:Gas prices are projected to increase by 124% by April 2015. A gallon of gas currently costs 3.80.What is the projected cost of a gallon of gas for April 2015?Possible response: “The original cost of a gallon of gas is 3.80. An increase of 100% means thatthe cost will double. Another 24% will need to be added to figure out the final projected cost of agallon of gas. Since 25% of 3.80 is about 0.95, the projected cost of a gallon of gas should bearound 8.15.” 3.80 3.80 (0.24 3.80) 2.24 x 3.80 8.15Example 6:A sweater is marked down 33% off the original price. The original price was 37.50. What is thesale price of the sweater before sales tax?The discount is 33% times 37.50. The sale price of the sweater is the original price minus thediscount or 67% of the original price of the sweater, or Sale Price 0.67 x Original Price.Example 7:A shirt is on sale for 40% off. The sale price is 12. What was the original price? What was theamount of the discount?
The sale price is 60% of the original price. This reasoning can be expressed as 12 0.60p.Dividing both sides by 0.60 gives an original price of 20.Example 8:At a certain store, 48 television sets were sold in April. The manager at the store wants toencourage the sales team to sell more TVs by giving all the sales team members a bonus if thenumber of TVs sold increases by 30% in May. How many TVs must the sales team sell in May toreceive the bonus? Justify the solution.The sales team members need to sell the 48 and an additional 30% of 48. 14.4 is exactly 30% sothe team would need to sell 15 more TVs than in April or 63 total (48 15)Example 9:A salesperson set a goal to earn 2,000 in May. He receives a base salary of 500 per month aswell as a 10% commission for all sales in that month. How much merchandise will he have to sellto meet his goal? 2,000 - 500 1,500 or the amount needed to be earned as commission. 10% of what amountwill equal 1,500.Because 100% is 10 times 10%, then the commission amount would be 10 times 1,500 or 15,000Example 10:After eating at a restaurant, Mr. Jackson’s bill before tax is 52.50 The sales tax rate is 8%. Mr.Jackson decides to leave a 20% tip for the waiter based on the pre-tax amount. How much is thetip Mr. Jackson leaves for the waiter? How much will the total bill be, including tax and tip?Express your solution as a multiple of the bill.
The amount paid 0.20 x 52.50 0.08 x 52.50 0.28 x 52.50 or 14.70 for the tip and tax.The total bill would be 67.20.Example 11:Stephanie paid 9.18 for a pair of earrings. This amount includes a tax of 8%. What was the costof the item before tax?One possible solution path follows: 9.18 represents 100% of the cost of the earrings 8% of the cost of the earrings. Thisrepresentation can be expressed as 1.08c 9.18, where c represents the cost of the earrings.Solving for c gives 8.50 for the cost of the earrings.Several problem situations have been represented with this standard; however, every possiblesituation cannot be addressed here.Example 12:Sally has a recipe that needs ¾ teaspoon of butter for every 2 cups of milk. If Sally increases theamount of milk to 3 cups of milk, how many teaspoons of butter are needed?Using these numbers to find the unit rate may not be the most efficient method. Students can setup the following proportionto show the relationship between butter and milk.One possible solution is to recognize that 2 1 ½ 3 so ¾ 1 ½ x. The amount of butterneeded would be 1 teaspoons.A second way to solve this proportion is to use cross-multiplication ¾ 3 2x. Solving for x wouldgive 1 teaspoons of butter.Misconceptions:1.Students believe all percents must be between 1 and 100%2. Students believe that a percent that has a decimal in it is already in decimal form (43.5% indecimal form is 43.5)3. In multiple discount problems, students want to combine the discounts instead of working themsequentially (such as 25% off then 10% off makes students want to use 35% instead of finding25% off and the 10% off).
7.4(E) Convert between measurementsystems, including the use of proportions andthe use of unit ratesStudents will extend previous knowledge of converting within measurement systems usingproportion/unit rate from 6th grade. Convert between customary and metric systems for length,mass, capacity, given the relationship between the two units. Determine the relationship/unit rateto convert between units, given a set of equivalent measures from different systems. A ratio canbe used to compare measures of two different types, such as inches per foot, milliliters per literand centimeters per inch. Students recognize that a conversion factor is a fraction equal to 1since the numerator and denominator describe the same quantity. For example, 12 inches/1 footis a conversion factor since the numerator and denominator equals the same amount. Since theratio is equivalent to 1, the identity property of multiplication allows an amount to be multiplied bythe ratio. Also, the value of the ratio can also be expressed as 1 foot / 12 inches allowing for theconversion ratios to be expressed in a format so that units will “cancel”.Students use ratios as conversion factors and the identity property for multiplication to convertratio units.Example 1:If 1 in 2.54 cm, how many inches is equal to 10 cm? How many cm is equal to 34 inches?How many centimeters are in 7 feet, given that 1 inch 2.54 cm.Misconceptions:1. Students might confuse how to organize the units in a proportion vs. in dimensional analysisProportionality:TEKS: 7.5The student applies mathematical process standards to use geometry to describeor solve problems involving proportional relationships. The student is expected to:7.5(A) Generalize the critical attributes ofsimilarity, including ratios within and betweensimilar shapesStudent’s understanding includes attention to the identification of common features (attributes),use of examples and non-examples, classifying or grouping items, naming or labeling the group,and using the concept in ongoing activities.Students will identify corresponding sides and corresponding congruent angles of similar figuresusing the traditional notation of curved lines for the angles. Students will write proportions toexpress the relationships between the lengths of corresponding sides of similar figures(relationships between sides of similar figures and within sides of similar figures).Including, but not limited to: Notation for similar figures aligning corresponding angles and sides:
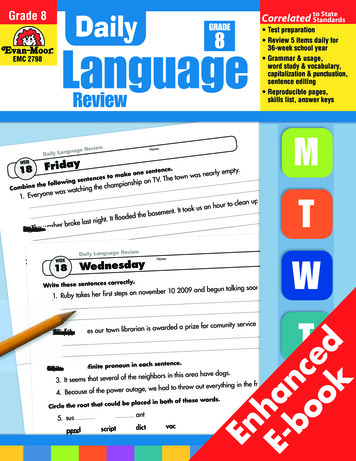
ΔABC ΔLMNCorresponding parts of similar figures (alignment as indicated in similarity statement) Corresponding angles are congruent: Corresponding sides are related proportionally: Likewise,Example Problem/ TasksExample 1:Which of the following statements is true for the following set of similar figures?ABCD
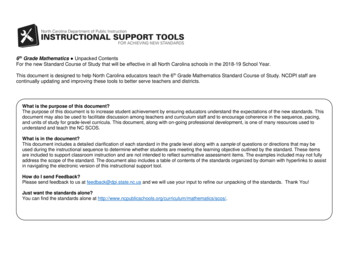
Example 2:Misconceptions:1. Students may believe that corresponding angles are also proportional in similar figures2. Over generalizing the phrase “same shape, different size”3. Students believe the scale factor has to be a whole number7.5(B) Describe as the ratio of thecircumference of a circle to its diameterThe student will derive an approximation for pi by gathering data and comparing thecircumference to the diameter of various circles, using concrete materials or computer models.Students may have to determine how to find the radius or diameter when given the circumference,based on the understanding of pi circ/diam. Students will also be able to leave answers as exact(with pi on the answer) rather than getting an approximation.Example:Given several circular items (jars, lids, coffee cans, plates, etc) and tape measures, students willmeasure and record the diameter and circumference of each item. Then they will divide thecircumference by the diameter to the nearest tenth to discover the relationship (pi).Misconceptions:1. Pi changes based on the size of the circle2. Students believe pi 3.14 (this is an approximation, not the true value)7.5(C) Solve mathematical and real-worldproblems involving similar shape and scaledrawingsStudents determine the dimensions of figures when given a scale. Students identify the scalefactor given two figures. Using a given scale drawing, students reproduce the drawing at adifferent scale. Students understand that the lengths will change by a factor equal to the productof the magnitude of the two size transformations.Example 1:Julie shows the scale drawing of her room below. If each 2 cm on the scale drawing equals 5 ft,what are the actual
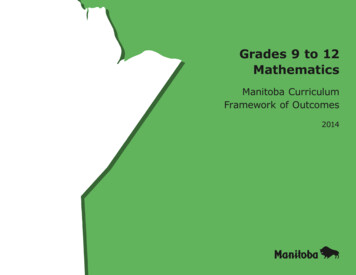
dimensions of Julie’s room? Reproduce the drawing at 3 or⅘ times its curreExample 2:If the rectangle below is enlarged using a scale factor of 1.5, what will be the perimeter and areaof the new rectangle?Solution:The perimeter is linear or one-dimensional. Multiply the perimeter of the given rectangle (18 in.)by the scale factor (1.5) to give an answer of 27 in. Students could also increase the length andwidth by the scale factor of 1.5 to get 10.5 in. for the length and 3 in. for the width. The perimetercould be found by adding 10.5 10.5 3 3 toget 27 in. The area is two-dimensional so the scale factor must be squared. The area of the newrectangle would be 14 x 1.52or 31.5 in2.Example 3:In Ponce de Leon Park there is a flagpole that is exactly 50 feet tall. Nearby there is a pine treethat appears to be nearly as tall as the flagpole. On a sunny afternoon the flagpole is casting a 15foot-long shadow on the ground. The pine tree is casting a 12-foot-long shadow on the ground atthe same time.
How much taller than the pine tree is the flagpole?MIsconceptions:1. Students believe the scale factor has to be a whole number2. Students look for the difference in lengths of corresponding sides, instead of the ratio. Theythink it is an additive relationship instead of a multiplicative.3. When solving for the missing length students use 3 and 8 rather than 3 and 11. See picturebelow.Proportionality:TEKS: 7.6The student applies mathematical process standards to use probability and statistics todescribe or solve problems involving proportional relationships. The student is expectedto:7.6(A) Represent sample spaces for simple and Students will recognize an appropriate design for conducting an experiment with simplecompound events using lists and tree diagrams probability events, understanding that the experimental data give realistic estimates of theprobability of an event but are affected by sample size. Students use tree diagrams, frequencytables, and organized lists, and simulations to determine the probability of simple and compoundevents.7.6(B) Select and use different simulations toExample 1: (7.6 I)represent simple and compound events withand without technologyJason is tossing a fair coin. He tosses the coin ten times and it lands on heads eight times. If
7.6(C) Make predictions and determinesolutions using experimental data for simpleand compound eventsJason tosses the coin an eleventh time, what is the probability that it will land on heads?7.6(D) Make predictions and determinesolutions using theoretical probability for simpleand compound eventsHow many ways could the 3 students, Amy, Brenda, and Carla, come in 1st, 2nd and 3rd place?Represent this information using a list and tree diagram.Example 2: (7.6 A)Example 3: (7.6 C)7.6(E) Find the probabilities of a simple eventand its complement and describe therelationship between the two7.6(F) Use data from a random sample tomake inferences about a population7.6(G) Solve problems using data representedin bar graphs, dot plots, and circle graphs,including part-to-whole and part-to-partcomparisons and equivalents7.6(H) Solve problems using qualitative andquantitative predictions and comparisons fromsimple experiments7.6(I) Determine experimental and theoreticalprobabilities related to simple and compoundevents using data and sample spacesConduct an experiment using a Styrofoam cup by tossing the cup and recording how it lands. How many trials were conducted? How many times did it land right side up? How many times did it land upside down/ How many times did it land on its side? Determine the probability for each of the above resultsSolution:Making an organized list will identify that there are 6 ways for the students to win a raceA, B, CA, C, BB, C, AB, A, CC, A, BC, B, AExample 4: (7.6 I)Students conduct a bag pull experiment. A bag contains 5 marbles. There is one red marble, twoblue marbles and two purple marbles. Students will draw one marble without replacement andthen draw another. What is the sample space for this situation? Explain how the sample spacewas determined and how it is used to find the probability of drawing one blue marble followed byanother blue marble.Example 5: (7.6 D)A fair coin will be tossed three times. What is the probability that two heads and one tail in anyorder will results?Solution:HHT, HTH and THH so the probability would be ⅜ .
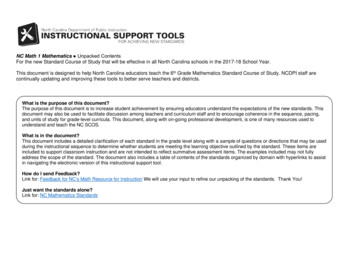
Misconceptions:1.Vocabulary related to probability is frequently used in the “real-world” but not necessarily in thetrue mathematical meanings, for example probability and odds are often used interchangeablyExpressions, equations, andrelationships:TEK: 7.7The student applies mathematical process standards to represent linearrelationships using multiple representations. The student is expected to:7.7(A) Represent linear relationships usingverbal descriptions, tables, graphs, andequations that simplify to the form y mx bExtend and apply their understanding of independent and dependent quantities (from new6.6A&B). Simplify algebraic expressions and equations by combining like terms. Substitutevalues and evaluate algebraic equations. Identify the rate of change from a table, graph, equation,or verbal description. Given one representation, students need to be able to create any of theothers. Make connections between representations of the same linear relationshipExample 1:
Example 2:Use the given information to fill in the missing information.Mason pays 2.00 per hour to use a computer and an additional charge of 2.50Misconceptions:1. A common error is to reverse the position of the variables when writing equations. Studentsmay find it useful to use variables specifically related to the quantities rather than using x and y.Constructing verbal models can also be helpful. A student might describe the situation as “thenumber of packs of gum times the cost for each pack is the total cost in dollars”. They can usethis verbal model to construct the equation. Students can check their equation by substitutingvalues and comparing their results to the table. The checking process helps student revise andrecheck their model as necessary. The number of packs of gum times the cost for each pack isthe total cost. (g x 2 d) students assume that all situations go through the origin.Expressions, equations, andrelationships:TEK: 7.87.8 The student applies mathematical process standards to develop geometricrelationships with volume. The student is expected to:7.8(A) Model the relationship between thevolume of a rectangular prism and arectangular pyramid having both congruentbases and heights and connect thatr
7th Grade Texas Mathematics: Unpacked Content. . professional development, is one of many resources used to understand and teach the new math standards. What is in the document? Descriptions of what each standard means a student will know, understand, and be able to do. The “unpacking” of the standards doneFile Size: 1MB