Transcription
Trading the HarmonicPatterns EffectivelyPDF VersionHarmonicPatternScanner.com
Disclaimer:Your Capital is at Risk. Nothing is ever guaranteed.Please use ONLY risk capital. Using the right tradingapproach, you have a high chance of success.HarmonicPatternScanner.com
CLAIM USD90 To Trade Risk Free Before we start, here’s something special for you. You can claim USD90 from these Reliable ForexBrokers. We highly recommend them because we have usedthem for the past 5 years. Each of these brokers will fund your trading account forjust opening a live verified account with them. Nodeposit needed.HarmonicPatternScanner.com
Open Your Live Accounts Here Broker 1 – Claim USD30 Here Broker 2 – Claim USD30 Here Broker 3 – Claim USD30 HereDue to regulations, these bonuses are only for non US residents only.HarmonicPatternScanner.com
Why Trade Chart Patterns? Chart Pattern Analysis is an important skill to acquireespecially if you want to be a serious and profitabletrader. While it may seem that other sexier Technical Toolsmay be more effective, Chart Pattern Analysis remainsleaps and bounds ahead because it allows any serioustrader to be predictive and to anticipate rather thanreact to market movement.HarmonicPatternScanner.com
READ ME FIRST! Harmonic Patterns look intimidating. You might feeloverwhelmed. DON’T! This is a powerful approach and you have to learn totrade Harmonic Patterns. We have simplified and created a Powerful SoftwareRecognition for Harmonic Patterns if you are serious.So read on HarmonicPatternScanner.com
Why Trade Chart Patterns? Basically there are just 2 main types of patterns. Wecan just safely classify them as Continuation pattern orReversal Pattern. In the history of market prices, it’s all about supplyversus demand and at times, the market may act withan extreme sentiment and that’s usually down toextreme Fear or greed.HarmonicPatternScanner.com
Why Trade Chart Patterns?Market movements have historically moved only in 3patterns. Basically the market moves Up Down SidewaysHarmonicPatternScanner.com
Why Trade Chart Patterns? In those movement, we might see a trend,consolidation and perhaps a re-trend or then reversal. This kind of movement is universal in ALL financialinstruments. In the sideway movements, Forex pairswill experience a tighter range. And it is this ranging behavior we are able to observerepeating chart patterns.HarmonicPatternScanner.com
Why Trade Chart Patterns? There have been a lot written on the Harmonic Patternsand the last thing I want to do is to go rambling on thesame thing that you can read elsewhere. So let’s notwaste anytime here In the modern Harmonic Patterns, there is the same 5point movement that makes the market morepredictive. This was the original pattern created byH.M. Gartley.HarmonicPatternScanner.com
Why Trade Chart Patterns? In later years, Larry Pesavento greatly improved theGartley Patterns by incorporating the ever greenFibonacci ratios to the original Gartley Patterns. And then Scott Carney came along and adding morevariation to the already reliable Gartley Patterns and itwas when Crab, Bat, Shark, and 5-0, brought the entireHarmonic Pattern to life.HarmonicPatternScanner.com
Why Trade Chart Patterns? So what started as the Gartley Pattern evolved to whatwe have today as the Harmonic Pattern with theaddition of Crab, Bat, Shark and 5-0. The main concept of Harmonic Patterns is therelationship of time and price movements, whichshares the same concept as the Fibonacci Ratio. Incase you do not know, the Fibonacci Ratio is apowerful theory that identifies key support andresistance points in the market.HarmonicPatternScanner.com
Why Trade Chart Patterns? While many Fibonacci Experts like to believe that theRatios work well in any market and any time frame, wepersonally feel that it works best in higher timeframes.HarmonicPatternScanner.com
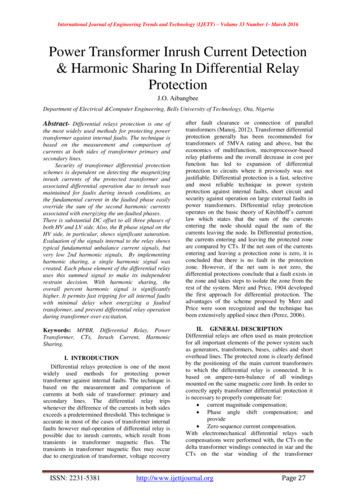
Examples of Gartley Pattern To draw a Gartley Pattern, we will need Five Points.While it may look complicated at first, it’s reallynot when you connect the 5 price points. These 5price points are usually the pivot points or turningpoints in the market.
Examples of Gartley Pattern The Gartley Pattern should resemble either a “M” or“W”. Usually the M will be the Bullish pattern and the Wwill be the bearish chart pattern. X is the starting point moving to the high of A. Then theretracement to B and another upward attempt to Cbefore another retracement to D. D is where the triggerwill be.HarmonicPatternScanner.com
Examples of Gartley Pattern An ideal Gartley Pattern should have 5 key pivot pointsthat should include 2 retracement and 2 reboundswings that “coincidentally” coincides with FibonacciRatios. The center of the Gartley Pattern is B and thetrigger point to buy or sell is D.
Other Variations of Harmonic Patterns There are numerous variations of the HarmonicPatterns. This is where you might become overwhelmed andconfused. Next page are the different variations It’s ok we have a simple shortcut.HarmonicPatternScanner.com
Other Variations of the HarmonicPatterns
Trading the Harmonic Pattern Effectively To trade Harmonic Patterns Effectively, you just mustknow that the Trigger Point is Point D. Of course, you MUST learn how to recognize theHarmonic Patterns when they form. This will take some practice if you are not familiar.HarmonicPatternScanner.com
Trading the Harmonic Pattern Effectively Fortunately, we have created a scanner that recognizethe Patterns for you.Click here to learn More Works in All Time Frames and All Forex Pairs as longas it’s available on MT4. However, Patterns are much more reliable in HigherTimeframes like H1 and Above.Preferably H4 and above.HarmonicPatternScanner.com
Effective Harmonic Trading Once you have recognized a Harmonic Pattern, thenusing Fibonacci Retracement (comes Free with yourMT4) draw the High and Low on the chart. Either you can manually scan for the HarmonicPatterns in the market or in this example, we used ourHarmonic Scanner to identify a nice trade HarmonicPatternScanner.com
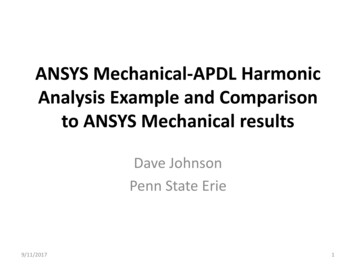
Bearish Trade Example in USDJPY H4
Bearish Trade Example in USDJPY H4 We sell at POINT D. TP Target 1 at 38.2%TP Target 2 at 23.6% Stop Loss at 61.8%HarmonicPatternScanner.com
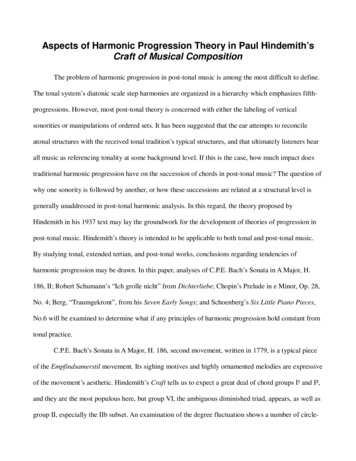
Bullish Trade Example in USDCAD H4
Bullish Trade Example in USDCAD H4 We Buy at POINT D. TP Target 1 at 23.6%TP Target 2 at 38.2% Stop Loss at 0.00%
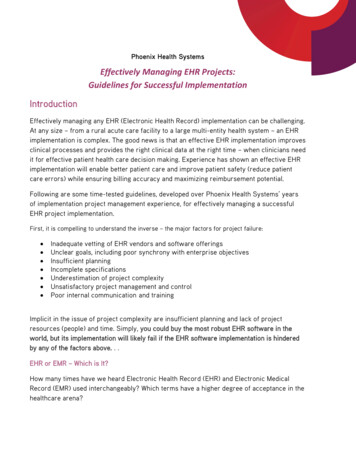
Bearish Trade Example in EURUSD H1
Bearish Trade Example in EURUSD H1 We Sell at POINT D. TP Target 1 at 23.6%TP Target 2 at 38.2% Stop Loss at 10 pips above 0.00%HarmonicPatternScanner.com
Easy Trading with Harmonic Patterns As you can see, it’s EASY trading with HarmonicPatterns. The BIGGEST Challenge with Harmonic Trading is torecognize the patterns manually. It’s difficult and it’s time consuming. With this POWERFUL Harmonic Pattern recognitionscanner to help us scan the market, trading HarmonicPattern became 10X easier.Click here to learnmore
Easy Trading with Harmonic Patterns If you want to do it manually, it’s all cool. You might stilldo well. We strongly suggest that you get this tool because itwill save you the time and one good trade will pay itselfoff. Click here to learn more If you already bought the tool, thank you so much. Ifyou have not, then delay no more See you on the inside HarmonicPatternScanner.com
Trading the HarmonicPatterns EffectivelyPDF VersionHarmonicPatternScanner.com
Gartley Patterns by incorporating the ever green Fibonacci ratios to the original Gartley Patterns. . Works in All Time Frames and All Forex Pairs as long as it’s available on MT4. However, Patterns are much more reliable in Higher Timeframes like H1 and Above. Preferably H4 and above. HarmonicPatternScanner.com. Effective Harmonic Trading Once you have recognized a Harmonic