Transcription
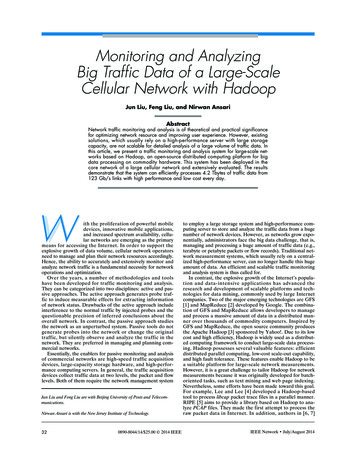
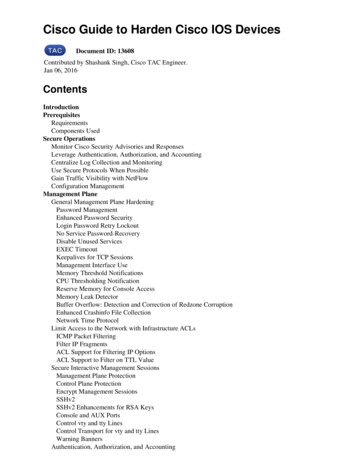
How to monitor network traffic inside an ESXi hostcreated by: Rainer Bemsel – Version 1.0 – Dated: Dec/30/2012I’ve done several packet analyses on physical wired environment which was easy and pretty straight forwardto set up. But with all virtualization efforts, you may need to analyze inside an ESX host. With a standardNIC and all connected virtual machines, it won’t work. You will get packets captured from the initiator to theresponder, but nothing more.Let’s have a look on my virtual machine, called “CA ADA Virtual Monitor”, where I’ve installed Wireshark.When pinging from this host to 192.168.10.175, I was able to collect packets.I also ping’d from 192.168.10.231 to 192.168.10.175 and from 192.168.10.174 to 192.168.10.175. Those packetswere not seen in Wireshark.Why is that so?Network switches make use of forwarding tables to know what devices are connected on what network port.That traffic will only flow between those two network ports. Packet Analyzer won’t see that traffic, unlessthe traffic is coming from them. In a physical environment you configure a set of ports to be mirrored tothe port, where Wireshark attached Host is connected. This configuration makes copies from all trafficgoing from specific port(s) to a destination port. On my virtual host, I don’t have a SPAN port.
How to monitor network traffic inside an ESXi hostpage 2 of 6The use of any packet capture tool requires some network configuration on the VMware ESXi host. You mustcreate a dedicated “Management” port group. You could also create a “Monitor” port group under which allyour virtual machines will reside, although you may choose to use an existing port group. Promiscuous modemust be enabled for the “Monitor” (or previously existing) port group and disabled for the “Management”port group.In the example below, vSwitch0 has a Management Network port group, as well as, an existing port group,VM Network, that acts as the “Monitor” port group.To configure the vSwitch use the VMware vSphere Client1. Select the Configuration tab for the ESXi Machine2. Select Networking, located in the Hardware Panel3. Determine which vSwitch does not host any application traffic that will be monitor by PacketAnalyzer. Click on PropertiesNote: If the ESX host only has one vSwitch connected to the physical network then both the Managementand Monitor port groups will exist on the same vSwitch.4. On the Port tab, click Add5. Select Virtual Machine as the connection type.6. Enter Management as the Network Label and select All (4095) for VLAN ID.
How to monitor network traffic inside an ESXi hostpage 3 of 6Note: You may choose to enter the specific VLAN ID that has the application traffic you wish tomonitor7. Click Next and Finish8. Go back to Properties and select the newly created Management port group from the list in the Portstab and click Edit9. Click OK10. Determine which Switch hosts the application traffic that will be monitor by Wireshark11. Select the port group from the Ports tab and click on Edit.
How to monitor network traffic inside an ESXi hostpage 4 of 612. Check the Promiscuous Mode option and set as Accept13. In vSphere Client select the Wireshark PC and add another Network adapter if necessary and makea note of their MAC addresses.14. I did rename the Adapter to differentiate them easily. The Network Adapter 1 (Ethernet AdapterManagement) will be connected with Management and Network Adapter 2 (Ethernet AdapterMonitor) will connected with VM Network.
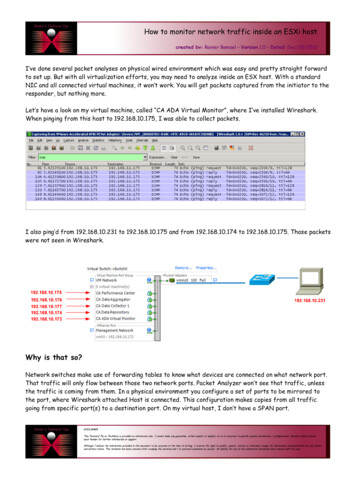
How to monitor network traffic inside an ESXi hostpage 5 of 615. You can easily verify the proper assignment by comparing their MAC AddressesNetwork Connections on WireShark PC
How to monitor network traffic inside an ESXi hostpage 6 of 6Again pinging from Wireshark PC to 192.168.10.231, from 192.168.10.231 to 192.168.10.175 and from192.168.10.174 to 192.168.10.175. Now I can see ICMP packets from any internal and external hostsReference Networking Configuration tab
How to monitor network traffic inside an ESXi host page 4 of 6 12. Check the Promiscuous Mode option and set as Accept 13. In vSphere Client select the Wireshark