Transcription
Org. Opto-Elect. 2, No. 1, 1-14 (2016)1Organo Opto-ElectronicsAn International Journalhttp://dx.doi.org/10/18576/ooe/020101 2012 NSPOptical Properties of Nano-Rods PTCDA Thin Films: anImportant Material for Optoelectronic ApplicationsS. AlFaify1,*, Y. S. Rammah2, H. Y. Zahran1,3, F. Yakuphanoglu4 and Mohd. Shkir11Advanced Functional Materials & Optoelectronics Laboratory (AFMOL), Department of Physics, Faculty of Science, KingKhalid University, P.O. Box 9004, Abha, Saudi Arabia.2Physics Department, Faculty of Science, Menoufia University, Shebin El-Koom, Egypt.3Metallurigical Lab., Physics Department, Faculty of Education, Ain Shams University, Roxy, Cairo, Egypt.4Department of Physics, Faculty of Science and Arts, Firat University, Elaziğ, Turkey.Received: 21 Feb. 2015, Revised: 22 Mar. 2015, Accepted: 24 Mar. 2015.Published online: 1 Jul. 2016.Abstract: Thin films of 3,4,9,10-perylenetetracarboxylic dianhydride (PTCDA) of different thicknesses (155, 230, 354, and 470 nm) areprepared using thermal evaporation method. The XRD pattern confirms that the this films are preferentially grown along (102) direction.The morphology was studied by AFM and showed that the prepared films are nanocrystalline in nature consisting rod like nano-particlesgrains. The average grain’s size was fond to be 44.5 nm with RMS (root mean square) surface roughness of 11.6 nm. The optical propertieswas studied in the wavelength range of 300-2600 nm. Further the collected data of transmittance T(λ) and reflectance R(λ) coefficientswas used to calculate its refractive and absorption (n & k) indices. The dielectric (ε1 & ε2), dissipation factor ( tan ), optical conductivity( opt ), optical band gap ( Eg ), volume energy loss (VELF) and surface energy loss (SELF) functions are calculated and discussed.optOwing to the measured optical absorption data of the film, there are four indirect band gaps ranging from 1.88 to 3.45eV. Overall, theobtained data suggests that the PTCDA film can serve as potential materials for optoelectronic devices.Keywords: Organic Semiconductor, PTCDA Film, Nanostructure, Optical Parameters, Optoelectronic Devices.1 IntroductionOrganic semiconductors with developed conjugated π-electronic systems are commonly utilized in many optoelectronicapplications as organic LED (light emitting diode) and photovoltaics. In general, organic materials excel in various aspectsin comparison with their inorganic counterparts. They are low toxic materials and have technological advantages whenproducing effective photoconductive compounds. In addition, they are more flexible for devices fabrications (Borsenberger,1998; Law, 1993). Moreover, some organic materials such as phthalocyanine, perylene, and their derivatives can be utilizedto form complex structures. Therefore, the quasi-epitaxial orders of such material can be achieved by growing the thin filmsusing advanced epitaxial growth techniques (Forrest, 1997). Such this films fabrication with good properties areoverwhelmingly good for advanced optical technologies.Recently, studies on the properties of PTCDA materials, in particular, structural and morphological investigations on 3,4,9,10- Perylenetetracarboxylic dianhydride (PTCDA) were carried out (Fenter et al., 1997; Forrest, 1997; Schmitz-Hübschet al., 1997). Such studies shows that the PTCDA materials exhibit promising properties (electrical and optical) fromoptoelectronic applications points of view. These properties are most probably due to the material’s electronic structure asits regular planar π–π stacking and its narrow intermolecular distance, which cause directional interactions (strong and weak)(Fenter et al., 1997; Forrest, 1997; Schmitz-Hübsch et al., 1997). Therefore, the PTCDA materials are considerably studiedas a model material for organic molecular excitations. However, beside the fundamental interest in the PTCDA materials,there are another interests due to its potential applications in modern organic electronic and optoelectronic devices(Oukachmih et al., 2005), field-effect transistors (FETs) (Briseno et al., 2007; Jones et al., 2007), light-emitting diodes(LEDs) (Hoeben et al., 2005), organic semiconductors (Chen et al., 2007; Würthner et al., 2001), and in waveguides and*Corresponding author e-mail: saalfaify@kku.edu.sa. 2016 NSPNatural Sciences Publishing Cor.
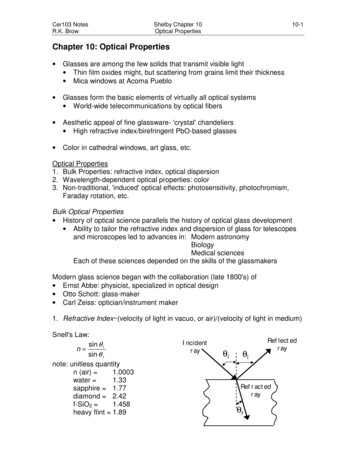
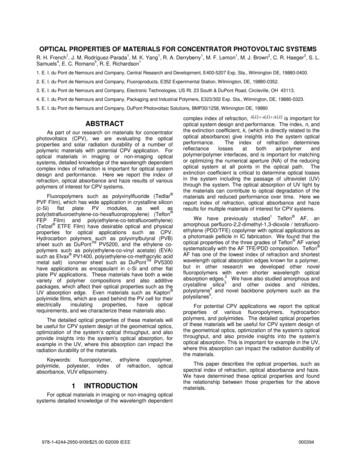
S. AlFaify et al.: Optical Properties of nano-rods 2other microwave applications (Böhler et al., 1998; Karmann et al., 1996; Lee et al., 1998; Shen et al., 1997; Taylor et al.,1997; Urbach et al., 1998).However, utilizing the use of the PTCDA materials in different applications requires a thorough knowledge of the material’soptical properties that is still scarce. Few optical and structural data on the PTCDA and its derivatives have been seen latelyin the literature including absorption spectra (Bayliss et al., 1999; Bulović et al., 1996), showing a two-peaks structure inthe range of 400 to 600 nm, with a broader peak at higher-energy and narrower and less intense one at lower-energy range.The PTCDA crystallizes into two polymorphs- and -phases in which their relative amount depends on the filmthickness and the substrate temperature (Leonhardt et al., 1999; Möbus et al., 1992). The PTCDA’s optical functions of the- and -phases are unknown yet, except for the low-temperature regimes. In the literature, the reported refractiveindices of the PTCDA film has been obtained for a small part (300–800 nm) of the general spectral range (Djurišić et al.,2000), or at fixed wavelength (Nagaseki et al., 1995; Zang et al., 1991). Knowledge on the optical constants of the PTCDAfilm is essentially important for its applications in biochemistry, biophysics, biomedicine, and optoelectronic devices. Inaddition, it is critical for the evaluation and standardization of the measured optical data of the film obtained by varyingmethods such as Raman, infrared, reflection, and anisotropy spectroscopes (Friedrich et al., 2002). Moreover, theinvestigation of the derivatives of 3,4,9,10-PTCDA thin films are tremendously increased for overall understanding of thegrowth nature of organic molecules films deposited on different substrates. The objective of this paper is to present an investigation on the structural and optical properties of the 3,4,9,10PTCDA thin films grown with various thicknesses. The absorption spectra were measured in a wide range of wavelengths,spanning from 300 to 2600 nm. In addition, the optical constants of the 3,4,9,10-PTCDA films, over the chosen spectralrange, were determined from transmittance T(λ) and reflectance R(λ) measurements of the film. The transport property, onsetand the fundamental energy gaps, are estimated. The complex dielectric functions and the volume/surface energy lossfunctions are computed. Moreover, dissipation factor and optical conductivity behaviors of the film are also studied anddiscussed in different sections.2 Experimental ProceduresPure raw material of 3,4,9,10- Perylenetetracarboxylic dianhydride (PTCDA) was purchased from Sigma-Aldrich companyand used for thin films fabrications without any further purification. Molecular structure of PTCDA is shown in Fig. 1.Physical evaporation system was utilized to grow PTCDA films in a high vacuum coating unit (PVD-HANDY/2S-TE,Vaksis Company), with a pressure within the growth chamber reaching better than 2x10 -5 torr. The PTCDA material wasvacuum sublimated within a special designed Silica tube crucible heated by a boat- shaped Molybdenum.Fig.1. Schematic representation for the PTCDA molecular structure.Structural investigations of the PTCDA films grown on glass substrate were carried out using X-ray diffraction(XRD)technique. Philips X-ray diffractometer (model X’-Pert) was utilized for the measurement, equipped with amonochromatic CuK radiation source operated at 40 kV and 25 mA. Diffraction patterns were recorded automatically witha scanning speed of 2 /min.The surface morphology of the PTCDA film was also characterized using atomic force microscope (AFM), Solver-Next,NT-MDT, Russia available at the nano-labs of the physics department at King Khalid University. The analysis of the nanograin structure and surface topology of the studied films were accomplished from the obtained AFM’ micrographs usingspecialized software.The transmittance T(λ) and reflectance R(λ) spectra of the as-deposited PTCDA films were measured at normal incidence oflight in the spectral range of 300–2600 nm by a double-beam spectrophotometer (JASCO model V-670 UV–Vis–NIR). A 2016 NSPNatural Sciences Publishing Cor.
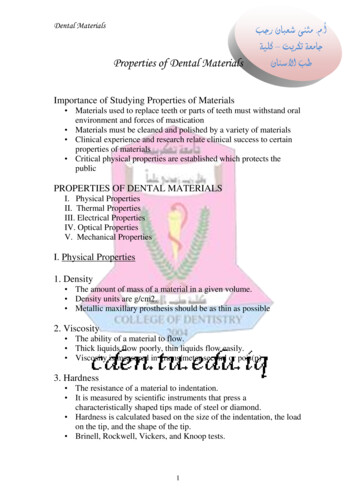
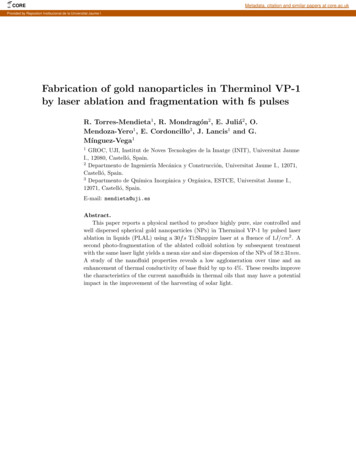
Org. Opto-Elect. 2, No. 1, 1-14 (2016) / ss blank substrate was used as a reference for the transmission/reflection scans.3 Results and Discussion3.1 Structural investigationsPTCDA is known to crystallize in two polymorphic formsα and depending on its growth conditions. The structure of thetwo phases are very similar both crystallizing in the monoclinic structure with P21/c space group. The lattice constants of αphase are a 3.72Å,b 11.96 Å and c 17.34 Å while for -phase a 3.78 Å, b 19.30 Å and c 10.77 Å within the samespace group (Möbus et al., 1992). X-ray diffraction of powder and thin film (thickness 470 nm) PTCDA are shown inFig.2a. The hkl of each peak for the powder pattern was generated using index software depending on the values of thelattice parameters of the studied phases. The hkl of the studied powder pattern are more related to the -phase.Fig.2a. X-ray diffraction (XRD) pattern of the PTCDA powder and thin film with thickness 470 nm (as a representativeexample).Fig.2b. 2D (A) and 3D (B) AFM micrograph of PTCDA thin film (at thickness of 470 nm as a representative example).As observed from the Fig.2a, the plot showed that there is a single peak at 27.48 ocorresponding to (102) plane, a preferredorientation of growth. XRD pattern of PTCDA thin film is commonly described by a single peak (showing the preferredgrowth orientation) superimposed/dipped on the amorphous matrix. PTCDA crystal size was calculated using famous 2016 NSPNatural Sciences Publishing Cor.
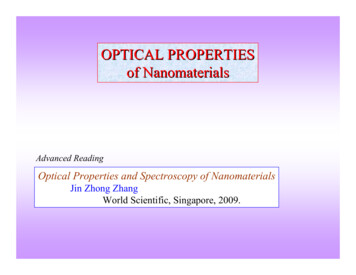
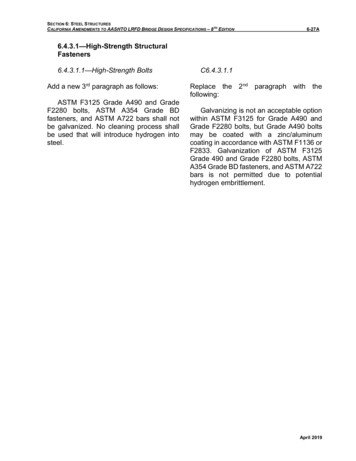
S. AlFaify et al.: Optical Properties of nano-rods 4Scherer's formula (Aydın et al., 2011; Cullity, 1978; Farag and Fadel, 2013; Shkir et al., 2012a; Shkir et al., 2012b) for the(102) plane:Lhkl 0.9 cos ,(1)where λ is wavelength of x-ray, β is full width at half-maximum of the diffraction peak (in radians)and θ is the angularposition of the diffraction peak. Rough size of the grain-like crystal of the PTCDA thin film of thickness 470 nm was thencalculated and found to be 25.96 nm. Ludwing et al. [30] mentioned that PTCDA material can easily formed well-orderedlayers on substrate due to its fine crystal structure.2D and 3D surface morphology of the evaporated PTCDA thin film of thickness 470 nm was investigated usingatomic force microscopy. The 2D and 3D AFM images of the film with dimension of 7x7 µm 2 are shown in Fig.2b. It isevident from the collected AFM data that the studied PTCDA film is composed of nano-rods. It is appeared as well thatthere are new growths of nano-particles at the top tip of these PTCDA rods.3.2 Optical characterizations of PTCDA thin films.Studying optical properties of the investigated 3,4,9,10- Perylenetetracarboxylic dianhydride (PTCDA) films is importantfor obvious reasons. In particular, the investigation of the absorption edges of such material, which is crucial forunderstanding electronic structure and formation of any organic material. In the presented optical study, the spectraldistribution of the refractive indices n and absorption indices k were obtained using the measured spectra of thetransmittance and reflectance coefficients for the investigated PTCDA thin films. The onset energy gapenergy gapEgand opticalE gopt are determined using the measured data of the absorption coefficients α of the films. The analysis of therefractive and distinction indices ( n ,k) was carried out to find real and imaginary parts of the complex dielectric functions ( 1 and 2 ), dissipation factors tan , VELF and SELF functions, and optical conductivity ( opt ).3.2.1 Transmittance T(λ) and reflectance R(λ) spectraFig.3. Spectral distribution of transmittance T(λ) and reflectance R(λ) of the PTCDA thin films of different thicknesses.The spectral distribution of transmittance T(λ) and reflectance R(λ) coefficients was investigated for the PTCDA thin filmsof various thicknesses (155, 230, 354, and 470 nm) at normal incidence of light in the wavelength range 300- 2600 nm. Fig.3depicts the obtained spectral curves of transmittance T(λ) and reflectance R(λ) for the PTCDA films, respectively. From thefigure, one can note that at higher wavelengths all studied PTCDA films seem to be transparent and no scatting or absorption 2016 NSPNatural Sciences Publishing Cor.
Org. Opto-Elect. 2, No. 1, 1-14 (2016) / http://www.naturalspublishing.com/Journals.asp5of light due to the films in such region (i.e. R T 1). Therefore, for this region it is possible to consider the absorption indexto be dull( k 0), then the refractive indices can be directly calculated. According to Fig.3, the absorption region for the filmswhere inequality relation, R T 1, holds is in shorter wavelengths.3.2.2 The refractive and absorption (n,k) indices of the PTCDA filmsThe obtained data from transmittance and reflectance measurements were used to compute the refractive and absorptionindices using the following equations: (n 1) 2 k 2 ,R 22 (n 1) k (2)where normal reflectance of an absorbing material is usually calculated through equation (1) (Abelès, 1972; Caglar et al.,2009; Harbeke and Abeles, 1972; Hodgson, 1970). Then refractive index is then computed from the previous equation(Abelès, 1972; Yakuphanoglu et al., 2007a; Yakuphanoglu et al., 2007b) as:1/ 2 1 R 4Rn k 2 2 1 R (1 R) ,(3)where n andk are respectively refractive and absorption indices. While the values of the absorption indices k are calculatedfrom the absorption coefficients using the well-known relation of k / 4 (Swanepoel, 1984), where A/ t ( Ais being the measured absorbance and t is the thickness of the investigated film).The spectral distribution of n and k asfunctions of λ for the PTCDA thin films deposited with varying thicknesses (155, 230, 354, 470 nm, and the averagethickness values of these films) are plotted in Figs. (4&5), respectively. Then and k curves showed dependency on the filmthickness.Fig.4.Dependency of the refractive indices n on the incident wavelengths for the PTCDA films deposited at variousthicknesses. 2016 NSPNatural Sciences Publishing Cor.
S. AlFaify et al.: Optical Properties of nano-rods 61.6155 nm230 nm354 nm470 021002400λ, nmFig.5. Dependency of the absorption indices k on the interacting wavelengths for the PTCDA thin films grown at differentthicknesses.3.2.3 Dielectric characterizations of the PTCDA films3.2.3.1 Determination of high frequency dielectric constant .High frequency dielectric constant can be estimated by analyzing the obtained data of the refractive indices. iscommonly associated with the free carriers and lattice vibration modes of the material dispersion properties (Mahmoud etal., 2011). In addition, can be related to the material refractive index through the following equation: (El-Nahass et al.,2011a; Mahmoud et al., 2011): 1 n 2 e2 N 24 2c 2 o m*(4)Where 1 is real part of dielectric function, e is the elementary electron charge, N is concentration of free charge carriers, o is free space permittivity 8.854 10 12F / m , where m * is effective mass of charge carrier and c is the speed constantof light.The relation between 1 n 2 and 2 for PTCDA thin films studied in this presented work is shown in Fig.6.10155 nm230 nm354 nm470 nmAverage98ε1 n2765432101.E 062.E 063.E 064.E 06λ2,(nm)5.E 066.E 067.E 06222Fig.6. Plots of 1 n as a function of for the PTCDA thin films of different thicknesses. 2016 NSPNatural Sciences Publishing Cor.
Org. Opto-Elect. 2, No. 1, 1-14 (2016) / 55 nm230 nm354 nm470 nmAverage18Real dielectric constant, ε116141210864200.511.522.533.544.5hν, (eV)Fig. 7. Plots of 1 vs. photon energy ( h ) for the PTCDA thin films at different thicknesses.It is clear that there is a dependency of 1 on 2 , which is linear at higher wavelengths. This verifies the linearity of Eq.(3).Value of for each thin film is then determined from extrapolation to the linear part of the plot to 2 0 and thecorresponding values of N / m* were calculated from the graphs slopes. The values of are 3.50, 3.75, 5.00, 5.50, and4.15 for PTCDA thin films with thicknesses 155, 230, 354, 470 nm, and its average, respectively. Taking into account that L , where L is lattice dielectric constant. In addition, it is important to notice that at high frequency the localizedtraps in a material cannot be followed by its optical signals. Hence, the contribution of the charge carrier may beneglected(El-Nahass et al., 2011a; Farag and Yahia, 2010).3.2.3.2 Determination of real part 1 and imaginary part 2 of dielectric function Studying dispersion behaviors of a dielectric function ( ) gives researcher an important tool to understand light reflection,refraction, and dissipation in multilayer materials. Moreover, such approach can eventually shed light on the electronic structure of the material under investigation. In fact, is considered an important physical quantity when designingeffective optoelectronic devices (Abdel-Aziz et al., 2006; El-Korashy et al., 2003; Fadel et al., 2009;Khan et al., 2010). 1 ( ) i 2 ( ) asa function of wavelength has real part 1 , representing the normal dielectric constant, and animaginary part 2 , corresponding to absorption associated with the media free carrier radiation. For the studied PTCDAfilms, the dielectric function parts are determined by the following relations at the material light absorption region, wherek 0 (Abdel-Aziz et al., 2006; El-Korashy et al., 2003; Fadel et al., 2009; Khan et al., 2010): e2 N 2 ,2* 4 c 0 m 1 n 2 k 2 (5)and p2 3 2 2nk 2 3 , 8 c (6)where is relaxation time, k / 4 is extinction coefficient and p 2 is photon angular frequency. Thedependences of 1 and 2 on light energy ( h ) for the studied PTCDA films grown with various thicknesses are plottedin Figs.(7&8), respectively. Apparently, real parts of PTCDA films dielectric function have higher values than those of theimaginary ones, although they are both (real and imaginary parts) behaving in a similar pattern. In general, variation of thePTCDA dielectric function with varying photon energy is a sign of photon-electron interactions taking places within the 2016 NSPNatural Sciences Publishing Cor.
S. AlFaify et al.: Optical Properties of nano-rods 8PTCDA material at the covered energy range (Abdel-Aziz et al., 2006; El-Korashy et al., 2003; Fadel et al., 2009; Khan etal., 2010).0.09155 nm230 nm354 nm470 nmAverageImaginary dielectric constant, 544.5hν, (eV)Fig.8. Plots of 2 vs. photon energy ( h ) for the PTCDA thin films of varying thicknesses.Real and Imaginary parts of a dielectric function are usually used to find out the dissipation factor ( tan ) of a material.Since tan can be defined as the rate of a power loss in an oscillation mode for dissipative systems. Hence, dissipationfactor tan in a material system is known as the ratio of the absorption due to the free charge carriers in the system to thenormal dielectric constant of the system and it can be computed from the following equation (Fadel et al., 2009):tan 2 1(7)The dissipation factor tan of the studied PTCDA thin films is calculated and shown in Fig.9. Observation from Fig.9suggests patterns similarity of tan and dielectric function of the studied PTCDA films. Such observation is alsosupporting the idea of active electron-photon interactions taking place within the PTCDA film’s material at the investigatedenergy range.0.0160.0140.012155 nm230 nm354 nm470 nmAveragetanδ0.010.0080.0060.0040.00201E 143E 145E 147E 149E 141.1E 15ν, (Hz)Fig.9. The variation of the dissipation factor 2016 NSPNatural Sciences Publishing Cor.tan for the PTCDA thin films with the photon energy ( h ).
Org. Opto-Elect. 2, No. 1, 1-14 (2016) / le. 1 Energy band gap values and their mean (average) values for the PTCDA films grown at different thicknesses.Thickness155 nmEg1,(eV)1.84Eg2,(eV)1.70Eg3,(eV)2.80Eg4, (eV)3.45230 nm1.951.722.823.50354 nm2.21.902.803.40470 nm2.21.922.803.40average1.881.952.703.450.006155 nm230 nm354 nm470 33.544.5hν, (eV)Fig.10. Dependency of VELF on the photon energy ( h ) for the PTCDA thin films.0.003155 nm230 nm354 nm470 5hν, (eV)3.54.5Fig. 11. Dependency of the SELF on the photon energy ( h ) for the PTCDA thin films grown at different thicknesses. 2016 NSPNatural Sciences Publishing Cor.
S. AlFaify et al.: Optical Properties of nano-rods 103.2.3.3 Determination of VELF and SELF for the PTCDA filmIn this section, the interest is to study some physical quantities of the PTCDA film. They are commonly used todescribe the rate of electron energy loss when passing through a material. These quantities are the volume energy loss(VELF) and the surface energy loss (SELF) functions. VELF and SELF can be related to the real and imaginary terms of adielectric function as well through the following relation (Farag and Yahia, 2010; Mahmoud et al., 2011): 1 VELF Im 2 2 2 , 1 2(8) 2 1 ,SELF Im 2 1 1 1 22 (9)andFigs.(10&11) respectively presented VELF and SELF of the investigated PTCDA films as functions in photon energies.From these figures, It is can be concluded that the functions of energy loss of the transporting free charge carriers, whentraversing through the PTCDA’s bulk or when traversing the PTCDA’s surface, are behaving in similar ways, especially inlower energy regions. There is no significant difference between VELF and SELF of the studied PTCDA films at lower andhigher photon energies. However, it seems that values of VELF are increasing more rapidly than that of SELF at particularpeaks.35155 nm230 nm354 nm470 nmAverage2σ1x10 ,(S/cm)3025201510500.511.522.5hν, (eV)33.544.5Fig.12. Dependency of 1 on the photon energy ( h ) for the PTCDA thin films. 2016 NSPNatural Sciences Publishing Cor.
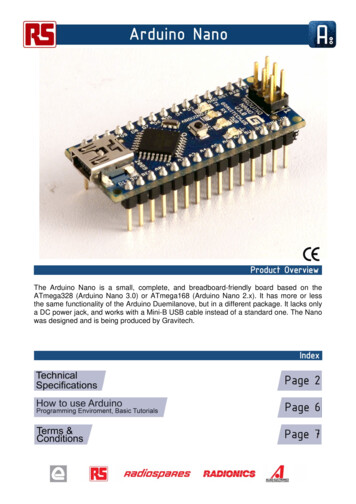
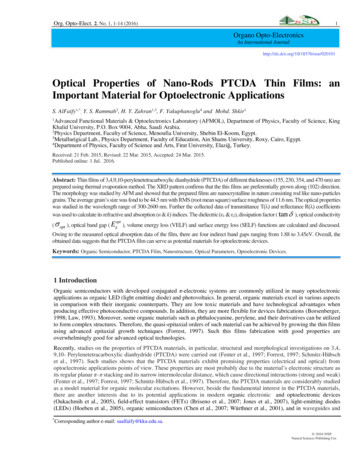
Org. Opto-Elect. 2, No. 1, 1-14 (2016) / 55 nm230 nm354 nm470 nmaverage435σ2x10 , (S/cm)52100.51.52.5hν, (eV)3.54.5Fig.13. Dependency of 2 the photon energy ( h ) for the PTCDA thin films deposited with different thicknesses.3.2.4 Optical conductivity of PTCDA filmsOptical conductivity opt is one of the fundamental properties of a material, it sums its optical properties. Ingeneral, the optical conductivity of a material is used to learn aboutthe material’s allowed inter-band for optical transitions. The complex optical conductivity ( 1 ( ) i 2 ( ) ) of a material is in fact connected to its dielectric function ( 1 ( ) i 2 ( ) ) through following relations (Yakuphanoglu et al., 2004): 1 2 0 ,and 2 1 0 ,(10)where 1 and 2 are respectively real and imaginary parts of the material’s optical conductivity . Figs.(12&13) show 1 (h ) and 2 ( h ) functions for the studied films of PTCDA grown with varying thicknesses. The results exhibitcrisscross relations between imaginary and real parts of the PTCDA’s optical conductivity and dielectric function. The realparts of the optical conductivity and the imaginary ones of the film’s dielectric function and vice versa were found followingthe same patterns, for comparison see Figs.(7&8) and Figs.(12&13). The results showed as well that there are four distinctpeaks for 1 and 2 , origin of such peaks can be attributed to optical inter-band transitions within the studiedmaterial(Yakuphanoglu et al., 2004).3.2.5 Energy gap determinationKnowledge of the spectral distribution of the absorption coefficients of a semiconductor material near fundamental edge isimportant to understand the types and behavior of the material’s optical transitions (direct and indirect transitions). Suchknowledge is also valuable when studying the material’s band gap structure. Utilizing Maxwell equations, the material’sabsorption coefficient ( ) is calculated from the equation, 4 k , where k is distinction constant and is the optical wavelength. The optical band gap and transitions, for the material under investigation, are then obtained from the absorptioncoefficients as functions on photon energy ( h ) (El-Nahass et al., 2004a; El-Nahass et al., 2004b; Kamath et al., 2002).Ingeneral, the absorption spectrum of an organic material does follow a power-law equation (Azim et al., 2009; Mahmoud etal., 2011; Pal et al., 1993; Yaghmour, 2009; Yakuphanoglu, 2009): 2016 NSPNatural Sciences Publishing Cor.
S. AlFaify et al.: Optical Properties of nano-rods 12 h A h Eg m ,where is the absorbance coefficient,Eg(11)is optical band gap energy, and A is a constant (independent ofh but dependson transition probability). m is a specific number of transition process (direct or indirect). In this work, the indirect band gaptransitions of the studied film was estimated through plotting ( h )1 / 2 versus ( h ) with m 2, and through extrapolationof the linear part of the resulted curve at the lower energy limit. Fig.14a shows the dependency of ( h )1 / 2 on ( h ) for thePTCDA thin films deposited at various thicknesses. For simplicity, Fig.14b shows the band gap structures of only one curvefrom the results showed in Fig.14a, which is a characterization for the average result of the thin films.1600155 nm230 nm354 nm470 nmAverage14001/2)12001/2(αhν) , (cm-1/2. eV100080060040020000.511.522.533.544.5hν, (eV)-1/21/2(αhν ),(cm . eV )1/ 2Fig. 14a. Plots of ( h ) vs. photon energy ( h ) for the PTCDA thin Average0.511.522.53hν, (eV)3.544.5Fig.14b. Energy band gap structure plot of the average of ( h ) vs. photon energy ( h ) for of the PTCDA thin filmsat average thickness.1/ 2 2016 NSPNatural Sciences Publishing Cor.
Org. Opto-Elect. 2, No. 1, 1-14 (2016) / ch thickness of the studied organic films has at least four indirect energy gap bands; their values are found to be 1.88,1.95, 2.70, and 3.45eV,respectively.The found transitions of the studied films are in well agreement with earlier work(Collinset al., 1993; El-Nahass et al., 2011b; El-Nahass and Youssef, 2010; Kumar et al., 2000) on PTCDA. It should be notedthough that the first founded energy’s value is the optical energy band gapE goptoptof the studied material. E gdoescorrespond to the onset of the optical absorption and formation of the bound electron-hole pair (Frenkel exciton) (Tsiper etal., 2002). However, the last energy value is the fundamental energy gap (gap between valenceand conduction *bands) (Zhokhavets et al., 2003). The values in between may be attributed to impurities in the material. 4 ConclusionThe XRD analysis of the PTCDA film confirms its nanostructure morphology with crystalline size of 25.96 nm. In addition,the nanostructure of the PTCDA film material was characterized by a preferred orientation along (102 ) plane. The AFMsupports the results of the XRD showing a nanostructure of the studied film with grain (nanoparticles) size of 44.56 nmand surface roughness of 11.599 nm. The obtained values of n and k constants of the PTCDA film were found to bedependent on the films thickness. The real and imaginary constants of the films dielectric function behave in similar patternswhen compared to their corresponding optical constants. In addition, for the PTCDA film, the dielectric function’s real partsare of higher values than those of the imaginary ones. It seems that there are some photon-electron interactions taking placewithin the PTCDA film material over the studied range of wavelengths according to the depicted variation of the filmdielectric function at varying photon energy. The dissipation factor tan for the PTCDA film showed dependency on thefilm’s thickness. The energy loss function of the free charge carriers traversing through the bulk of the PTCDA material wasfound to have the same behavior as when these charges traversing the surface of the PTCDA film, in particular at therelativity lower energy’s regions. However, the values of the VELF increase more rapidly than those of the SELF at particularpeaks, which characterized the film PTCDA material. For the PTCDA films subjected to this work, it was found that thevalues of the real part of the film’s optical conductivity 1 and the imaginary ones of its dielectric function 2 follow thesame pattern. These energy gaps are from 1.88 eV to 3.45 eV with the first energy gap value corresponds to the optical bandgap energyE goptof the film. The characteristic band gap structure of the PTCDA film seems to fit in general with thestandard behavior of the indirect optical transitions within organic semiconductor materials.1. ).References[1] Abdel-Aziz, M., Yahia, I., Wahab, L., Fadel, M., Afifi, M., 2006. Determination and analysis of dispersive optical constant of TiO2 and Ti 2 O 3 thin films. Applied Surface Science 252, 8163-8170.[2] Abelès, F., 1972. Optical properties of solids.[3] Aydın, C., El-Nasser, H., Yakuphanoglu, F., Yahia, I., Aksoy, M
Optical Properties of Nano-Rods PTCDA Thin Films: an Important Material for Optoelectronic Applications S. AlFaify1,*, Y. S. Rammah2, H. Y. Zahran1,3, F. Yakuphanoglu4 and Mohd. Shkir1 1Advanced Functional Materials & Optoelectronics Laboratory