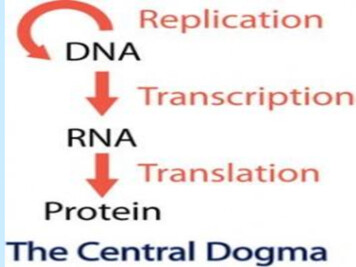
Transcription
Instant Demo GuideCisco dCloudCisco DNA Center Assurance 1.3 Instant DemoLast Updated: 23-August-2019About This Instant DemoThis guide for the preconfigured demonstration includes:About This Instant DemoRequirementsAbout This SolutionGet StartedScenario 1.Use Case 1: Operational InsightsScenario 2.Use Case 2: Client HealthScenario 3.Use Case 3: Device HealthScenario 4.Use Case 4: Application HealthScenario 5.Use Case 5: SensorsWhat’s Next? 2019 Cisco and/or its affiliates. All rights reserved. This document is Cisco Public Information.Page 1 of 33
Instant Demo GuideCisco dCloudRequirementsThe table below outlines the requirements for this preconfigured demonstration.RequiredOptionalLaptopCisco AnyConnect About This SolutionCisco DNA Center is the foundational controller and analytics platform at the heart of Cisco’s intent-basednetwork. It supports the expression of intent for multiple use cases, including base automation capabilities,fabric provisioning, and policy-based segmentation in the enterprise network. Cisco DNA Center brings contextto this journey through the introduction of Analytics and Assurance by providing end-to-end visibility into thenetwork with full context through data and insights.Cisco DNA Center enables the network administrator to: Design your network using intuitive workflows Define user and device profiles that facilitate secure access and network segmentation based on businessneeds Policy-based automation to deliver services to the network based on business priority and to simply devicedeployment Assure network performance with real-time and historical data analytics, to provide actionable insights anddetect problems before they happen along with Guided remediation actions for 100 Insights Design and Deploy Software-Defined Access (SD-Access) to simplifies delivery of consistent, highlysecure, identity-based policy for users and devices across wired and wireless networksThis enables the network admin to have a simplified integrated user experience across the entire enterpriseportfolio of products. 2019 Cisco and/or its affiliates. All rights reserved. This document is Cisco Public Information.Page 2 of 33
Instant Demo GuideCisco dCloudGet StartedFollow the steps to schedule a session of the content and configure your presentation environment.1. Open your browser (Chrome required) in Incognito Mode (to ensure your cache is empty).2. Log into dCloud, search for Cisco DNA Center Automation and Assurance v1.3.0 – Instant Demo and clickView.3. After connecting to the demo server, log in as demo /demo1234!NOTE: Alternately, you can use the Search Catalog box to search for the Instant Demo name. 2019 Cisco and/or its affiliates. All rights reserved. This document is Cisco Public Information.Page 3 of 33
Instant Demo GuideCisco dCloudScenario 1.Use Case 1: Operational InsightsValue Proposition: The following scenario demonstrates how to check the overall health of network devices,wired and wireless clients, the top 10 issues with guided remediation, and how to use ServiceNow integration.StepsOverall Health of the Network Devices and Health Scores for Wired and Wireless Clients1. From Chrome browser Incognito window open the DNA Center, navigate to Assurance Health Overall.NOTE: From this page, you can see the health of the network devices and clients in your organization over a24hr period. 2019 Cisco and/or its affiliates. All rights reserved. This document is Cisco Public Information.Page 4 of 33
Instant Demo GuideCisco dCloud2. To understand which sites have devices types with sub-optimal health scores, click Hierarchical View.3. To drill down by location to sites of interest, click Map View. 2019 Cisco and/or its affiliates. All rights reserved. This document is Cisco Public Information.Page 5 of 33
Instant Demo GuideCisco dCloud4. To view the Top 10 Issues based on their priority and occurrence, scroll down the pageNOTE: Several P1 related issues are impacting multiple users or devices across multiple sites.5. Click one of the issues from the list, and to see the suggested actions, in the pop out window, click aninstance for the selected issue.6. Select one of the links in the Issue Instance list to see the suggested actions based on this specific issue.7. To troubleshoot and resolve the issue follow the guided remediation. 2019 Cisco and/or its affiliates. All rights reserved. This document is Cisco Public Information.Page 6 of 33
Instant Demo GuideCisco dCloudNOTE: The guided remediation provides suggested actions based on our internal TAC database. These actionsrepresent what a TAC engineer would request if you were opening a service request with this specific issue. 2019 Cisco and/or its affiliates. All rights reserved. This document is Cisco Public Information.Page 7 of 33
Instant Demo GuideCisco dCloud8. Click Run and scroll down to see the additional output.ServiceNow integrationVALUE PROPOSITION: Now imagine if you were a level 1 operations engineer, and part of your responsibilitywas to provide ticket generation and resolution for issues impacting devices and users in your organization.Since we have integrated Cisco DNA Center with ServiceNow, the issues that were shown above in the top 10issues section have auto generated tickets in ServiceNow.1. Open a new Chrome Incognito browser tab and copy and paste enow/. 2019 Cisco and/or its affiliates. All rights reserved. This document is Cisco Public Information.Page 8 of 33
Instant Demo GuideCisco dCloud2. Click a ticket in ServiceNow that have been generated by Cisco DNA Center.3. To perform root cause analysis, click on the first issue and click the link that would cross-launch thespecific Cisco DNA Center Assurance page.4. Login as prompted.NOTE: We can also see all the details for the impacted device or client, along with the suggested actions for theguided remediation. 2019 Cisco and/or its affiliates. All rights reserved. This document is Cisco Public Information.Page 9 of 33
Instant Demo GuideCisco dCloud5. Return to the Cisco DNA Center Assurance Dashboard and navigate to Issues All Issues.NOTE: From this screen, we can see the different types of issue that fall under each category, along with theirinstances.6. Click on the Instances link for wireless client onboarding issues. 2019 Cisco and/or its affiliates. All rights reserved. This document is Cisco Public Information.Page 10 of 33
Instant Demo GuideCisco dCloudVALUE PROPOSITION: This allows us to drill down by site or device type and understand which clients arebeing impacted that could help quickly validate if the issues are isolated to a single site, or device type. If a newWindows patch or iOS software was recently deployed, we could quickly narrow this down by understanding ifthe issues are only impacting Windows or iOS device types. 2019 Cisco and/or its affiliates. All rights reserved. This document is Cisco Public Information.Page 11 of 33
Instant Demo GuideCisco dCloudScenario 2.Use Case 2: Client HealthVALUE PROPOSITION: It’s now 10am and there have been a couple of users opening tickets stating theycannot get connected to the wireless network. You need to quickly understand the overall health of all thewireless clients across the organization.StepsOverall Health of both wired and wireless clients1. Navigate to Assurance Health Client.NOTE: We can see the overall health of all the wired and wireless clients and can adjust the timeframe or goback in time if needed.NOTE: At the top of the screen, we can see a Sankey chart that shows how many total clients are in theenvironment, which clients are having issues and an indicator of what the issue is related to. 2019 Cisco and/or its affiliates. All rights reserved. This document is Cisco Public Information.Page 12 of 33
Instant Demo GuideCisco dCloud2. Under the Wireless Clients section, click View Details.3. To understand the clients impacted, click Authentication.NOTE: From here we can click on an individual client to view the client 360 page, but we’ll examine that later. 2019 Cisco and/or its affiliates. All rights reserved. This document is Cisco Public Information.Page 13 of 33
Instant Demo GuideCisco dCloud4. Close the pop out window.NOTE: In the middle of the page you can see additional information related to RF statistics. Each of these canbe viewed as a trend or with additional detail. 2019 Cisco and/or its affiliates. All rights reserved. This document is Cisco Public Information.Page 14 of 33
Instant Demo GuideCisco dCloudNOTE: At the bottom of the overall client page, you can see the individual clients and their status, connected ornot connected. You can also filter based on wired, wireless and/or their health score.Client 360VALUE PROPOSITION: A user Grace Smith opened a ServiceNow ticket stating she was not able to get on thewireless network with one of her devices but didn’t provide any additional details. Traditional troubleshootingmethods would require us to call Grace and gather additional details. We would need to ask what device typeshe was using, what is the MAC and IP address of the device, what was her location and the date/time theissue occurred, what SSID was she connecting to, was the issue with a specific application or networkconnectivity related.Let’s look how quickly we can answer these questions using client 360. 2019 Cisco and/or its affiliates. All rights reserved. This document is Cisco Public Information.Page 15 of 33
Instant Demo GuideCisco dCloud1. Navigate to the search engine icon in the top right corner and type Grace.2. Click on Grace.Smith and then click User 360.VALUE PROPOSITION: We can see her iPhone had some red indicators at times when her device was havingissues. We can adjust the sliding window to that specific timeframe. As we scroll across the graph, we can seeseveral pieces of important information: the device type, MAC Address, IP Address, Location, VLAN ID, RSSI,SNR, Tx/Rx, SSID, AP, Channel, and Band. This is all the information we would have needed to gather fromGrace without the client 360.NOTE: From the client 360 page, we can see all the devices Grace has on the network. 2019 Cisco and/or its affiliates. All rights reserved. This document is Cisco Public Information.Page 16 of 33
Instant Demo GuideCisco dCloud3. Scroll to the Event Viewer section to see a Broadcast Rekey issue.4.In the Event Viewer, expand the Broadcast Rekey and then click the Key Exchange.NOTE: This event viewer represents what we would see from the WLC CLI by issuing the debug client macaddress aaaa.bbbb.cccc in the wireless controller, however the event viewer provides a much simpler way tovisualize this information.5. Click the down arrow next to Event finder and scroll back up to Issues.6. Highlight the Issues for this client based on the timeframe selected.NOTE: The onboarding information shows the SSID and network devices in the path, along with their associatedhealth scores. 2019 Cisco and/or its affiliates. All rights reserved. This document is Cisco Public Information.Page 17 of 33
Instant Demo GuideCisco dCloud7. Expand the Onboarding section.8. Expand the Application Experience section.NOTE: We can see the applications Grace was using at the time and their associated health scores.9. Under Detail Information, click the iOS Analytics tab. 2019 Cisco and/or its affiliates. All rights reserved. This document is Cisco Public Information.Page 18 of 33
Instant Demo GuideCisco dCloudNOTE: At the bottom we see additional data regarding device details, connectivity and RF statistics, but moreimportantly the iOS analytics which provides a view of how the client sees the access point and the relateddisassociation reason codes. We are obtaining this information from the Cisco Apple partnership.10. Click through the Device Info, Connectivity, and RF tabs. 2019 Cisco and/or its affiliates. All rights reserved. This document is Cisco Public Information.Page 19 of 33
Instant Demo GuideCisco dCloudIntelligent Capture1. To find out why there was a key exchange issue, click on Intelligent Capture to examine the packetexchange between the AP and Client.2. Scroll to the top of the page and select Intelligent Capture.NOTE: From the Intelligent Capture page, we can visualize the roaming path of the client on a heat map. Alongwith the associated RF statistics for the timeframe specified above. 2019 Cisco and/or its affiliates. All rights reserved. This document is Cisco Public Information.Page 20 of 33
Instant Demo GuideCisco dCloud3. To see all the Anomalies for this client, click Anomaly.4. Expand the Broadcast Rekey issue and click KeyExchange.NOTE: When you click on the KeyExchange issue, the Auto Packet Analyzer will show the packet exchangebetween the client and access point. The triangles represent the packet direction. A triangle facing up is fromthe client to the AP, and a triangle facing down is from the AP to the client.NOTE: We can see from this packet analyzer that the client did not respond to an EAP challenge from the AP,therefore based on EAP timeout parameters the AP sent a Deauthentication frame to the client.5. To see additional details about the packet, scroll over the red bar on the bottom graph. 2019 Cisco and/or its affiliates. All rights reserved. This document is Cisco Public Information.Page 21 of 33
Instant Demo GuideCisco dCloudScenario 3.Use Case 3: Device HealthVALUE PROPOSITION: We think the EAP issue outlined in Use Case 2 could be related to poor RF conditionsfor the access point Grace was connected to at that time, but we need to confirm this hypothesis.StepsSpectrum Analysis1. Navigate to Assurance Health Network.NOTE: From this screen, we can see the overall health of the network devices in our environment.NOTE: We can also see the health scores of each network device in a list view at the bottom. We know Gracewas connected to the 4800 Access Point based on the client 360 information. 2019 Cisco and/or its affiliates. All rights reserved. This document is Cisco Public Information.Page 22 of 33
Instant Demo GuideCisco dCloud2. Click on the AP4800 from the Top N APs with High Interference dashboard. This will launch the device360 screen.3. Similar to the client 360, as we scroll across the graph for the given timeline we can see some importantdetails for this access point.NOTE: We can see the Noise, Air Quality Index, Interference, and Radio Utilization. From here we can quicklysee that the radio was experiencing interference.NOTE: We can further confirm this by looking at the RF tab at the bottom of the page. 2019 Cisco and/or its affiliates. All rights reserved. This document is Cisco Public Information.Page 23 of 33
Instant Demo GuideCisco dCloud4. Click the RF link under the chart.NOTE: RF details confirm the Radio 0 interference level was well above normal.5. To understand what was causing the interference, click on the Intelligent Capture view.6. Scroll to the top of the page and click Intelligent Capture. 2019 Cisco and/or its affiliates. All rights reserved. This document is Cisco Public Information.Page 24 of 33
Instant Demo GuideCisco dCloudNOTE: This view provides additional details regarding the channel utilization, frame count and frame errors.Understanding the management vs data frame count, the amount of Tx/Rx errors and noise floor is critical in awireless environment as these will directly impact the clients throughput and performance.7. Now click on the Spectrum Analysis tab.8. Click Start Spectrum Analysis. Click Yes at the warning. 2019 Cisco and/or its affiliates. All rights reserved. This document is Cisco Public Information.Page 25 of 33
Instant Demo GuideCisco dCloudNOTE: You will see the spectrum analysis data along with the interference source below.9. Click Stop Spectrum Analysis. Click X to close the window. 2019 Cisco and/or its affiliates. All rights reserved. This document is Cisco Public Information.Page 26 of 33
Instant Demo GuideCisco dCloudScenario 4.Use Case 4: Application HealthVALUE PROPOSITION: Grace has opened another ticket regarding issues with Microsoft Office 365. We needto get a quickly understand if this is impacting multiple users and what’s contributing to the application relatedissues.StepsApplication statistics1. Navigate to Assurance Health Application.NOTE: From this screen, we can see all the applications in use on the network along with their associated healthscores. 2019 Cisco and/or its affiliates. All rights reserved. This document is Cisco Public Information.Page 27 of 33
Instant Demo GuideCisco dCloud2. View the list view and the health score for each application at the bottom.3. Click select in section Type: All and in section Health: All to see the entire list, then click Apply.NOTE: We can see the ms-office-365 application has a health score of 2.4. Click on the ms-office-365 link.NOTE: Notice the details for the usage, throughput, DSCP Marking and loss and latency. 2019 Cisco and/or its affiliates. All rights reserved. This document is Cisco Public Information.Page 28 of 33
Instant Demo GuideCisco dCloud5. Click the Source Location radio button.NOTE: We can see from the information that the application is experiencing issues due to network latency being400ms. We can also see there are two users being impacted, Grace and Gordon. 2019 Cisco and/or its affiliates. All rights reserved. This document is Cisco Public Information.Page 29 of 33
Instant Demo GuideCisco dCloudScenario 5.Use Case 5: SensorsVALUE PROPOSITION: The network operations manager has informed you the CIO and several seniorexecutives will be meeting in the board room for the next couple days. He wants to make sure the wirelessenvironment in that area is performing as expected, and if there are any reported issues he needs to quicklyprove that wireless is not the problem. You’ve deployed several 1800s sensors in the area to proactivelyperform testing of the RF environment from a client’s perspective.StepsSensor Driven Test Capabilities1. Navigate to Assurance Manage Sensor-Driven Tests.2. Click Edit under Actions for the 1800s sensor.3. Leave the settings as displayed, and click Next at the bottom of the page. 2019 Cisco and/or its affiliates. All rights reserved. This document is Cisco Public Information.Page 30 of 33
Instant Demo GuideCisco dCloud5. Highlight the different testing capabilities of the sensor.6. Click Cancel and then confirm with OK.Overall Sensor Health1. Navigate to Assurance Dashboards Sensor.2. Highlight the overall sensor health, with the capabilities to understand how sensors are performing at eachlocation for each test typeNOTE: You can filter based on the SSID or Band of interest along with a specific timeframe. 2019 Cisco and/or its affiliates. All rights reserved. This document is Cisco Public Information.Page 31 of 33
Instant Demo GuideCisco dCloud 2019 Cisco and/or its affiliates. All rights reserved. This document is Cisco Public Information.Page 32 of 33
Instant Demo GuideCisco dCloud3. Highlight the different tests running and the capability to understand baselines and anomalies based on thetest results.What’s Next?Check out the related Cisco DNA Center proposal to learn how you can help to simplify network managementwhile providing actionable insights. 2019 Cisco and/or its affiliates. All rights reserved. This document is Cisco Public Information.Page 33 of 33
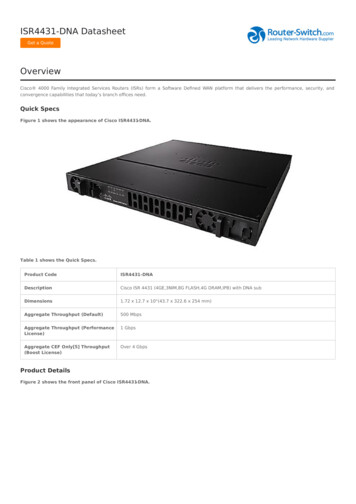
Cisco DNA Center is the foundational controller and analytics platform at the heart of Cisco’s intent-based network. It supports the expression of intent for multiple use cases, including base automation capabilities, fabric provisioning, and policy-based segmentation in the enterprise network.
