Transcription
2060th editionINVESTMENT COMPANYFA C T B O O KA Review of Trends and Activitiesin the Investment Company IndustryWWW.ICIFACTBOOK.ORG
2019 Facts at a GlanceTotal worldwide assets invested in regulated open-end funds* 54.9 trillionUnited States 25.7 trillionEurope 18.8 trillionAsia-Pacific 7.3 trillionRest of the world 3.1 trillionUS-registered investment company total net assets 26.0 trillionMutual funds 21.3 trillionExchange-traded funds 4.4 trillionClosed-end funds 278 billionUnit investment trusts 79 billionUS-registered investment companies’ share of:US corporate equity32%US and foreign corporate bonds21%US Treasury and government agency securities14%US municipal securities29%Commercial paper25%US household ownership of US-registered fundsNumber of households owning funds59.7 millionNumber of individuals owning funds103.9 millionPercentage of households owning fundsMedian mutual fund assets of mutual fund–owning householdsMedian number of mutual funds owned46.4% 150,0004US retirement marketTotal retirement market assetsPercentage of households with tax-advantaged retirement savingsIRA and DC plan assets invested in mutual funds 32.3 trillion63% 9.9 trillion*Regulated open-end funds include mutual funds, exchange-traded funds (ETFs), and institutional funds.
60th editionINVESTMENT COMPANYFA C T B O O KA Review of Trends and Activitiesin the Investment Company Industry
2060th editionINVESTMENT COMPANYFA C T B O O KA Review of Trends and Activitiesin the Investment Company IndustryWWW.ICIFACTBOOK.ORG
The Investment Company Institute (ICI) is the leading association representing regulated funds globally, includingmutual funds, exchange-traded funds (ETFs), closed-end funds, and unit investment trusts (UITs) in the UnitedStates, and similar funds offered to investors in jurisdictions worldwide. ICI seeks to encourage adherence to highethical standards, promote public understanding, and otherwise advance the interests of funds, their shareholders,directors, and advisers. ICI carries out its international work through ICI Global, with offices in London, Hong Kong,and Washington, DC.Although information and data provided by independent sources are believed to be reliable, ICI is not responsible fortheir accuracy, completeness, or timeliness. Opinions expressed by independent sources are not necessarily those ofthe Institute. If you have questions or comments about this material, please contact the source directly.Sixtieth editionCopyright 2020 by the Investment Company Institute. All rights reserved.
CONTENTSviiiLetter from the President and CEOxiiLetter from the Chief EconomistxviICI Research Staff and PublicationsPART ONEANALYSIS AND STATISTICS02List of Figures08Chapter OneWorldwide Regulated Open-End Funds28Chapter TwoUS-Registered Investment Companies54Chapter ThreeUS Mutual Funds78Chapter FourUS Exchange-Traded Funds102 Chapter FiveUS Closed-End Funds116 Chapter SixUS Fund Expenses and Fees138 Chapter SevenCharacteristics of US Mutual FundOwners158 Chapter EightUS Retirement and Education SavingsPART T WODATA TABLES192 List of Data Tables196 Section OneUS Mutual Fund Totals204 Section TwoUS Closed-End Funds, Exchange-TradedFunds, and Unit Investment Trusts210 Section ThreeUS Long-Term Mutual Funds230 Section FourUS Money Market Funds266 Appendix A290 Appendix B293 Glossary237 Section FiveAdditional Categories of US MutualFunds255 Section SixInstitutional Investors in the US MutualFund Industry258 Section SevenRetirement Account Investing inUS Mutual Funds260 Section EightWorldwide Regulated Open-EndFund Totals
LETTERFROM THEPRESIDENT & CEOPRESI
LETTERFROM THEIDENT&CEO
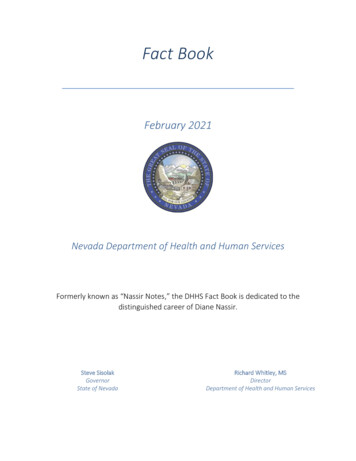
Letter from the President and CEOFor almost 80 years, collecting and communicating statistics on registered investmentcompanies have been critically important to the Investment Company Institute fulfilling itsmission to promote public understanding of funds and fund investing.Our first statistical collections date back to the 1940s, and we launched our Fact Bookpublication—then titled Investment Companies, a Statistical Summary—in 1958. But themodern era of ICI Research dates back more than 25 years, when the Institute decided toexpand and deepen its research capabilities and output.When I was general counsel of ICI in the mid-1990s, ICIPresident Matthew P. Fink tapped me to lead the effort to buildour Research Department. Adding to our statistical collectionand basic surveys, we first began by conducting an annualanalysis of trends in fund fees and expenses that continues tothis day. In subsequent years, we’ve expanded our work acrossmany dimensions—including the breadth of our statisticalcollection and reporting, the reach of our longitudinal andPaul Schott Stevens as ICIgeneral counsel in 1993.specialized surveys, and the depth of our analysis of industryand market trends in good times and bad. We have conductedgroundbreaking research into the US retirement system inwhich funds play an important part and empirical work on a wide variety of regulatory andother policy issues. And with the launch of ICI Global in 2011, our research entered a wholenew phase to serve a global membership and mission.All those years ago, we understood that ICI’s reputation would stand or fall on the accuracy,integrity, relevance, and timeliness of our research and analysis. Our commitment to thesevalues has been the foundation of all our research activities since. It is therefore a sourceof some satisfaction that ICI today is regarded as an important source for understandingour industry.viii2020 IN VE STME N T COMPAN Y FACT BOOK
Today, ICI conducts research on a scale that few associations anywhere can match. We offermore publicly available data on regulated investment companies than any other privatesource. ICI’s data are cited by publications around the globe virtually every day. And theinsights of our research permeate nearly all the work that the Institute does—grounding ourpolicy recommendations in hard data and rigorous analysis and giving the Institute credibilityas an advocate on behalf of funds and their investors. In times of the worst stress, like thefinancial crisis of 2007–2009 and the current COVID-19 pandemic, ICI Research assumes evengreater importance.I’m immensely proud of the course that ICI Research has taken during my time at ICI. Overthe years, I was privileged to work with chief economists John Rea and Brian Reid and ageneration of research staff. Today’s team, led by Chief Economist Sean Collins, dedicatedsenior staff Judy Steenstra, Sarah Holden, and Shelly Antoniewicz, with a brilliant group ofeconomists and researchers, works hard every day to provide information and perspective onissues of vital importance to millions of fund shareholders.This 2020 Investment Company Fact Book—the 60th edition—is just one example of thecritically important work produced by ICI Research. After eight decades of data collectionand six decades of the Fact Book resource, ICI Research will continue to carry on this greattradition. And I will always take tremendous pleasure and pride in having helped to lay thatfoundation for the benefit of funds and investors for decades to come.Paul Schott StevensICI President and CEOThen and Now: ICI Chief EconomistsAlfred Johnson1968*–1988Jacob Dryer1988–1994John Rea1994–2005Brian Reid2005–December 2017Sean CollinsJanuary 2018–present*1968 is the year Alfred Johnson began working at ICI. It is unclear in our records when he first held the chief economist title.L E T T E R F ROM T H E PR ES ID EN T AND CEOix
LETTERFROM THECHIEF ECONOMISTECONO
LETTERFROM THECHIEFOMIST
Letter from the Chief EconomistThis year, we mark the 60th edition of the Investment Company Institute’s annual InvestmentCompany Fact Book.*As I reviewed our Fact Book library in anticipation of writing this letter, it wasn’t hard to seeboth the evolution of Fact Book as a publication and the evolution of its content reflectingthe development of the industry it chronicles. Much has changed.For example, about 60 years ago, assets in equity and bond mutual and closed-end fundstotaled 21 billion, or about 4 percent of US gross domestic product (GDP). Products such asmoney market funds, index funds, exchange-traded funds (ETFs), and target date and lifestylefunds weren’t yet a figment in anyone’s imagination. In 2019, assets in all US‑regulated fundstotaled more than 26 trillion, about 120 percent of GDP (see pages xiv–xv).As the industry goes, so goes our Fact Book. If you pick up any ofour early editions, you will immediately note their slenderness—almost like a pamphlet—at fewer than 25 pages, fewer than 10 chartsand tables, and printed in black and white. There also was a heavyemphasis on marketing and education. Text focused on things such asacquainting investors with mutual fund features and concepts, somenow antiquated (“What are accumulation, voluntary, and contractualfund plans?”).This year’s Fact Book is more than 300 pages, has nearly 200 charts and tables, and is infull color. And as funds have become thoroughly woven into the financial life of so manyAmericans, Fact Book has shifted away from marketing to deep financial analysis and hasexpanded to keep pace with industry growth and developments. For example, we have addedchapters devoted to the worldwide fund industry (chapter 1), ETFs (chapter 4), closed-endfunds (chapter 5), characteristics and behavior of fund investors (chapter 7), and the vastmarket for retirement-related products (chapter 8). The review of the previous calendaryear’s developments in mutual funds (chapter 3) is itself 24 pages—about as long as the earlyeditions of Fact Book in their entirety.* This effort began in 1958, when the National Association of Investment Companies (NAIC; one of the earliernames of ICI) published its first compilation of data. That data collection became an annual series (except, ourrecords show, for a few years in the 1960s) known as the Mutual Fund Fact Book.xii2020 IN VE STME N T COMPAN Y FACT BOOK
But it was satisfying to see that some things remain the same—as Fact Book and the industryhave developed and matured, the dedicated constants of both haven’t changed. Fact Bookis still the most objective, valuable source of data and information on the scale, operations,and uses of mutual funds and other investment companies. And the industry continuesto serve Main Street investors, earning and keeping their trust, and helping them save forlong‑term goals through a wide array of financial products.The last thing that I noted in my Fact Book review was the degree to which it has reflectedthe role of funds in the financial markets. The reactions of funds and their investors to suchstressful financial events as the 1970s energy crisis, Black Monday in 1987, the dot-combubble, and the global financial crisis of 2007–2009 help inform and provide context forour economic analysis of current events. That said, you won’t find discussion in this 60thedition of Fact Book of the impact of COVID-19 on the industry. The Fact Book deals with thedevelopments and data of the previous calendar year—in this case, through December 2019.So, while our weekly, monthly, and quarterly releases track the effects of the pandemic onfunds and investors, next year’s Fact Book will provide the annual overview.Beyond that, in today’s unprecedented circumstances, we, like the industry at large, haveneeded to adopt new approaches to complete our work. For example, our dedicated Research,Content, and Design teams have labored remotely to deliver this essential resource.Another new aspect has been our decision to initially publish this year’s Fact Book onlyonline, with a print edition to appear when pandemic-related restrictions recede. I lookforward to seeing this year’s print edition in our library. And I know another ICI chiefeconomist in decades to come will turn to it in contemplation of the evolution of the industryand of Fact Book.In the meantime, please read the first electronic-only version of the Fact Book, and know thatyou have our best wishes for your health and well-being.Sean CollinsICI Chief EconomistL E T T E R F ROM T H E CH IEF ECO N O M IS Txiii
US FUND INDUSTRY SNAPSHOTTHENTotal net assets of registered investment companies* Mutual fund–owning households that identified retirementas the primary reason for investing in mutual funds† Median age of mutual fund–owning households† *†xiv2020 IN VE STME N T COMPAN Y FACT BOOK
US FUND INDUSTRY SNAPSHOTNOWTotal net assets of registered investment companies Mutual fund–owning households that identified retirementas the primary reason for investing in mutual funds Median age of mutual fund–owning householdsT HE N A N D N OW: U S FU ND IND U S T RY S NAPS H OT xv
ICI Research Staff and PublicationsICI Senior Research StaffChief EconomistSean Collins leads the Institute’s Research Department. He overseesstatistical collections and research on US and global funds, financialmarkets, the US retirement market, financial stability, and investordemographics. Before joining ICI in 2000, Collins worked at the US FederalReserve Board of Governors and the Reserve Bank of New Zealand. Heis a member of the Group of Economic Advisers (GEA) to the EuropeanSecurities and Markets Authority (ESMA). He has a PhD in economics fromthe University of California, Santa Barbara, and a BA in economics fromClaremont McKenna College.Senior Director of Industry and Financial AnalysisRochelle (Shelly) Antoniewicz leads the Institute’s research efforts onthe structure and trends of the exchange-traded fund and mutual fundindustries and on the financial markets in the United States and globally.Before joining ICI, Antoniewicz spent 13 years at the Federal ReserveBoard of Governors. She earned a BA in management science from theUniversity of California, San Diego, and an MS and PhD in economics fromthe University of Wisconsin–Madison.Senior Director of Retirement and Investor ResearchSarah Holden leads the Institute’s research efforts on investordemographics and behavior and retirement and tax policy. Holden, whojoined ICI in 1999, heads efforts to track trends in household retirementsaving activity and ownership of funds as well as other investmentsinside and outside retirement accounts. Before joining ICI, Holdenserved as an economist at the Federal Reserve Board of Governors. Shehas a PhD in economics from the University of Michigan and a BA inmathematics and economics from Smith College.Senior Director of Statistical ResearchJudy Steenstra oversees the collection and publication of weekly, monthly,quarterly, and annual data on open-end mutual funds, as well as data onclosed-end funds, exchange-traded funds, unit investment trusts, and theworldwide fund industry. Steenstra joined ICI in 1987 and was appointeddirector of statistical research in 2000. She has a BS in marketing fromThe Pennsylvania State University.xvi2020 IN VE STME N T COMPAN Y FACT BOOK
ICI Research DepartmentThe ICI Research Department consists of 42 members, including economists and researchanalysts. This staff collects and disseminates data for all types of registered investmentcompanies, offering detailed analyses of fund shareholders, the economics of investmentcompanies, and the retirement and education savings markets.2019 ICI Research and Statistical PublicationsICI is the primary source of analysis and statistical information on the investment companyindustry. In addition to the annual Investment Company Fact Book, the Institute’s ResearchDepartment released 17 research and policy publications and more than 300 statisticalreports in 2019.The Investment Company Fact Book remains one of ICI Research’s most visible products.In its 60th edition, this ICI publication continues to provide the public and policymakerswith a comprehensive summary of ICI’s data and analysis. The Fact Book is availableat www.icifactbook.org in both PDF and HTML formats. The HTML version containsdownloadable data for all charts and tables.PapersIndustry and Financial Analysis» “Trends in the Expenses and Fees of Funds, 2018,” ICI Research Perspective, March 2019» “The Closed-End Fund Market, 2018,” ICI Research Perspective, April 2019» “Proxy Voting by Registered Investment Companies, 2017,” ICI Research Perspective,July 2019» “Ongoing Charges for UCITS in the European Union,” ICI Research Perspective,September 2019Retirement and Investor Research» “American Views on Defined Contribution Plan Saving, 2018,” ICI Research Report,February 2019» “Defined Contribution Plan Participants’ Activities, First Three Quarters of 2018,” ICIResearch Report, February 2019» “What US Households Consider When They Select Mutual Funds, 2018,” ICI ResearchPerspective, May 2019» “Defined Contribution Plan Participants’ Activities, 2018,” ICI Research Report, May 2019» The BrightScope/ICI Defined Contribution Plan Profile: A Close Look at 401(k) Plans, 2016,June 2019» “The Economics of Providing 401(k) Plans: Services, Fees, and Expenses, 2018,” ICIResearch Perspective, July 2019I C I RE S E A RC H S TAFF AND PU B LICAT IO N Sxvii
» “Who Participates in Retirement Plans, 2016,” ICI Research Perspective, August 2019» “Defined Contribution Plan Participants’ Activities, First Quarter 2019,” ICI ResearchReport, August 2019» “Characteristics of Mutual Fund Investors, 2019,” ICI Research Perspective, October 2019» “Ownership of Mutual Funds, Shareholder Sentiment, and Use of the Internet, 2019,” ICIResearch Perspective, October 2019» “Profile of Mutual Fund Shareholders, 2019,” ICI Research Report, December 2019» “The Role of IRAs in US Households’ Saving for Retirement, 2019,” ICI Research Perspective,December 2019» “Defined Contribution Plan Participants’ Activities, First Half 2019,” ICI Research Report,December 2019ICI’s papers and more are available at www.ici.org/research.Analysis and Commentary: ICI ViewpointsIn addition to research papers, ICI staff produce analysis and commentary for the Institute’sblog, ICI Viewpoints. Below are some examples of the analysis published in 2019. Please visitwww.ici.org/viewpoints to find these and more.» Corporate and Investment Grade Bond Funds: What’s in a Name?» From December Outflows to January Inflows: Seasonal Factors in Mutual Fund Flows» Americans: In Defined Contribution We Trust» IRA: Will You Be Mine?» It’s 5/29—Are You Taking Full Advantage of College Savings Opportunities?» Mind the Gap» IRA Investors Are Concentrated in Lower-Cost Mutual Funds» Three Bs or Not Three Bs: Revisiting Claims That Investment Grade Corporate Bond FundsPose Financial Stability Risks» Happy Birthday, IRA! Congratulations on 45 Years» Five Key Points on 401(k) Plan Fees from ICI Research» Talkin’ ’Bout the Generations: ICI Research on Mutual Fund Ownership by Generationxviii2020 IN VE STME N T COMPAN Y FACT BOOK
Statistical ReleasesTrends in Mutual Fund InvestingMonthly report that includes mutual fund sales, redemptions, assets, cash positions,exchange activity, and portfolio transactions for the period by 42 investment objectives.Estimated Long-Term Mutual Fund FlowsWeekly report that provides aggregate estimates of net new cash flows to 16 categories ofequity, hybrid, and bond mutual funds.Estimated Exchange-Traded Fund (ETF) Net IssuanceWeekly report that provides aggregate estimates of net issuance to six categories of ETFs.Combined Estimated Long-Term Mutual Fund Flows and ETF Net IssuanceWeekly news release and report that provides aggregate estimates of net new cash flows andnet issuance to six categories of long-term mutual funds and ETFs.Money Market Fund AssetsWeekly report on money market fund assets by type of fund.Monthly Taxable Money Market Fund Portfolio DataMonthly report based on data contained in SEC Form N-MFP that provides insights into theaggregated holdings of prime and government money market funds and the nature andmaturity of security holdings and repurchase agreements.Retirement Market DataQuarterly report that includes individual retirement account (IRA) and defined contribution(DC) plan assets, mutual fund assets inside retirement accounts, and estimates of mutualfund net new cash flows from retirement accounts by type of fund.Mutual Fund DistributionsQuarterly report that includes paid and reinvested capital gains and paid and reinvestedincome dividends of mutual funds by broad investment classification.Institutional Mutual Fund Shareholder DataAnnual report that includes mutual fund asset information for various types of institutionalshareholders, broken out by broad investment classification.Closed-End Fund DataQuarterly report that includes closed-end fund assets, number of funds, issuance,redemptions, distributions, use of leverage, and number of shareholders by investmentobjective.I C I RE S E A RC H S TAFF AND PU B LICAT IO N Sxix
Exchange-Traded Fund DataMonthly report that includes assets, number of funds, issuance, and redemptions of ETFs byinvestment objective.Unit Investment Trust DataMonthly report that includes the value and number of new trust deposits by type andmaturity.Worldwide Regulated Open-End Fund DataQuarterly report that includes assets, number of funds, and net sales by broad investmentclassification of funds in 47 jurisdictions worldwide.These and other ICI statistics are available at www.ici.org/research/stats. To subscribe to ICI’sstatistical releases, visit www.ici.org/pdf/stats subs order.pdf.AcknowledgmentsPublication of the 2020 Investment Company Fact Book was directed by James Duvall,economist, and Judy Steenstra, senior director of statistical research, working withMiriam Bridges, editorial director, Candice Gullett, editor, and Erica Walborn, designer.Contributors from ICI’s research team who developed and edited analysis, text, and data wereIrina Atamanchuk, Steven Bass, Mike Bogdan, Sheila McDonald, Doug Richardson, Casey Rybak,Dan Schrass, and Christof Stahel.xx2020 IN VE STME N T COMPAN Y FACT BOOK
Morris MitlerIn Memoriam1979–2019Morris Mitler was an economist in industry and financial analysis at theInvestment Company Institute. He was a core part of the InvestmentCompany Fact Book team during his entire tenure at ICI, and for two ofthose years, he directed the publication of the Fact Book.Morris is missed every day by his colleagues, and his absence wasparticularly felt during this year’s Fact Book season. We devote manyhours each year to putting together Fact Book, and a lot of that timeis spent in deep collaboration with the entire team. We missed hisfriendship, his stories, his humor, his enthusiasm, his generosity, hishumility, and his care for his work.He was beloved by his colleagues. He was a friend to us all.—ICI’s Fact Book teamI C I RE S E A RC H S TAFF AND PU B LICAT IO N Sxxi
PART ONEANALYSIS &STATISTICSSTATIS
ANALYSIS&STICS
FIGURESCHAPTER ONEWorldwide Regulated Open-End Funds11Figure 1.1Total Net Assets of Worldwide RegulatedOpen-End Funds Rose to 54.9 Trillionin 201912Figure 1.2Stock Markets Rose Around the Worldin 201913Figure 1.3Impact of Changes in the Exchange Rateon the US Dollar Value of a EuropeanStock14Figure 1.4Net Sales of Regulated Open-EndLong‑Term Funds Increased in 201916Figure 1.5Worldwide Net Sales of RegulatedOpen‑End Bond Funds Surged in 201918Figure 1.6Investors in UCITS Pay Below-AverageOngoing Charges19Figure 1.7Worldwide Net Sales of Money MarketFunds20Figure 1.8Number of Worldwide Regulated OpenEnd Funds21Figure 1.9Total Net Assets of Worldwide RegulatedOpen-End Funds24Figure 1.10Countries with More-Developed EquityMarkets Tend to Have More-DevelopedFund Industries26Figure 1.11US Households Hold More of TheirWealth in Regulated Funds; Bank-CentricCountries Have a Lower Share27Figure 1.12Worldwide Regulated Open-End FundShare of Worldwide Equity and DebtMarkets35Figure 2.6Money Market Funds Managed18 Percent of US NonfinancialBusinesses’ Short‑Term Assets in 201937Figure 2.7Investment Companies ChannelInvestment to Stock, Bond, and MoneyMarketsCHAPTER T WOUS-Registered Investment Companies30Figure 2.1Number of Investment Companies byType31Figure 2.2Investment Company Total Net Assetsby Type32Figure 2.3The Majority of US Mutual Fund and ETFTotal Net Assets Were in Equity Funds39Figure 2.4Share of Household Financial AssetsHeld in Investment CompaniesFigure 2.8Index Funds Have Grown as a Share ofthe Fund Market40Figure 2.5Mutual Funds in Household RetirementAccountsFigure 2.9Index Fund Share of US Stock Market IsSmall42Figure 2.10Total Net Assets and Number of UITs333422020 IN VE STME N T COMPAN Y FACT BOOK
43Figure 2.11More Than 80 Percent of FundComplexes Were Independent FundAdvisers44Figure 2.12Number of Fund Sponsors45Figure 2.13Positive Net New Cash Flow toLong‑Term Mutual Funds and PositiveNet Share Issuance of ETFs46Figure 2.14Share of Mutual Fund and ETF Assets atthe Largest Fund Complexes47Figure 2.15Number of Mutual Funds and ETFsEntering and Leaving the Industry52Figure 2.16Number and Total Net Assets of FundsThat Invest According to ESG Criteria69Figure 3.10Bond Mutual Funds Have ExperiencedNet Inflows Through Most of the PastDecadeCHAPTER THREEUS Mutual Funds56Figure 3.1Equity Mutual Funds Held More ThanHalf of Mutual Fund Total Net Assets57Figure 3.2Number of Mutual Funds Entering andExiting the Industry7158Figure 3.3Households Held 89 Percent of MutualFund Total Net AssetsFigure 3.11Net New Cash Flow to Hybrid MutualFunds7359Figure 3.4Net New Cash Flow to Mutual FundsFigure 3.12Net New Cash Flow to Index MutualFunds7362Figure 3.5Net New Cash Flow to Equity MutualFunds Typically Has Been Related toWorld Equity ReturnsFigure 3.13Index Equity Mutual Funds ContinuedTheir Steady Growth74Figure 3.14Some of the Outflows from DomesticEquity Mutual Funds Have Gone to ETFs75Figure 3.15Fee-Based Advisers Are Driving LargerPortions of Client Portfolios TowardETFs63Figure 3.6Net New Cash Flow to Equity MutualFunds in 201965Figure 3.7Turnover Rate Experienced by EquityMutual Fund Investors76Figure 3.8Net New Cash Flow to Bond MutualFunds Typically Is Related to BondReturnsFigure 3.16Assets of Large 401(k) Plans AreIncreasingly Held in CollectiveInvestment Trusts77Figure 3.9Net New Cash Flow to Bond MutualFunds in 2019Figure 3.17Net New Cash Flow to Money MarketFunds in 201977Figure 3.18Net Yields of Money Market Funds FarExceeded MMDA Rates Even at the Endof 20196667F I GURE S3
CHAPTER FOURUS Exchange-Traded Funds83Figure 4.1The United States Has the Largest ETFMarket95Figure 4.8Net Share Issuance of ETFs RemainedStrong in 201984Figure 4.2Total Net Assets and Number of ETFs9686Figure 4.3Creation of ETF SharesFigure 4.9Net Share Issuance of ETFs byInvestment Classification9789Figure 4.4The Secondary Market Has Many ETFLiquidity ProvidersFigure 4.10Total Net Assets of ETFs WereConcentrated in Large-Cap DomesticStocks92Figure 4.5Most ETF Activity Occurs on theSecondary Market98Figure 4.11Number of ETFs Entering and Exiting theIndustry93Figure 4.6ETF Secondary Market Trading Averaged26 Percent of Daily US Stock Trading in201999Figure 4.12ETF-Owning Households Held a BroadRange of Investments94Figure 4.7Domestic Equity ETFs Have Had MinimalImpact on Underlying US Stocks100 Figure 4.13Characteristics of ETF-OwningHouseholds101 Figure 4.14ETF-Owning Households Are Willing toTake More Investment RiskCHAPTER FIVEUS Closed-End Funds105 Figure 5.1Total Assets of Closed-End Funds Were 278 Billion at Year-End 2019106 Figure 5.2Composition of the Closed-End FundMarket by Investment Objective107 Figure 5.3Closed-End Fund Net Share Issuance108 Figure 5.4Closed-End Fund Distributions109 Figure 5.5Closed-End Funds Are EmployingStructural Leverage and Some Types ofPortfolio Leverage4110 Figure 5.6Preferred Shares Constituted theMajority of Closed-End Fund StructuralLeverage111 Figure 5.7Use of Portfolio Leverage113 Figure 5.8Closed-End Funds’ Premium/DiscountRate114 Figure 5.9Closed-End Fund Investors Owned aBroad Range of Investments115 Figure 5.10Closed-End Fund Investors HadAbove‑Average Household Incomes andFinancial Assets2020 IN VE STME N T COMPAN Y FACT BOOK
CHAPTER SIXUS Fund Expenses and Fees119 Figure 6.1Expense Ratios Incurred by Mutual FundInvestors Have Declined SubstantiallySince 2000120 Figure 6.2Mutual Fund Expense Ratios Tend to Fallas Fund Assets Rise121 Figure 6.3Fund Shareholders Paid Below-AverageExpense Ratios for Equity Mutual Funds122 Figure 6.4Total Net Assets Are Concentrated inLower-Cost Mutual Funds124 Figure 6.5Mutual Fund Expense Ratios Vary AcrossInvestment Objectives126 Figure 6.6Total Net Assets and Number of IndexMutual Funds Have Increased in RecentYears127 Figure 6.7Expense Ratios of Actively Managed andIndex Mutual Funds Have Fallen129 Figure 6.8Expense Ratios Incurred by Index ETFInvestors Have Declined in Recent Years130 Figure 6.9Index ETF Expense Ratios Vary AcrossInvestment Objectives134 Figure 6.10Institutional No-Load Share ClassesGarnered Positive Net New Cash Flow in2019135 Figure 6.11Gross Sales of Long-Term Mutual FundsAre Concentrated in No-Load ShareClasses136 Figure 6.12Total Net Assets of Long-Term MutualFunds Are Concentrated in No-LoadShare ClassesCHAPTER SEVENCharacteristics of US Mutual Fund Owners140 Figure 7.1About 45 Percent of US HouseholdsOwned Mutual Funds in 2019145 Figure 7.6Majority of Mutual Fund Investors Focuson Retirement141 Figure 7.2Characteristics of Mutual Fund Investors147 Figure 7.7Mutual Fund Investments OutsideRetirement Plans Are Often Guided byInvestment Professionals142 Figure 7.3Incidence of Mutual Fund OwnershipIs Greatest Among the Baby BoomGeneration and Generation X143 Figure 7.4The Baby Boom Generation Holds MoreThan Half of Household Mutual FundAssets144 Figure 7.5About Half of Households OwningMutual Funds Have Moderate or LowerIncomesF I GURE S148 Figure 7.8Mutual Fund Investors Purchase MutualFunds Through a Variety
companies have been critically important to the Investment Company Institute fulfilling its mission to promote public understanding of funds and fund investing. Our first statistical collections date back to the 1940s, and we launched our . Fact Book. publication—then titled . Investment