Transcription
Repligen Corporation“Inspiring Advances in Bioprocessing”Craig-Hallum Institutional Investor ConferenceMay 30, 2018
Safe HarborThis presentation contains forward looking statements which are made pursuant to the safe harbor provisionsof Section 27A of the Securities Act of 1933, as amended, and Section 21E of the Securities Exchange Act of 1934,as amended. These statements are subject to risks and uncertainties which may cause our plans to change oractual results to differ materially from those anticipated. In particular, unforeseen events outside of our controlmay adversely impact future results. Additional information concerning these factors is discussed in our reportsfiled with the Securities and Exchange Commission including recent Form 8-Ks, our most recent Annual Report onForm 10K and our most recent Quarterly report on Form 10Q. The forward looking statements in thispresentation reflect management’s current views and may become obsolete as a result of new information,future events or otherwise. We may not update such forward looking statements to reflect a change of events orcircumstances that occur after the date hereof, except as required by law. The industry and market datacontained in this presentation are based on management’s own estimates, independent publications,government publications, reports by market research firms or other published independent sources, and, in eachcase, are believed by management to be reasonable estimates. Although we believe these sources are reliable,we have not independently verified the information.2
Company Overview
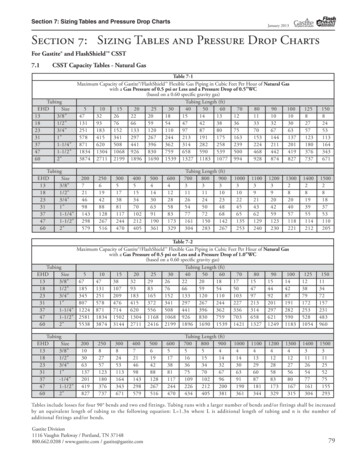
LeadingInnovator inBioprocessing Repligen provides innovative bioprocessing technology and solutions tobiologic drug manufacturers worldwide We are focused on flexible, disposable and easy-to-implement productsthat enable production efficiencies and cost savings 3 main growth drivers:Organic GrowthAcquisitionsBiologics MarketInternal innovation,commercial leverageTechnology focus,strict financial criteriaStrong expandingmarketOPUS 60 RXCell ATF 10 suTangenX TFF cassettesSpectrum KR2i TFF System4
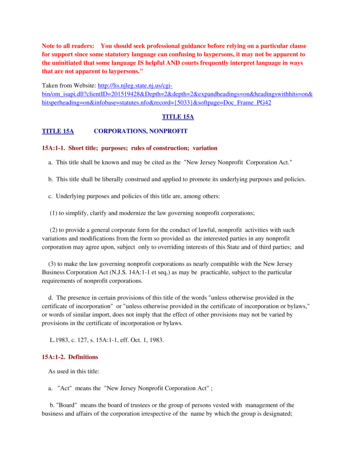
Historicallya OEM supplier,we are majorityDirect Salestoday201386% OEM2015201763% OEM38% OEM 47.5M 83.5M 141.2M52.7% gm57.8% gm55.7% gross marginProteins (OEM)Chromatography (Direct)Filtration (Direct)Other (Direct) Direct sales became majority of revenue in 2017: 62% and growing Reflects strategic plan, impact of new product development andacquisitions in our Chromatography and Filtration franchises 5-year bioprocessing revenue CAGR of 36% (2012-2017)5
OurBlueprint:GrowthThroughExcellenceCustomer Satisfaction “First”Expanded Global Presence Single-use and continuous technology Flexible and easy-to-implement Custom solutions when required 7 manufacturing sites, 485 employeesNorth America, Europe, AsiaPac field teamsCapacity to meet increasing demandYield 25%Cost 45%Technology &Market Leadership2018Revenue 182M- 188Mest. 30%New Market Opportunitiesbeyond monoclonal antibodiesSpectrum KR2i TFF SystemOPUS Pre-packed columns Recombinant proteinsVaccinesGene therapiesCell therapies6
Executing onour VisionLEAD IN FILTRATIONLEAD IN CHROMATOGRAPHYLEAD IN PROTEINS 850 Market8%-10% Share 180M PPC Market 40% Converted: RGEN 45% 500- 600M Market10%-15% Share15%-20%20% est. Revenue growth in 20185%est. Revenue growth in 2018est. Revenue growth in 2018We “own” the perfusion spaceMarket leader in pre-packed columnsMarket leader in Protein A Ligands 95% INITIATIVESINITIATIVESINITIATIVESExpand to fed-batch, take share in UF/DFExpand OPUS portfolioContinue to invest in ligands and resinsCONTINUE STRATEGIC M&AWinning Share in 1.5B AddressableMarketOEM2023Directo Goal to reach 400- 500M inrevenue by 2023, with 80% Directo Combination of organic growthinternal innovation and M&A7
Recent Business Highlights
2017 :An OutstandingYear Acquired Spectrum Inc.o Hollow-fiber expertise, commercial expansion Raised 129 million through a follow-on offering Significant contribution from 2016/2017 acquisitionso Atoll GmBH (Chromatography), TangenX (Filtration), Spectrum (Filtration) Launched innovative new products in direct portfolioso XCell ATF 10 single-use (large-scale) , OPUS R with resin recovery Delivered strong financial performanceo Revenue: 141.2M, 35% year-over-yearo FD EPS: GAAP 111%, Adjusted 41% to 0.69Spectrum hollow-fiber filters9
Off toA StrongStart in 2018First Quarter Performance Reported record revenue of 44.8M, up 46% year-over-year Spectrum contributed 11.7 million to Q1 revenue Organic growth for Direct products exceeded 20% Encouraging sequential growth and forecasts for Proteins (OEM) Gross margin expansion (56.1% GAAP, 56.6% non-GAAP was 110 bps) Net income growth ( 3.4M GAAP, 7.5M non-GAAP was 43% year-over-year) Raised guidance on revenue, net income, EPS Launched OPUS 80R, one of several new products planned for the year10
M&A Highlights
SpectrumAcquisition(Aug. 2017) Significantly increased our total addressable market to 1.5B Adds leading player in hollow fiber filtration; single-use cartridges and systems More than doubles our annual Filtration revenue Contributed 19.4M for 5 mo. of ownership in 2017 Expecting 47- 50M in revenue for 2018 Expands our direct sales organization, adds direct presence in Asia Broadens our R&D engine to drive next-generation filtration products Expands our end markets beyond mAbs:12
DisciplinedAcquisitionCriteria Technology leadership in bioprocessing Strengthens, expands Repligen portfolio Underinvested in some area (commercial, R&D, infrastructure);opportunity to leverage Repligen organization Strong revenue growth, margins in line with or above corporate average Potential to be adjusted EPS accretive in first full year post-acquisitionCumulative revenuefrom acquisitions2014-2017: 100MAtoll GmBHTangenX TechnologySpectrum, Inc.Process development scalepre-packed columnsexpand OPUS PPCbusiness(downstream)Sius single-use TFFcassettes complementXCell ATF upstream, addadjacent product to OPUS PPC (downstream)KrosFlo hollow-fiber TFF cartridgesand systems add upstream anddownstream filtration capabilities.Complements current filtrationfranchise and expands applications.OPUS PDApril 2016Spectrum KML 100SIUS TFFcassettes & holdersDecember 2016August 201713
PostAcquisition InternalR&D DrivesAdditionalGrowth XCell ATF single-use (su) Built off of ATF stainless steel foundationacquired from Refine in 2014Building brand leadershipthrough innovation Complete redesign of ATF portfolio Focus on single-use solutions Single-use family launch 2016-2017 ATF su now in 2, 6 and 10 cmIn 2017, 15% ofXCell ATF saleswere single-use(first full year su) Scalable from bench to commercialsu XCell ATF 10 with controller14
Strong End Markets
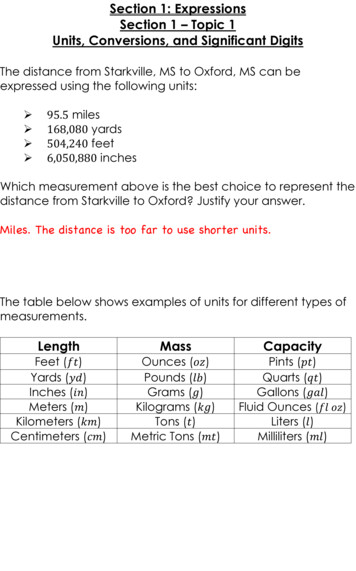
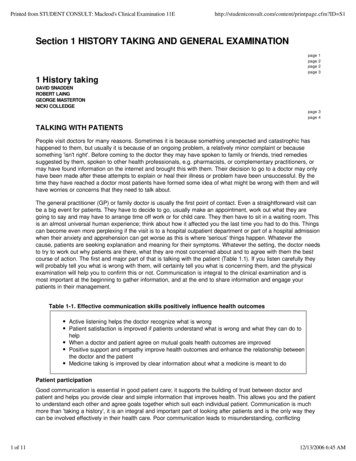
16The globalcommercial marketfor biologics was 169B in 2016This includes the 103B market formonoclonalantibodies (mAbs) Robust pipeline to sustainstrong commercial marketgrowth 72 mAbs approved, 300in development A record 10 new mAbswere approved by FDA in2017, plus 4 biosimilarmAbs Repligen products areembedded in the biologicsmanufacturing workflow atmultiple pointsBiosimilar mAbsFusion ProteinsmAbs14412Number of U.S. FDA approvalsSteady Growthin the Marketfor Biologics,including mAbs10826Source: FDA.gov, internal research, as of 12/15/1710942Note: 4 biosimilar mAbs were FDA approved in2017; 2 “firsts” (versions of Avastin and Herceptin)and 2 “additional” biosimilar approvals (versions ofHumira, Remicade)3761222012201302014201520162017Chart includes biosimilar approvals, excludes label expansions16
ManufacturingFacility Trendsto MeetIncreasedDemand With increased biologic drug development, manufacturing facilitiesare modernizing to increase output, control costs, allow for quickchangeover Flexibility and ease-of-use are critical requirements for ourbiopharma and CMO customers Mammalian cell manufacturing capacity is expected to increase by48% over the next 4 yearsIncreasing adoptionof single-useproducts andcontinuous processes Increasingly, biologics manufacturers are installing larger single-usebioreactors (e.g. 2,000 L) in multiple train configurations for moreefficient production There is increasing use of continuous processing in upstream anddownstream manufacturing These trends opportunity for Repligen products and innovationSource: Bioprocess Technology Consultants, September 2017 presentation17
Our Direct to Customer Brands
Also for use inconcentratedfed-batch, n-1 Clinical andcommercialprocesses Used in biologicsdevelopment &manufacturing,gene therapy,vaccineproduction Clinical andcommercialprocesses 80% costreduction,50% laborreduction,75% lessbuffer use Low-cost, highperformancealternative Clinical andcommercialprocesses Leader of thepack in resinchoice and size From processdevelopment tolarge-scalecommercialapplications Experts in columnpacking Primarily clinicalprocesses bydesignELISA Quantitation Kits Enablescontinuousprocessing ProConnex modules, bagsand tubing sets First purposebuilt single-useTFF cassettesOPUS Pre-packed Columns Stainless steel andsingle-use formats KrosFlo HollowFiber Filters andPerfusion SystemsTangenX TFF Filters Award-winningperfusion cellretention deviceSpectrum Filters and SystemsOptimizingprocess efficiency,processeconomics, andrisk mitigationwith best-in-classtechnologyXCell ATF SystemsSetting newstandards inbioprocessing Fast, reliable, andre-produciblequantitation ofleached ProteinA, MabSelectSuRe ligand andLONG R³ IGF-I Clinical andcommercialprocesses OPUS 80R opensdoors tocommercial19
Financial Snapshot
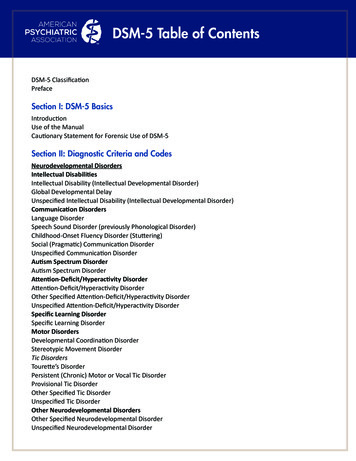
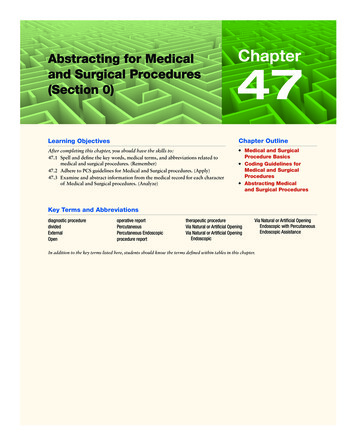
FinancialSnapshot201620172018GuidanceLine extensions 104.52015 24%-29% 141.2 182- 188 200- 250 by 202025%35%29%-33%10%-15% organic CAGRGross Margin (GAAP)54.9%52.5%55.5%-56.5%Gross Margin (Adj.)55.5%55.7%56.0%-57.0%Operating Income (GAAP) 16.0 14.0 26.5- 28.5Operating Income (Adj.)Same customer 31.6base, call points 40.0- 42.0 23.5( s in MILLIONS except EPS)RevenueRevenue Growth10%-15% L-TNet Income (GAAP)Up- to-downstream spaceImprovement opportunities 11.7 28.4 14.0- 16.0Net Income (Adj) 16.8 27.2 30.5- 32.5EPS diluted (GAAP) 0.34 0.72 0.32- 0.36EPS diluted (Adj.) 0.49 0.69 0.69- 0.73Cash & cash equivalents YE 141.8 173.8 194- 196Fully diluted shares YE34.139.244.7EBITDA (Adj.) 26.0 35.1Long-Term Goal60% gross margin25% operating marginIntangible amortization (IA) expense in 2016 is adjusted out in non-GAAP reporting as of Q1 2017 earnings report.IA was 2.1M in 2016 and 6.2M in 20172018 Guidance is as of May 8, 2018 earnings call21
Positioned forContinuedGrowth Large addressable market: 1.5B Growing portfolio of differentiated productsfor flexible manufacturing: single-use andcontinuous Track record ofstrongperformanceThree strong franchises focused on technologyleadershipFILTRATIONPROTEINSProtein A ligands,cell culturesupplementsXCell ATFKrosFlo TFFTangenX TFFProConnex MBTMarketLeadershipCHROMATOGRAPHYOPUS ResinsELISA Kits Expanded commercial team with greater globalpresence including Asia Tracking to our 2020 financial goal of 200- 250M in revenue Longer term revenue goal of 400M- 500M by 2023 With 174M cash (YE 2017) and an R&D engine in Filtration andChromatography, we are poised for our next phase of growth22
APPENDIXGAAP to Non-GAAP Reconciliation Tables, Workflow Diagrams
GAAP toNon-GAAPReconciliation Income fromOperations Net IncomeREPLIGEN CORPORATIONRECONCILIATION OF GAAP INCOME FROM OPERATIONS TONON-GAAP (ADJUSTED) INCOME FROM OPERATIONS(Unaudited)(in thousands)GAAP INCOME (LOSS) FROM OPERATIONSThree months ended March 31,20182017 ADJUSTMENTS TO INCOME (LOSS) FROM OPERATIONS:Acquisition and integration costsInventory step-up chargesIntangible amortizationADJUSTED INCOME FROM OPERATIONS5,976 6552,664 9,2955,676402224715 7,017REPLIGEN CORPORATIONRECONCILIATION OF GAAP NET INCOME TO NON-GAAP (ADJUSTED) NET INCOME(Unaudited)(in thousands)GAAP NET INCOMEThree months ended March 31,20182017 ADJUSTMENTS TO NET INCOME:Acquisition and integration costsInventory step-up chargesIntangible amortizationNon-cash interest expenseTax effect of intangible amortization and acquisition costsADJUSTED NET INCOME3,448 6552,6641,036(271) 7,5323,068402224715970(101) 5,27824
REPLIGEN CORPORATIONRECONCILIATION OF GAAP NET INCOME PER SHARE TONON-GAAP (ADJUSTED) NET INCOME PER SHARE(Unaudited)GAAP toNon-GAAPReconciliationThree months ended March 31,20182017GAAP NET INCOME PER SHARE - DILUTED Net Income perShare EBITDA ADJUSTMENTS TO NET INCOME PER SHARE - DILUTED:Acquisition and integration costsInventory step-up chargesIntangible amortizationNon-cash interest expenseTax effect of intangible amortization and acquisition costs0.08 0.010.060.02(0.01)ADJUSTED NET INCOME PER SHARE - DILUTED0.170.090.010.010.020.03(0.00) 0.15Totals may not add due to rounding.REPLIGEN CORPORATIONRECONCILIATION OF GAAP NET INCOME TO ADJUSTED EBITDA(Unaudited)(in thousands)GAAP NET INCOMEThree months ended March 31,20182017 3,448 3,068ADJUSTMENTS:Investment IncomeInterest ExpenseTax 24OTHER ADJUSTMENTS:Acquisition and integration costsInventory step-up chargesADJUSTED EBITDA 10,650 7,82525
GAAP toNon-GAAPReconciliation Cost of Sales SG&AREPLIGEN CORPORATIONRECONCILIATION OF GAAP COST OF SALES TO NON-GAAP (ADJUSTED) COST OF SALES(Unaudited)(in thousands)GAAP COST OF SALESThree months ended March 31,20182017 ADJUSTMENT TO COST OF SALES:Acquisition and integration costsInventory step-up chargesIntangible amortizationADJUSTED COST OF SALES19,668 13,990(46)(151) 19,471(224)(138) 13,628REPLIGEN CORPORATIONRECONCILIATION OF GAAP SG&A EXPENSE TO NON-GAAP (ADJUSTED) SG&A EXPENSE(Unaudited)(in thousands)GAAP SG&A EXPENSEThree months ended March 31,20182017 ADJUSTMENTS TO SG&A EXPENSE:Acquisition and integration costsIntangible amortizationADJUSTED SG&A EXPENSE15,898 (591)(2,512) 12,7959,182(402)(577) 8,20326
GAAP toNon-GAAPReconciliation Net IncomeREPLIGEN CORPORATIONRECONCILIATION OF GAAP NET INCOME GUIDANCE TO ADJUSTED (NON-GAAP NET INCOME GUIDANCE)(in thousands)GUIDANCE ON NET INCOMEADJUSTMENTS TO GUIDANCE ON NET INCOME:Acquisition and integration costsAnticipated pre-tax amortization ofacquisition-related intangible assetsNon-cash interest expenseTax effect of intangible amortization and integrationGuidance rounding adjustmentGUIDANCE ON ADJUSTED NET INCOMETwelve months ending December 31, 2018Low EndHigh End 14,000 16,000 2132,500 REPLIGEN CORPORATIONRECONCILIATION OF GAAP NET INCOME PER SHARE GUIDANCE TOADJUSTED (NON-GAAP) NET INCOME PER SHARE GUIDANCEGUIDANCE ON NET INCOMEADJUSTMENTS TO GUIDANCE ON NET INCOME:Acquisition and integration costsAnticipated pre-tax amortization ofacquisition-related intangible assetsNon-cash interest expenseTax effect of intangible amortization and integrationGuidance rounding adjustmentGUIDANCE ON ADJUSTED NET INCOMETotals may not add due to rounding.Twelve months ending December 31, 2018Low EndHigh End 0.32 0.36 0.06 0.06 0.24 0.10( 0.02) 0.00 0.69 0.24 0.10( 0.02) 0.00 0.7327
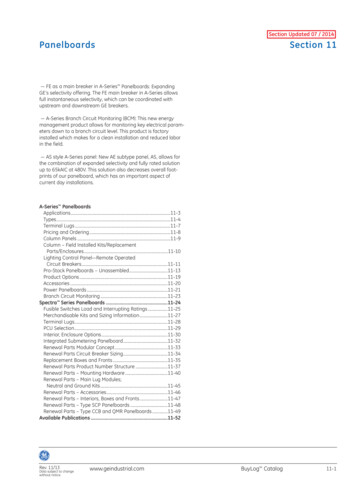
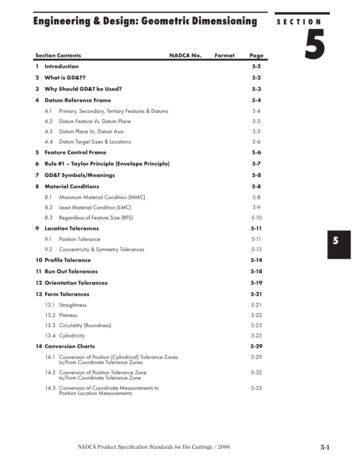
Our Fit in theBiologicsManufacturingProcessUPSTREAM DOWNSTREAMmAb and Vaccine basedProductionFed-batch process28
Repligen raphy29
Thank you!www.repligen.comContact:Sondra NewmanSr. Director IRsnewman@repligen.com781-419-1881 2017 Repligen Corporation. All rights reserved.The trademarks mentioned herein are the property ofRepligen Corporation and/or its affiliate(s) or their respective owners.
Source: Bioprocess Technology Consultants, September 2017 presentation . Our Direct to Customer Brands . 19 Setting new standards in bioprocessing Optimizing process efficiency, process economics, and risk mitigation with best-in-class technology commercial ems Award-winning