Transcription
The 2021 M&A ReportMastering the Artof Breaking UpOctober 2021By Jens Kengelbach, Georg Keienburg, Dominik Degen,Tobias Söllner, Jeff Gell, and Sönke Sievers
Boston Consulting Group partners with leadersin business and society to tackle their mostimportant challenges and capture their greatestopportunities. BCG was the pioneer in businessstrategy when it was founded in 1963. Today,we work closely with clients to embrace atransformational approach aimed at benefiting allstakeholders—empowering organizations to grow,build sustainable competitive advantage, anddrive positive societal impact.Our diverse, global teams bring deep industry andfunctional expertise and a range of perspectivesthat question the status quo and spark change.BCG delivers solutions through leading-edgemanagement consulting, technology and design,and corporate and digital ventures. We work in auniquely collaborative model across the firm andthroughout all levels of the client organization,fueled by the goal of helping our clients thrive andenabling them to make the world a better place.
Contents01 Executive Summary22 How to Create Value ThroughCarve-Outs05 Dealmaking During thePandemic Looking Back at 2020’s Rocky Ride Taking Stock of 2021’s DealmakingBonanza Trends Point to a Positive M&A Outlook16 Divestitures Promote ValueCreation Three Types of Divestitures Why Divest a Business? Shareholders Capture Substantial Value The Right Choices Promote HigherReturns Preparation Lays the Groundwork Exploring the Complexity of Carve-Outs Why Do Some Carve-Outs Fail? The Key Success Factors31 Appendix I:Data and Methodology33 Appendix II:Selected BCG-SupportedTransactions, 2021, 2020, and201937 For Further Reading38 About the Authors
Executive SummaryThe 2021 M&A Report examines the value creation potential of divestitures and how companies can capture the benefits while managing the costs of these often-complex transactions. As companiesrespond to the impact of the COVID-19 pandemic, divestitures continue to be important tools to raise cash, optimize portfolios, andachieve a variety of other corporate objectives.After 2020’s rocky ride, the M&A market has been booming in 2021. By midyear, deal values returned to the elevated levels seen before the pandemic and takeover premiums reverted back toward pre-crisis levels. Looking ahead,dealmaking will be promoted by numerous factors—including abundant capital, favorable economic conditions,portfolio restructurings, industry and regional consolidations, and sustainability.Many companies believe this environment makes it theright time to divest non-core businesses. Are they likely toachieve their goals for value creation? What is the bestpath to success? To find the answers, we leveraged BCG’sM&A database of more than 840,000 deals covering theperiod January 1980 through June 2021.The message from our research is clear: periodic portfolioreshufflings and divestitures of non-core assets can createsubstantial value for shareholders. Two measures of valuecreation with different time horizons—cumulative abnormal returns (CAR) around the announcement date andrelative total shareholder returns (RTSR) during the twoyears after a divestiture—have both trended strongly upward, on average, since 2016.However, averages mask significant variances in performance and returns. For example, although CARs are positive for all industries, they vary substantially—from nearzero for telecommunications companies to more than 1%for media and entertainment companies. RTSRs, in contrast, are negative in some industries, including high tech,health care, and consumer products. The highest RTSRsare seen in utility industries, such as energy and powerand telecommunications, as well as financial services. Asanother example, the median two-year RTSR for spinofftransactions is close to zero, but top-quartile performerscan generate stellar RTSRs of more than 50%.1 To get on the good side of this performance gulf, sellersneed to prepare for every divestiture from start to finish—from thinking deeply about what, when, and how to divestto getting the asset ready and rigorously executing theprocess through closing. The central element of this preparation process is typically carving out the divested business—that is, separating it operationally and financiallyfrom its parent company. This includes getting an earlystart on minimizing stranded costs. We conclude thisreport by exploring the complexity of carve-outs and thekey success factors for delivering the intended value.M&A had a rocky ride in 2020. Deal value and the number of deals fell by 13.2% and8.3%, respectively, in 2020 compared with 2019. The number of deals fell in all regions, while deal valuefell everywhere but Europe (reflecting low value in 2019).Deal volume declined in almost all sectors in the firsthalf of 2020 but then grew significantly in the secondhalf. Technology and health care megadeals (deals with a value greater than 10 billion) propelled deal value upwardin the second half of 2020. For the full year, the technology, media, and telecommunications sector and thehealth care sector dominated the five largest deals.MASTERING THE ART OF BREAKING UP
Dealmaking has been booming in 2021.Trends point to a positive M&A outlook. Deal value in the first half of this year was 22% higherthan in the second half of 2020 and an astonishing 136%higher than in the first half of last year. Deal volume isup by 6% compared with the second half of 2020 and by32% compared with the first half. The general uptick in economic activity resulting froma variety of factors—including pent-up demand andgovernment assistance to individuals and businesses—should promote M&A activity. In North America, deal value reached a record high inthe first half of 2021, marking a 35.0% increase compared with the second half of 2020. In contrast, deal value grew by only 4.7% in Europe and declined by 46.0% inChina. Deal volume in the first half of 2021 grew stronglycompared with the second half of 2020 in most regions. The three sectors with the strongest deal flow in 2021(through mid-September) are media and entertainment,industrials, and energy and utilities. As of the end of September, there had been 38 megadeals in 2021, 24 of which were announced in the firsthalf. This compares with only 26 megadeals during all of2020. The year to date has seen a high volume of deals involving minority stakes, in absolute terms and relative tothose involving majority stakes. Private equity (PE) and venture capital (VC) investments recovered quickly from the pandemic pullback asfirms sought to invest the large amount of dry powderavailable. PE firms have also shown a strong interest inacquiring corporate divestments, especially assets thathave extended potential for value creation as standalonebusinesses. The demand side of the M&A market is flush withcapital. In addition to PE and VC firms having recordamounts of dry powder, many companies have plenty ofcash on hand. And many well-capitalized “specialpurpose acquisition companies” (SPACs) will be lookingfor targets during the next 12 to 18 months. Over the longer term, companies adversely affectedby the pandemic will use divestments to raise cash forpaying down their high debt burdens. Additionally, highertax rates, if they materialize, may accelerate corporatedecisions to spin off assets. In some industries (such as steel), companies willcontinue to use M&A to reduce overcapacity or to consolidate. In other cases, M&A will be a valuable tool foraddressing the convergence of industry sectors, such asmobility and technology. The need for global or regional scale will promotecross-border M&A in industries such as semiconductorsand media, while industries such as automotive will turnto acquisitions to build international supply chains. Some companies (such as those in the energy and oiland gas industries) will likely use acquisitions and divestitures to make their portfolios more appealing from asustainability perspective. In 2021, sellers’ CARs around the announcement datespiked to a median of 0.7%. For buyers, CARs were negative in 2020 but ticked upward during the first half of2021 to a median of 0.2%.BOSTON CONSULTING GROUP 2
Against this backdrop, companies will continueto divest businesses to achieve strategicobjectives. We distinguish three types ofdivestitures. Trade sales, in which corporate owners or financial investors sell companies (including carved-out businesses)in private deals, peaked most recently in 2017 at almost15,000 deals. Subsidiary IPOs, which involve the listing of a subsidiaryheld by a corporate or financial owner, reached recordlevels in 2020 as more than 600 IPOs generated totalproceeds exceeding 150 billion. Spinoffs, in which a corporate owner issues separateshares in a subsidiary to its existing shareholders, haveseen deal volumes decline from their peak of approximately 150 in 2011 to just north of 100 in 2020.Companies use divestitures to promote avariety of objectives. The leading objective, from a corporate owner’s perspective, is focusing the portfolio on the core business.An analysis of more than 2,000 news stories and otherpublications using the machine intelligence “discoverytool” Quid found that “focus on the core” was the mostfrequently recurring theme for divestitures in 2015 and2020, the two years we compared. Another frequent motive, especially in downturns, israising cash. Our Quid analysis of publications showedthat many companies needed to “cut debt,” respondto “debt pressures,” or improve “financial flexibility” ascash evaporated and debt levels ballooned in 2020. Depending on the asset (or the direness of the situation), generating cash from a sale may not even be possible. In such cases, the primary motivation for selling anasset is to avert the need for future cash-outs. Realizing value is another cash-focused motivation, butwith more positive connotations. In some cases, theopportunity to reap a cash windfall has enticed ownersto sell what is arguably a core business.Divestitures create value for sellers’shareholders, on average. Short-term CARs have shot up from a trough of 0.23% in2016 to 0.74% in the first half of 2021. Two-year relative RTSR increased from roughly 1.5% fordeals announced in 2014 to 4% for those announced in2019. High CARs in flashy industries such as high tech andmedia and entertainment go together with low or evennegative RTSRs, whereas the relationship is inverse formore staid industries. It appears that, in some cases,investors initially cheer the shedding of corporate “fat”but later think that the divestiture cut into value-creating“muscle.”The right choices for what, when, and how tosell can promote higher returns. Selling non-core assets and/or underperforming assetsgenerates the highest RTSR. These sales free up cash,reduce complexity, and improve the growth and marginprofile. Not surprisingly, returns are higher from divestituresmade when market conditions promote better economicprospects and give sellers more negotiating power. Wealso found that RTSR increases with a company’s levelof debt, because investors like to see that the seller canput the cash to good use. In terms of two-year RTSR, spinoffs are the most attractive exit route, followed by trade sales and IPOs. Thecomplexity and inherently higher risk of spinoffs leaddecision makers to devote a high level of scrutiny tothese transactions, which, in turn, promotes a greaterchance of success when finally carried out. Trade salesto corporate buyers generate higher returns than thoseto financial investors because corporate buyers are morewilling to pay for synergies. Companies that sell assets relatively frequently generatehigher RTSRs than less-experienced sellers. Other motivations include tax effects, increased regulatory burdens, or succession issues in family-ownedbusinesses. Activists and other engaged shareholders may demandthat companies make divestitures to pursue one ormore of these strategic objectives, especially to focuson specific businesses and escape from a conglomeratediscount.3 MASTERING THE ART OF BREAKING UP
Complex carve-outs are resource intensive andcostly.To succeed, companies must follow a variety ofimperatives. Before a divestiture can become a success story, sellersmust prepare the business for a sale by separating itfrom—that is, carving it out of—the parent company. Focus on creating maximum value from the overalltransaction. In recent years, more than 50% of large carve-out companies have required support from their former parentvia transitional service agreements, including agreements involving core functions, and continued sharingproduction sites and other facilities. Achieving a clean break is challenging because complexcarve-outs require significant internal and external manpower and entail a variety of costs beyond the highlyvisible advisor fees. Cumulative one-time and transition-services costs canrange from approximately 1% to 5% of the divestedbusiness’s revenues. There is a substantial differencebetween the most efficient and the costliest carve-outsrelative to deal size, with costs ranging from less than0.5% to more than 15% of deal value. Stranded costs regularly amount to 3% to 7% of a carveout company’s revenues. A significant restructuringeffort is often needed to eliminate or reduce them. Don’t overlook the details—an 80:20 approach is likelyinsufficient. Closely manage people issues and the overall changeand communications process. Even while focusing on the carve-out process, keep thebusiness running and help it to further develop andgrow. Ensure that the project organization is lean and composed of experienced staff with sufficient seniority andweight in the organization. Comprehensively plan the carve-out budget and thenrigorously track and manage it throughout the process. Tackle stranded costs early and rigorously, potentiallyalso using the exercise to challenge the parent company’s operating model and reset the cost structure. According to a recent BCG survey of leading M&A andcarve-out practitioners, the top three reasons whycarve-outs fail are unclear strategic design; capacityconstraints and loss of critical talent; and a mismatchbetween sellers’ design plans and buyers’ integrationneeds.BOSTON CONSULTING GROUP 4
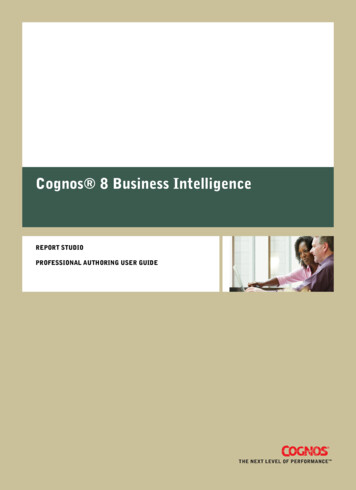
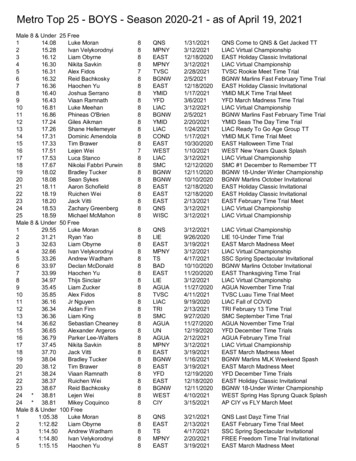
DealmakingDuring thePandemicIn March 2020, M&A activity stopped in its tracks as theCOVID-19 pandemic spread around the world. The sudden global health crisis caused an unprecedented economic shock. But, although the health crisis has persisted,the impact on dealmaking was temporary. Corporate decision makers, investors, and dealmakers adjusted rapidly,enabling M&A activity to rebound strongly.Looking Back at 2020’s Rocky RideIn normal times, the M&A activity in 2020 would beconsidered disappointing; deal value and volume fell by13.2% and 8.3%, respectively, compared with 2019. (SeeExhibit 1.)Deal volume fell in all regions, but not uniformly. Europeand Asia Pacific saw declines of approximately 13.5%.Japan bucked the trend in Asia Pacific with a volume increase of 8.7%. In North America, volume declined by only1.1%, although the region’s decline in deal activity in thesecond quarter was the steepest globally.5 MASTERING THE ART OF BREAKING UP
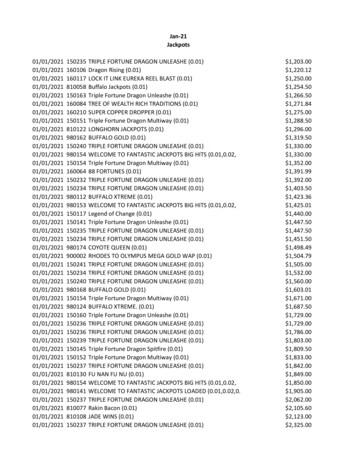
Exhibit 1 - Global M&A Activity Recovered Fast and Stayed StrongThe sharp rebound in activity in the second half of 2020 persisted in the firsthalf of 2021. but, for the full year, 2020 saw adeclineDeal value ( billions) Deal value ( billions) Number of deals1,50010,000–13%3,9287,5001,0002,869 2,874 3,077 2,9475,0005002,5572,50001991 1993 1995 1997 1999 2001 2003 2005 2007 2009 2011 2013 2015 2017 2019 2021Deal volume201520162017201820192020Deal valueSources: Refinitiv; BCG Transaction Center.Note: The total of 808,406 M&A transactions comprises pending, partly completed, completed, unconditional, and withdrawn deals announced between January 1, 1990, and June 30, 2021, with no transaction-size threshold. Self-tenders, recapitalizations, exchange offers, repurchases, acquisitionsof remaining interest, minority stake purchases, privatizations, and spinoffs were excluded.Deal value includes assumed liabilities.1The regional story was different for deal value. Althoughvalue in Europe soared by 31.8%, this reflects, to someextent, the low value in 2019. North America and AsiaPacific saw declines of 26.4% and 6.2%, respectively. Theworst declines occurred in the Middle East (–61.3%) andJapan (–45.7%).For the full year, the technology, media, and telecommunications (TMT) sector and the health care sector dominatedthe five largest deals:From an industry perspective, 2020 was a tale of two halfyears. In the first half, deal volume declined in almost allsectors (retail was a notable exception). In contrast, thesecond half saw significant volume growth in almost allsectors (consumer staples and real estate stood out asdecliners). S&P Global announced its acquisition of IHS Markit, aUK-based market data and research company, in an allstock deal valued at 43.5 billion.Although the health crisis has persisted, theimpact on dealmaking was temporary.The only sectors that experienced higher deal value in thefirst half of 2020 were consumer staples and telecommunications. One large deal was responsible for the positiveperformance in telecommunications: Liberty Global andTelefonica announced plans to combine their UK subsidiaries—cable operator Virgin Media and mobile carrierO2—in a joint venture valued at 12.6 billion. In the second half of 2020, technology and health care megadeals(deals with a value greater than 10 billion) propelled dealvalue upward.BOSTON CONSULTING GROUP Dell Technologies spun off its 81% share (valued at 52.2billion) in VMWare, a virtualization software company. Nippon Telegraph and Telephone acquired the publicly held shares (33.8%) of its subsidiary NTT Docomo,Japan’s largest mobile carrier, thereby taking it private. Nvidia announced its takeover of British chip designerArm, valued at 40.0 billion. AstraZeneca announced its acquisition of Alexion Pharmaceuticals for 39.3 billion.Large deals (deals with a value exceeding 500 million)followed the same pattern as overall M&A activity, with asharp decline followed by a strong rebound. (See Exhibit 2.)After a short breather, the volume of large deals cameroaring back beginning in August 2020. The momentum inthe second half of 2020 has continued unabated in 2021.6
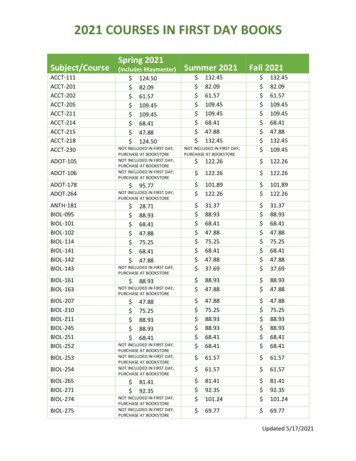
Exhibit 2 - Large Deals, Including SPAC Mergers, Rebounded to New HighsGlobal number of deals with value of at least 500 millionOECD business confidence index140105120100100807060Volume range409540200020072008200920102011Number of deals ( 500m)2012201320142015SPAC mergers ( 500m)201620172018201920202021OECD business confidence index (BCI)Sources: Refinitiv; OECD; BCG Transaction Center.Note: The total of 12,270 M&A transactions comprises pending, partly completed, completed, unconditional, and withdrawn majority deals announcedbetween January 1, 2007, and August 30, 2021, with deal values greater than or equal to 500 million. Deal values include assumed liabilities. SPAC Special-purpose acquisition company.Taking Stock of 2021’s Dealmaking BonanzaM&A activity has been booming in 2021, at levels comparable to the 2007 frenzy.Deal value in the first half of this year was 22% higher thanin the second half of 2020 and an astonishing 136% higherthan the first half of last year. Deal volume is up by 6%compared with the second half of 2020 and by 32% compared with the first half. (See Exhibit 3.)In North America, deal value reached a record high in thefirst half of 2021, marking a 35.0% increase compared withthe second half of 2020. The Middle East, Southeast Asia,and Australia-New Zealand also reached record levels ofdeal value and saw the highest growth relative to the second half of last year. In contrast, Europe saw only 4.7%growth for deal value, while deal value declined in China(–46.0%) and Japan (–20.8%).Deal volume in the first half of 2021 grew strongly compared with the second half of 2020 in most regions. TheMiddle East led the way with a 32.0% increase. Deal volume also grew in Europe (16.7%), Africa (12.9%), and NorthAmerica (9.2%). However, the global trend was not evidentin Japan (2.3% increase) or China (15.0% decline).7 M&A activity has been booming in 2021, at levelscomparable to the 2007 frenzy.The two sectors with the strongest deal flow in 2021(through September) are media and entertainment andenergy and utilities. There were several notable deals: AT&T announced the merger of Warner Media withDiscovery, a deal valued at 65.3 billion. Vivendi spun off 60% of Universal Music Group in a dealvalued at 32 billion. Rogers Communications, a Canadian communicationsand media company, bid for its industry rival ShawCommunications in a transaction valued at 21.9 billion. UK-based National Grid acquired electric power distributor Western Power Distribution from US-based electricservices company PPL for 20.1 billion. Suez and Veolia Environment, two French companies,agreed to merge in a deal valued at 10.7 billion.MASTERING THE ART OF BREAKING UP
Exhibit 3 - Deal Activity Approached Record Levels in the First Half of 2021Deal value ( billions)1Number of 818,53817,80117,42716,54418,40217,91617,57218,659 20,00016,71014,1681,5002,1811,614 1,523 1169172410,0008725,000500Number of6megadealsDeal volumeDeal valueSources: Refinitiv; BCG analysis.Note: The total of 287,051 M&A transactions comprises pending, partly completed, completed, unconditional, and withdrawn deals announced between January 1, 2013, and June 30, 2021, with no transaction-size threshold. Self-tenders, recapitalizations, exchange offers, repurchases, acquisitionsof remaining interest, minority stake purchases, privatizations, and spinoffs were excluded. Megadeals are deals with a value above 10 billion.Deal value includes assumed liabilities.1Megadeals (deals with a value greater than 10 billion) areoften a sign that dealmakers are confident. As of lateSeptember, there were 38 megadeals in 2021, 24 of whichwere announced in the first half. This compares with only26 megadeals during all of 2020. AT&T’s announced sale ofWarner Media to Discovery for 65.3 billion has been thelargest deal of 2021 so far. Through late September, thenext four largest deals in 2021 were: Singapore-based Grab’s merger with Altimeter Growth, aUS-listed special-purpose acquisition company (SPAC),valued at 34.3 billion The ongoing takeover battle for Kansas City Southern(Canadian National Railway submitted a bid valued at 33.5 billion to outbid Canadian Pacific’s offer of 31.2billion, but the latter still seems to be the frontrunnerbecause of regulatory concerns.) MSP Recovery’s announced merger with LionheartAcquisition Corporation II, a SPAC, valued at 32.5billionSPACs have played prominent roles in recent largedeal activity.As this list indicates, SPACs have played prominent roles inrecent large deal activity. The number of SPAC IPOs skyrocketed in 2020 and then peaked in the first quarter of2021. So far in 2021, approximately 190 SPAC businesscombinations (“de-SPAC” transactions) have been announced. While the average SPAC IPO raises proceeds ofapproximately 300 million, year to date, the average dealvalue for de-SPAC transactions is 2.2 billion. As of September 2021, approximately 430 listed SPACs (each onewith more than 100 million in IPO proceeds) are lookingfor targets. Because SPACs typically need to find a mergertarget within 18 to 24 months after their IPO, we expectthat they will continue to boost the number of M&A dealsin the coming months. Recently, however, the SPAC frenzyhas cooled off, which could have longer-term implicationsfor M&A. (See the sidebar “Is the SPAC Frenzy Over?”) General Electric’s sale of GE Capital Aviation Services toAerCap for an announced deal value of 31.2 billionBOSTON CONSULTING GROUP 8
Is the SPAC Frenzy Over?SPACs (special-purpose acquisition companies) were thestar players in equity capital markets during 2020 and 2021.They are listed shell companies whose sole purpose is toacquire or merge with a private operating company within18 to 24 months after their IPOs. In addition to offeringshares to public investors, SPACs invite institutional investors to buy shares through “private investment in publicequity” (PIPE), simultaneously with the SPAC merger.A SPAC’s founders, or “sponsors,” are usually experiencedexecutives with a background in an industry or in finance(such as in PE or VC). Some sponsors, such as ChamathPalihapitiya (a Silicon Valley entrepreneur and investor)and Michael Klein (a banker and dealmaker), havelaunched several SPACs in recent years. Celebrities havealso sponsored SPACs. Although there are exceptions,SPACs typically focus on the broader tech sectors, including gaming, health and biotech, and especially new mobility and transportation, from electric vehicles to space travel.9 These “blank check companies” are not a new concept—they have existed since at least the 1990s. The recent surgein popularity began in 2019. An early marquee transactionduring this wave was the merger between Social CapitalHedosophia (a SPAC founded by Palihapitiya) and VirginGalactic (Richard Branson’s space travel company).So far, 2021 has seen 441 SPAC IPOs with proceeds greaterthan 100 million, two-thirds of them in the first quarter.This already represents an annual record, compared with230 in 2020 and 53 in 2019. (See the exhibit.) The frenzyreflects high-growth companies’ desire to go public even ifthe traditional IPO route may not be suitable because oftheir limited financial and/or operating histories. Andinvestors have been eager to place bets on these riskiercompanies despite the absence of a track record.MASTERING THE ART OF BREAKING UP
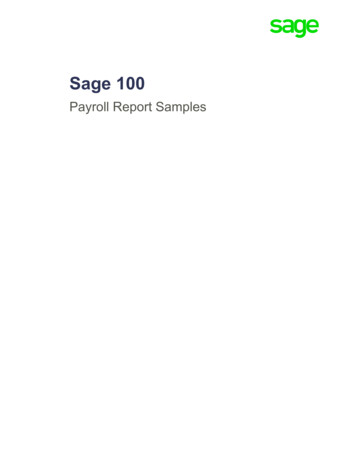
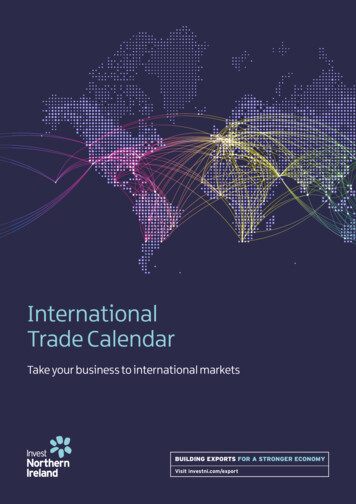
SPAC Activity Is Cooling OffSPAC IPOs1De-SPAC transactions2Proceeds ( billions)1Number of SPAC IPOs11003008020060Deal value ( billions)210020080150600SPAC IPO Volume0De-SPAC Volume0.7%73%1.8%050–2.6%–2.1%Deal value ( billions)1003.1%–2.2%0Q1 Q2 Q3 Q4 Q1 Q2 Q3 Q4 Q1 Q2 Q32019 2019 2019 2019 2020 2020 2020 2020 2021 2021 2021Average redemption rate (%)1,24%–0.7%–1.0%–1.4%–1.2%20Gross proceeds (in million)Average first-day pop (%)12%4050Q1 Q2 Q3 Q4 Q1 Q2 Q3 Q4 Q1 Q2 Q32019 2019 2019 2019 2020 2020 2020 2020 2021 2021 2021–4%10010040–2%Number of Q3Q4Q1Q2Q3Q12019 2019 2019 2019 2020 2020 2020 2020 2021 2021 202174%022%8%Q1Q2Q3Q4Q1Q2Q3Q4Q1Q2Q32019 2019 2019 2019 2020 2020 2020 2020 2021 2021 2021Sources: S&P Capital IQ; SPACinsider; BCG Transaction Center.1Includes SPAC IPOs with proceeds of at least 100 million.2Includes de-SPAC transactions with a deal value of at least 100 million.There are signs that the two-year SPAC frenzy is windingdown, however; retail investors are showing less interest inSPAC IPOs. This is evident in the “first-day pop”—the stockprice increase on the first trading day—which started todecrease significantly in April 2021 after soaring fromNovember 2020 through March 2021. In addition, the rateof public investors’ share redemptions before a merger hasrecently increased. The rise in redemption rates demonstrates the importance of PIPE financing to ensure thatenough capital is available.Investors’ waning interest may reflect their understandingthat, when it comes to SPACs, there can be too much of agood thing. As more SPACs chase a finite number of targets, the shareholders of potential acquirees have gainedbargaining power with respect to deal terms—which hadpreviously been set predominantly by, and quite favorableto, SPAC sponsors and investors.BOSTON CONSULTING GROUP Moreover, sponsors’ and investors’ enthusiasm has beendampened by public statements of the US Securities andExchange Commission. The regulators raised concernsabout the classification and accounting for the warrantsissued by SPACs, as well as investor protection issues. It isalso noteworthy that short sellers leveled allegations offraud against some SPACs in 2020 and 2021. Companieslisted after a de-SPAC transaction could be attractive targets for short sellers. Because these companies often havehigh projected revenues and earnings but low or nonexistent current profits, betting against some of them mightproduce a handsome return. Operating companies that areplanning to go public through a SPAC should take this intoaccount.10
The year to date has seen a high volume of deals involvingminority stakes, in absolute terms and relative to thoseinvolving majority stakes. This follows a significant increasein minority deals last year, as private equity (PE) firms andother investors offered minority investments to companiesduring the crisis. Minority deals have also been promotedby companies’ increasing appetite to provide corporateventure capital (VC) to startups and growth companies—atrend that continued despite the pandemic. Indeed, corporate VC investments are capturing an ever-increasing shareof the VC market. (See Exhibit 4.)Generally, PE and VC investments recovered quickly fromthe pandemic pullback as firms sought to invest the largeamount of dry powder available. (See Exhibit 5.) PE firmshave also shown a strong interest in acquiring corporatedivestments, especially carved-out businesses that areconsidered non-core assets by the seller and have thepotential for significant value creation on a standalonebasis.Exhibit 4 - Corporate Venture Capital Activity Has Increased SteadilyThe number and total value of CVC deals rose over thepast decade and these deals now represent a
1 MASTERING THE ART OF BREAKING UP Executive Summary After 2020’s rocky ride, the M&A market has been boom-ing in 2021. By midyear, deal values returned to the elevat-ed levels seen before the pandemic and takeover premi-ums reverted back toward pre-crisis levels. Looking a