Transcription
AP Physics2006–2007Professional DevelopmentWorkshop MaterialsSpecial Focus:Graphical Analysisconnect to college success www.collegeboard.com
The College Board is a not-for-profit membership association whose mission is to connectstudents to college success and opportunity. Founded in 1900, the association is composedof more than 5,000 schools, colleges, universities, and other educational organizations.Each year, the College Board serves seven million students and their parents, 23,000high schools, and 3,500 colleges through major programs and services in collegeadmissions, guidance, assessment, financial aid, enrollment, and teaching and learning.Among its best-known programs are the SAT , the PSAT/NMSQT , and the AdvancedPlacement Program (AP ). The College Board is committed to the principles ofexcellence and equity, and that commitment is embodied in all of its programs, services,activities, and concerns. iiAP Physics: 2006–2007 Workshop Materials
Table of ContentsSpecial Focus: Graphical AnalysisA Note from the EditorDolores Gende . 3IntroductionLaurence S. Cain . 4Graphical Analysis of Motion: KinematicsDolores Gende . 9Energy Diagrams in Mechanical Systems and the Graphsfor Oscillatory SystemsHasan Fakhruddin . 25Field and Potential GraphsBoris Korsunsky . 40The First Law of Thermodynamics and P-V DiagramsJames Mooney . 46Graphing Analysis in Modern PhysicsDolores Gende . 57Contributors . 78Contact Us . 80Important Note: The following set of materials is organized around a particulartheme, or “special focus,” that reflects important topics in the AP Physics course.The materials are intended to provide teachers with resources and classroomideas relating to these topics. The special focus, as well as the specific content of thematerials, cannot and should not be taken as an indication that a particular topicwill appear on the AP Exam.AP Physics: 2006–2007 Workshop Materials1
Special Focus:Graphical AnalysisA Note from the EditorDolores GendeParish Episcopal SchoolDallasThe following new set of AP Physics theme materials centers on graphical analysis. Thetheme has been addressed in six articles created by AP Physics teachers to help theircolleagues better prepare their students in the area of graphical analysis. These piecesinclude instructional strategies and a variety of exercises across many topics in the APPhysics B and C curricula.In “Graphical Analysis for Physics: An Introduction,” Laurence S. Cain, chair of theDevelopment Committee, underscores the importance of graphical analysis as askill and a tool in various areas of the AP Physics curriculum. My article, “GraphicalAnalysis of Motion: Kinematics,” offers an instructional approach to the qualitativeand quantitative study of motion in one dimension. The exercises contained inthis piece emphasize conceptual understanding of the motion of objects movingat constant speed and objects in accelerated motion. Hasan Fakhruddin’s “EnergyDiagrams in Mechanical Systems and the Graphs for Oscillatory Systems” presentsa variety of exercises that involve the analysis of energy diagrams and graphs forsituations that involve mechanical and oscillatory systems.Next, in “The First Law of Thermodynamics and P-V Diagrams,” James Mooneydiscusses thermodynamics, an area that corresponds exclusively to the AP PhysicsB curriculum. The article includes a thorough discussion of the first law ofthermodynamics and the different thermodynamics processes that can be representedand analyzed through P-V diagrams. In “Field and Potential Graphs,” Boris Korsunskypresents an effective didactic approach with examples on the topic of electric force,electric field, and electric potential through the analysis of graphical representationsof electric field and graphs of force versus charge. Finally, my “Graphing Analysisin Modern Physics” explores atomic energy levels and the photoelectric effect,topics that belong to the area of atomic and nuclear physics in the AP Physics Bcurriculum. The paper includes various exercises on energy-level diagrams and therepresentation and analysis of experimental data of the photoelectric effect.It is the contributors’ hope that you will find these pieces helpful in covering thistopic in the AP Physics classroom.AP Physics: 2006–2007 Workshop Materials3
Special Focus:Graphical AnalysisGraphical Analysis for Physics: IntroductionLaurence S. CainDavidson CollegeDavidson, North CarolinaAs chair of the AP Physics Development Committee, I am pleased to present thesetheme materials on graphical analysis. The ability to analyze graphs is an important andnecessary skill for AP Physics students. The AP Physics Course Description lists severalkey abilities evaluated by the AP Exam, including drawing and interpreting graphs andrepresenting data or physical relationships in graphical form. The laboratory sectionof the exam also requires graphing skills with questions that ask students to “analyzedata, including displaying data in graphical or tabular form, fitting lines and curves todata points in graphs, performing calculations with data, or making extrapolations andinterpolations from data.”1With the publication of these theme materials, the Development Committee iscommitted to addressing the need for students to have conceptual understanding ofthis required material.Students need to be able to think about the material in their physics courses in terms ofconceptual, verbal, graphical, and mathematical ideas. As part of these comprehensiveskills for understanding the physical world around them, students must be able toperform graphical analysis in its many forms. Thus the AP Physics Exams continueto address the analysis of graphs in all types of questions, including laboratory-relatedquestions. With the use of graphing calculators, students appear to be losing the ability todraw, interpret, and understand graphs. “The calculator does it” has become a constantrefrain, but student performance on recent AP Exams leads the Committee to believethat many students don’t have the basic physics knowledge to understand what thecalculator is doing and why.In many areas of physics, there also appears to be a disconnect between what studentslearn in their mathematics courses and how they apply that knowledge in their physicscourses. For example, even if students have learned graphing in previous math coursesand understand the concept of slope, they may have difficulty understanding that the142006, 2007 AP Physics B, Physics C: Mechanics, and Physics C: Electricity and Magnetism Course Description,pp. 19 and 20.AP Physics: 2006–2007 Workshop Materials
Special Focus:Graphical Analysisslope of a displacement-versus-time graph is the velocity. The AP Physics courses shouldprovide an opportunity to bridge the gap between physics and math for these students.Problem Areas in Graphical AnalysisThere are various broad categories under the general area of graphical analysis. One ofthese areas involves the straightforward plotting of data. With the advent of graphingcalculators, this ability seems to have been deemphasized. Many students have troublewith data plotting, seemingly because they do not understand the fundamentals ofgraphing and what a graph means. They have difficulty choosing the variables to plot,indicating on the graph what they have plotted, and labeling the correct units. They havedifficulty making scales uniform and drawing graphs that may not include the zero onone or both axes if these zeros are not part of the data set.A second area where students struggle is linearizing data. Students appear to have troubledeciding how to plot a relationship so that a best fit to the data can give informationfrom the slope and the intercept. Many students connect the dots; many choose two datapoints that are not on the best-fit line or use one point and an inappropriate zero to finda slope; many draw a straight line through data uncritically, even when such a fit is notappropriate; and many choose two points very close together and ignore the full dataset when finding a slope. The ability to linearize data requires a good understanding offunctions. This is an ability that many students have not developed.A third area involves the ability to view and interpret graphs that are already given or topredict what a graph will look like. This area spans all topics in physics and requires agood conceptual and mathematical understanding of the underlying physics. Studentsshould be able to interpret graphs and make predictions. With the help of their graphingcalculators, they can quickly check their ideas and practice understanding in this area.Particularly important is the ability to interpret position, velocity, and accelerationgraphs. The conceptual understanding involved in using slopes and areas to findkinematical variables and the relationships among them is an important ability forstudents to develop. This understanding sets the stage for the use of graphical analysislater in the AP courses.AP Physics: 2006–2007 Workshop Materials5
Special Focus:Graphical AnalysisExamples of the Problem Areas Observed on Previous AP ExamsA number of examples of student troubles with graphical analysis can be found on the2005 AP Physics Exams. The Chief Reader’s Student Performance Q&A for the APPhysics B Exam2 points out several problem areas: “The areas in which students need work are experimental technique in generaland graphical analysis in particular” (p. 6, bold added for emphasis). 2005 B1 involved the sketching of a graph of velocity versus time given a graphof position versus time. The Q&A states that “the majority of students coulddraw some kind of graph, but many had problems properly sketching thetransitions” (p. 1). 2005 B4 was a laboratory question. As part of this question, the students wereasked to sketch a graph of intensity versus position for a double-slit interferencepattern. From the Q&A: “Students who had not studied two-slit interferencetended to draw the diagram of intensity versus distance in part (c) as linearlydecreasing or increasing” (p. 4). 2005 B6 was a thermodynamics question concerning an ideal gas in a cylinder.Students were given a set of data and asked to find the number of moles of gas inthe cylinder after finding a relationship that could be plotted. From the Q&A: “Inpart (b) students showed poor graphing technique when they scaled the graph, sothe data were compressed into a small region of the grid. Students also did a poorjob of scaling the axes by including the origin. . . . In part (c) many students didnot use the slope of the graph to obtain a value for n and instead simply pulled asingle point from the graph or the data table” (p. 5).The Student Performance Q&A for the AP Physics C: Mechanics Exam3 points outseveral problems: “The salient point that comes out of the 2005 Physics C: Mechanics Exam isthat students need to work on their graphing skills. It is not clear if the lack ofthese skills results from not handling data in a laboratory setting or fromexcessive reliance on software packages that do graphing for them. What is clearis that many students are unable to perform tasks involving the presentation ofone-dimensional motion in a graphical form, or to analyze a set of data for orbitalmotion in order to extract physically significant information from it” (p. 3).62Student Performance Q&A: 2005 AP Physics B Free-Response Questions.3Student Performance Q&A: 2005 AP Physics C: Mechanics Free-Response Questions.AP Physics: 2006–2007 Workshop Materials
Special Focus:Graphical Analysis 2005 C: Mechanics question 1 asked students to sketch a graph of velocity versustime for the upward and downward parts of a ball’s flight. From the Q&A: “Themost glaring error was students’ inability to represent physical variablesgraphically. . . . Students would commonly say that the time for the ball to goup was less than the time for the ball to come down and then draw a graph thatcontradicted that assertion” (p. 1). 2005 C: Mechanics question 2 was an orbit problem involving Saturn and itsmoons. Students were asked to plot a set of data for four moons that would allowthem to determine the mass of Saturn. From the Q&A: “The reason that thestudents scored so poorly on this problem was their lack of graphing skills.Students were unable to put their data in a form that would result in a lineargraph, and many of those who did draw a graph were unable to use its slope todetermine the mass of Saturn” (p. 2).The Student Performance Q&A for the 2005 AP Physics C: Electricity and MagnetismExam4 also notes trouble spots: “The graph in question 3 also gave problems, even with the rather large hintgiven by the labeling and scaling of the graph. Graphing skills among allthe Physics C students, both in Mechanics and Electricity and Magnetism,seem to be weaker than in the past” (p. 4, bold added for emphasis). C: Electricity and Magnetism question 1 asked students to consider an electricfield diagram and answer questions concerning electric field, electric potential,and equipotential lines, among others. From the Q&A: “students often conflatedthe notion of electric field strength and potential. . . . The final difficultiescentered on drawing the equipotential lines in part (d). . . . Many students failedto properly draw the equipotential line perpendicular to the field lines at thepoint where they intersected” (p. 2). C: Electricity and Magnetism question 2 was a circuit analysis problem. Part(d) of the problem asked students to sketch a graph of the current through thebattery as a function of time. From the Q&A: “For those students who did knowwhat the inductor was, the graph represented little difficulty” (p. 3). C: Electricity and Magnetism question 3 asked that students analyze a magneticfield problem numerically and graphically. From the Q&A: “Students haddifficulty using the graph to obtain a value of μ0. Some assumed that the slope,which is equal to μ0I, was equal to μ0. Others eschewed the help given to them bythe labels and scale on the graph and relabeled and rescaled it” (p. 4).4Student Performance Q&A: 2005 AP Physics C: Electricity and Magnetism Free-Response Questions.AP Physics: 2006–2007 Workshop Materials7
Special Focus:Graphical AnalysisThese examples of the problems that students have with graphical analysis are just asubset of those that have been identified over the past several years on the AP PhysicsExams. These materials will highlight some of these same areas as well as look at otherareas where graphical analysis is important and necessary for student understandingof physics.Every major topic studied in physics can and should involve the use of graphs. Byusing graphs frequently in class, teachers can expect students to develop familiarity andcomfort with them as the course progresses. Since there are so many aspects of graphicalanalysis to be learned, it is probably best not to introduce them all at once but ratherto introduce specific techniques when appropriate. Graphing calculators and computergraphing programs, if available, can be used as tools to quickly plot data and functions.They allow students to experiment with ideas more quickly than by plotting graphsby hand. If used judiciously, graphing calculators and software can enhance studentlearning. However, it is important for students to show their understanding of thegraphing process and be able to plot data manually (as they may be expected to doon the AP Physics Exams).Topics Covered in This CollectionThese materials cover topics that occur in both the AP Physics B course and the Ccourses: kinematics, energy in mechanical and oscillatory systems, and electric field andpotential. The materials also discuss topics included in only AP Physics B: P-V diagramsin thermodynamics and energy diagrams and the photoelectric effect in modern physics.8AP Physics: 2006–2007 Workshop Materials
Special Focus:Graphical AnalysisGraphical Analysis of Motion: KinematicsDolores GendeParish Episcopal SchoolDallasGraphical analysis is one of the most fundamental skills that introductory physicsstudents should acquire. This article presents a practical approach that stressesconceptual understanding and interpretation of motion graphs in one dimension.Randall Knight1 reports that even though nearly all students can graph a set of dataor can read a value from a graph, they experience difficulties with interpreting theinformation presented graphically. Some student difficulties include: Many students don’t know the meaning of “graph a versus b.” They graph the firstquantity on the horizontal axis, ending up with the two axes reversed. Many students think that the slope of a straight-line graph is found from y/x(using any point on the graph) rather than Δy/Δx. Students don’t recognize that a slope has units or don’t know how to determinethose units. Students don’t recognize that an “area under the curve” has units or don’tunderstand how the units of an “area” can be something other than area units.Describing MotionThe study of one-dimensional kinematics is concerned with the multiple means bywhich the motion of objects can be represented. Such means include the use of words,graphs, equations, and diagrams.A suggested sequence for the introduction of one-dimensional kinematics includes: Constant velocity: Qualitative and quantitative analysis and interpreting graphs Accelerated motion: Qualitative and quantitative analysis and interpreting graphsAnalysis of motion, both qualitative and quantitative, requires the establishment of aframe of reference. The exercises in this article assume a frame of reference with respectto the Earth.The direction of motion is determined by using a Cartesian coordinate system, where1R. Knight, Instructor’s Guide: Physics for Scientists and Engineers, Prentice Hall, 2004.AP Physics: 2006–2007 Workshop Materials9
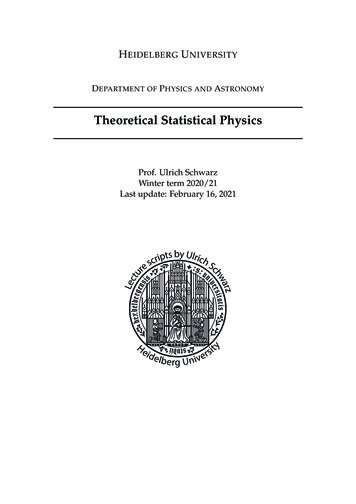
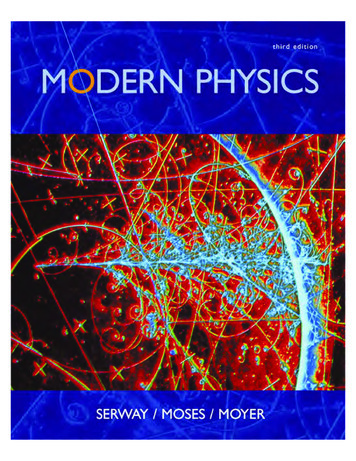
Special Focus:Graphical Analysisthe initial position is denoted as x0 0. If the object moves to the right, its direction ispositive; if it moves to the left, its direction is negative.Arons2 suggests that an effective way of reaching students and improving theirconceptual understanding is to lead them through direct kinesthetic experiences,giving them problems in which they must translate: From the graph to an actual motion From an actual motion to its representation on a graphConstant Velocity: Position vs. Time GraphsA simple analysis of constant velocity can be done using a bowling ball rolling ona carpeted floor or using a battery-operated car. Video analysis is a great tool foranalyzing the motion in detail. The objective is for the students to be able to interpretgraphs of x vs. t in different directions. Here are some examples:Give a qualitative description of the motion depicted in the following x vs. t graphs:a.xb.xttSolution: Object starts atthe origin and moves inthe positive direction withconstant velocity.c.xSolution: Object starts to the rightof the origin and moves in thenegative direction with constantvelocity ending at the origin.d.tSolution: Object starts atthe origin and moves inthe positive direction withconstant velocity.210xtSolution: Object starts to the rightof the origin and moves in thenegative direction with constantvelocity ending at the origin.A. B. Arons, Teaching Introductory Physics, John Wiley & Sons, 1997.AP Physics: 2006–2007 Workshop Materials
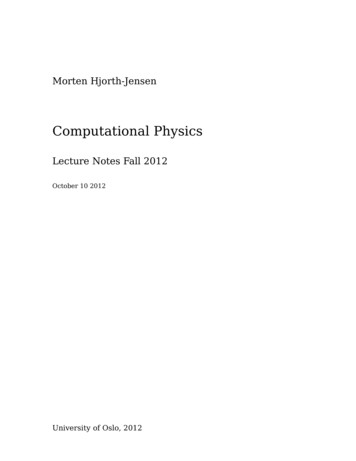
Special Focus:Graphical AnalysisConstant Velocity: Velocity vs. Time GraphsGive a qualitative description of the motion depicted in the following v vs. t graphs:a.vb.vttSolution: Object moves to theright at a fast constant speed.Solution: Object moves to theleft at a slow constant speed.Quantitative ApproachThe next step is to have the students calculate the slope of an x vs. t graph andunderstand that the value obtained is the average velocity. When the velocity isconstant, the average velocity over any time interval is equal to the instantaneousvelocity at any time.The students should also be able to calculate the area under the curve of a v vs. t graphand understand that the value obtained is the displacement.Accelerated MotionMcDermott3 and her Physics Education Research group have suggested an excellentapproach that presents students with situations of a ball rolling along a series of leveland inclined tracks. This experiment can be performed in the classroom or lab using aball-track setup or a dynamics track and a cart.The students should draw qualitative graphs of x vs. t, v vs. t, and a vs. t.v0 0x0 03L. C. McDermott and P. S. Shaffer, Tutorials in Introductory Physics, Prentice Hall, 2002.AP Physics: 2006–2007 Workshop Materials11
Special Focus:Graphical AnalysisSolution:xvatttv0 0x0 0Solution:vxattt12AP Physics: 2006–2007 Workshop Materials
Special Focus:Graphical Analysisv0 0x0 0Solution:vxatttv0 0x0 0AP Physics: 2006–2007 Workshop Materials13
Special Focus:Graphical AnalysisSolution:vxatttv0 0x0 0Solution:vxattt14AP Physics: 2006–2007 Workshop Materials
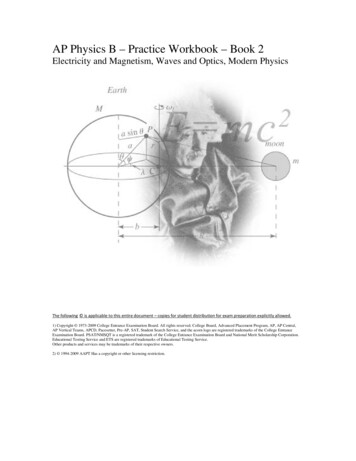
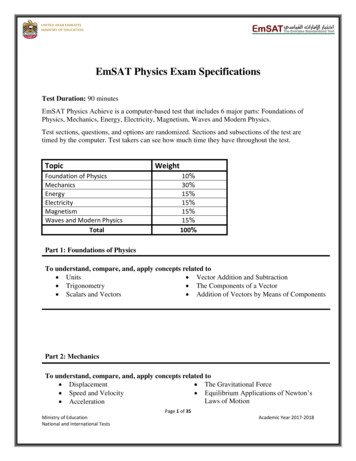
Special Focus:Graphical AnalysisAfter the students have made their predictions, they should conduct differentexperiments to verify their graphs. The use of motion detectors and software programssuch as Logger ProTM or Graphical AnalysisTM is very effective in this analysis.This qualitative approach will help the students understand that the signs of the velocityand the acceleration are the same if the object is speeding up and that the signs of thevelocity and the acceleration are the opposite if the object is slowing down.Interpreting Graphs1. Give a qualitative description of the motion of an object at the different timeintervals depicted in the following v versus t graph:t (s)ABCDEFGAnswer:A-B Positive acceleration, object is speeding upB-C Object is moving with positive constant velocityC-D Negative acceleration, object is slowing downD-E Negative acceleration, object is speeding upE-F Object is moving with negative constant velocityF-G Positive acceleration, object is slowing downAP Physics: 2006–2007 Workshop Materials15
Special Focus:Graphical Analysis2. Give a qualitative description of the motion of an object at the different timeintervals depicted in the following x versus t graph:Answer:A-B Object is at restB-C Negative acceleration, object is slowing downC-D Negative acceleration, object is speeding upD-E Object is at restE-F Positive acceleration, object is speeding upF-G Object is moving with positive constant velocityQuantitative ApproachThe quantitative approach should include calculations of: Slope of the tangent of an x vs. t graph and definition of instantaneous velocity Slope of the v vs. t graph and the understanding that the value obtained is theaverage acceleration Area under the v vs. t graph and the understanding that it gives the displacement Area under the a vs. t graph and the understanding that it gives the changein velocity16AP Physics: 2006–2007 Workshop Materials
Special Focus:Graphical Analysisv1. xSolution:Object starts at the right of theorigin, moves right at constantv, stands still, and then movesleft at faster constant v.t2. vtxtSolution:Object moves left at constant v,then moves to the right atconstant v but slower, thenstands still.tGraphical Analysis of Motion: Free-Response Questions fromPast AP Physics ExamsAnswers to these questions can be found in College Board publications, on the APCentral Web site, or at AP Summer Institutes and workshops.1982 Physics B, Question 1The first meters of a 100 meter dash are covered in 2 seconds by a sprinter who startsfrom rest and accelerates with a constant acceleration. The remaining 90 meters are runwith the same velocity the sprinter had after 2 seconds.a. Determine the sprinter’s constant acceleration during the first 2 seconds.b. Determine the sprinter’s velocity after 2 seconds have elapsed.c. Determine the total time needed to run the full 100 meters.d. On the axes provided below, draw the displacement vs. time curve for the sprinter.AP Physics: 2006–2007 Workshop Materials17
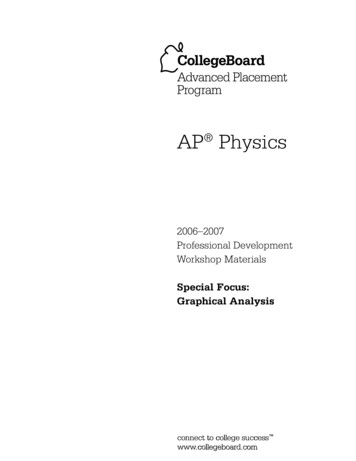
Special Focus:Graphical Analysis100Displacement (meters)806040200024681012Time (seconds)Scale ime (s)1993 Physics B, Question 1A student whose normal weight is 500 newtons stands on a scale in an elevator andrecords the scale reading as a function of time. The data are shown in the graph above.At time t 0, the elevator is at displacement x 0 with velocity v 0. Assume that thepositive directions for displacement, velocity, and acceleration are upward.a. On the diagram below, draw and label all of the forces on the student att 8 seconds.18AP Physics: 2006–2007 Workshop Materials
Special Focus:Graphical Analysisb. Calculate the acceleration a of the elevator for each 5 second interval.i. Indicate your results by completing the following table.Time Interval (s)a (m/s2)0–55–1010–1515–20ii. Plot the acceleration as a function of time on the following graph.Acceleration (m/s2)1050051020 Time (s)15–5–10c. Determine the velocity v of the elevator at the end of each 5 second interval.i. Indicate your results by completing the following table.Time Interval (s)v (m/s)0–55–1010–1515–20ii. Plot the velocity as a function of time on the following graph.252015Velocity (m/s)105005101520Time (s)–5–10–15–20–25AP Physics: 2006–2007 Workshop Materials19
Special Focus:Graphical Analysisd. Determine the displacement x of the elevator above the starting point at the end ofeach 5 second interval.i. Indicate your results by completing the following table.Time Interval (s)x (m)0–55–1010–1515–20ii. Plot the displacement as a function of time on the following graph.250Displacement (m)2001501005002005101520Time (s)AP Physics: 2006–2007 Workshop Materials
Special Focus:Graphical Analysis2000 Physics B, Question 1A 0.50 kg cart moves on a straight horizontal track. The graph of velocity v versus time tfor the cart is given below.a. Indicate every time t for which the cart is at rest.b. Indicate every time interval for which the speed (magnitude of velocity) of the cartis increasing.c. Determine the horizontal position x of the cart at t 9.0 s if the cart is located atx 2.0 m at t 0.AP Physics: 2006–2007 Workshop Materials21
Special Focus:Graphical Analysisd. On the axes below, sketch the acceleration a versus time t graph for the motion of thecart from t 0 to t 25 s.e. From t 25 s until the cart reaches the end of the track, the cart continues withconstant horizontal velocity. The cart leaves the end of the track and hits the floor,which is 0.40 m below the track. Neglecting air resistance, determine each ofthe following:i. The time from when the cart leaves the track until it first hits the floorii. The
1 2006, 2007 AP Physics B, Physics C: Mechanics, and Physics C: Electricity and Magnetism Course Description, pp. 19 and 20. AP Physics: 2006–2007 Workshop Materials 5 Special Focus: Graphical Analysis slope of a displacement-versus-time graph is the