Transcription
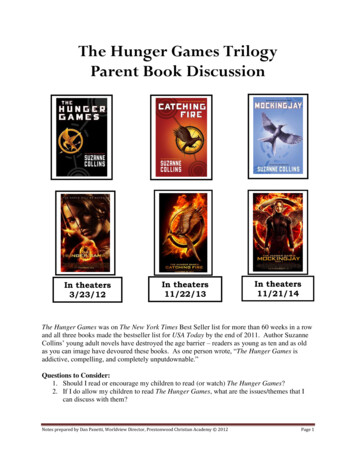
MURRAY CLOSE/LIONSGATEhUngeRgaMThe mathematics found in the popular adolescent book andmovie gives students another way to view probability.After the end of a thought-provokingclass period, one student remained inthe classroom and exclaimed,Guess what?! I figured out that whenI am 18 I will have even more entriesthan Gale’s 42. I will have 57, and thatis just based on the number of familymembers I have living in my houseright now! If my sister moves backhome next week, I’ll have 77 entriesby the time I am 18! This reapingsystem is not mathematically fair!This response was a student’s reactionto an activity based on the popularbook and movie The Hunger Games(Collins 2008). The activity wasdesigned to engage middle schoolstudents in using the mathematics426found in the book. Catching Fire (Collins 2009) and Mockingjay (Collins2010), the other books in the series,also provided a meaningful context forprobability study. We hope that thisactivity will guide the implementationof probability ideas in other classrooms.The Hunger Games describesteenage heroes battling a corruptgovernment set in a postapocalypticUnited States called Panem. This newcountry is divided into 12 districts,instead of 50 states, and controlledby the rulers in the capital of Denver.Leaders annually remind the districtsof their authority and power throughimplementing hunger games. At thisevent, one boy and one girl, rangingfrom ages 12 to 18, from each of theMaTheMaTicS Teaching in The Middle School Vol. 17, No. 7, March 2012Copyright 2012 The National Council of Teachers of Mathematics, Inc. www.nctm.org. All rights reserved.This material may not be copied or distributed electronically or in any other format without written permission from NCTM.12 districts, are randomly selectedduring a ceremony to fight to thedeath on a live reality television show.Middle-grades students readilyrelate to and sympathize with Katniss,Gale, and Peeta, the main charactersin the book. The story begins withKatniss volunteering to take the placeof her younger sister who is selectedfor the televised games. One studentin the class said, “I would volunteerfor my younger sister because although we fight often, she is still mysister and I love her. I wouldn’t be ableto bear her being killed on nationalTV.” The students naturally imaginedwhat it would be like to struggle forresources, leave their family, fight tothe death, and sacrifice their life for afamily member.JAMES STEIDL/ISTOCKPHOTO.COMaSarah B. Bush and Karen S. Karp
?MeS:WhaT aRe The chanceSVol. 17, No. 7, March 2012 MaTheMaTicS Teaching in The Middle School427
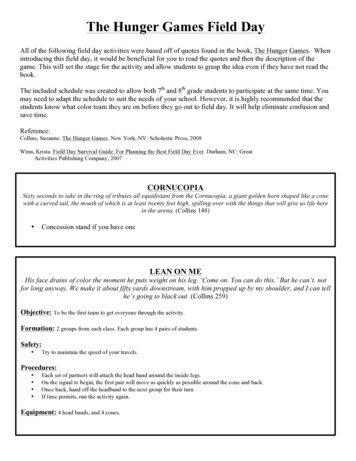
THE ACTIVITYPart 1: Entries in the ReapingThe lesson was completed over twofifty-minute class periods. Moststudents in the classes had alreadyread The Hunger Games and wereable to explain the story line to thefew students who had not yet read it.We took a few minutes and encouraged students to share their personalinsights about the story with the restof the class. Students were eager todescribe the main characters; discussthe inhumanity of the story; and pointThe Standardsat WorkThe Common Core State Standardsfor Mathematics (CCSSI 2010) andNCTM’s Content Standards wereboth used as guiding frameworks.This activity addressed 4. Modelwith Mathematics, a Common CoreMath Practice, which states thatmathematically proficient studentsshould “routinely interpret theirmathematical results in the contextof the situation” (p. 7).This Hunger Games activityalso addressed 1. Make Sense ofProblems and Persevere in SolvingThem because students must “startby explaining to themselves themeaning of a problem and looking for entry points to its solution”(CCSSM 2010, p. 6). This activityalso aligns well with the CommonCore Standards for seventh-grademathematics, which state, in part,that students should “develop aprobability model and use it tofind probabilities of events” (CCSSI2010, p. 51). Moreover, this activity can be related to the CurriculumFocal Points (NCTM 2006) forgrades 6-8 in that students compute probabilities from simulationsincorporating organized lists andtree diagrams.428out unfair elements of the reaping system, or student lottery drawing for thetelevised games. Some students specifically explained how they connectedthe story to their own life. Studentscommented on what their life wouldbe like in the Panem district: “When I imagine having to live ina Panem district, doing my homework doesn’t seem so bad.” “I couldn’t imagine having to killanimals with bows and arrows justso my family could eat.” “It would be awful to live inDistrict 12.”Different discussions evolved fromeach class period on the basis of students’ interests. This process engagedthe entire class and built a high levelof connection to the mathematicalactivity.After discussing the plot, studentswere asked to imagine their class asone of the 12 Panem districts. Toprepare for the lottery to select twoyoung people from each district forthe Hunger Games television show,students first had to find how manyentries containing their name wouldbe placed in the annual reaping lottery. Students’ names were placed ina drawing on the basis of their ageand neediness condition (resultingin the need for tesserae, or additionalfood resources). To find this needinessamount, each student used a calculator with a random integer function.Without telling students ahead oftime what their random calculatorgenerated results meant, each studentprogrammed their calculator to randomly select either a 0 or 1 using thecalculator’s random number feature.Students were motivated by theuse of technology, but the same resultscan be obtained by flipping a coin orrolling a standard number cube. Afterall students generated either a 0 or 1,the teacher explained:Mathematics Teaching in the Middle School Vol. 17, No. 7, March 2012Students’ paper entrieswere placed in containers.If your calculator generated a 0,your family is not starving and youdo not have to submit extra entriesin exchange for food resources (ortesserae) each year. If your calculatorgenerated a 1, your family is starving,and you have always had to submit the maximum number of extraentries each year since you were 12 tofeed your family (all members in yourhousehold, including yourself ).Students instantly realized what theirnumber 1 or 0 meant. The class burstinto cheers and groans at the sametime; the students knew that their fatehad been determined for their veryown hunger games.Next, the class reviewed theprocess and calculated the number oftimes their names would be placedin the drawing for the annual reaping. See figure 1 for guidelines onhow students calculated their numberof entries, which matches the story.Student work examples are illustratedin figure 2.As student work was checked to seewhether they were correctly calculatingtheir own number of entries, a common misconception emerged. Severalstudents wanted to add the total number of entries for their age and add thenumber of multiplicative entries fortesserae in the same way. For example,a 14-year-old student incorrectlystated that six entries would result forhis or her age because
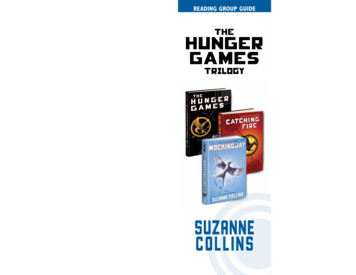
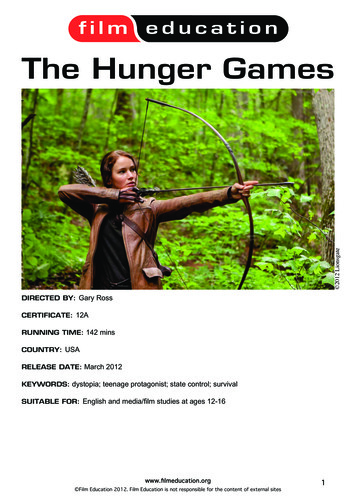
Fig. 1 This formula allowed students to calculate the number of entries into the annualreaping for the hunger games.Onestudentkepttrack asthe classaddedthe totalnumberof girldrawingentries.PART 1: AGEYour baseline entries for each year are determined by your age.1 (age 12) 2 (age 13) 3 (age 14) 6.However, age is not calculated multiplicatively, and this student shouldhave only 3 entries for age—1 foreach year. This issue was resolvedwhen student volunteers created thechart found in figure 1, which highlighted how students should calculatethe entries based on age.After all students had calculatedtheir final number of entries based onage and received tesserae, they repeatedly wrote their names on pieces ofpaper and placed the determinednumber of entries with their nameinto either the boy reaping or the girlreaping lotteries.Part 2: What Are the Chances?After all entries were placed into thelotteries by gender, students wereasked to identify what informationthey needed to calculate their probability of being selected for the hungergames. Students quickly decided thatthe class needed to know the totalnumber of entries in each collection,which we tabulated together as a class.After the total number of entries forboys and girls were found, the teacherposed a series of questions in an activity sheet to engage students in thinking about the fairness (or unfairness),probabilities, and possible outcomesAgeNumber ofEntries121132143154165176187PART 2: TESSERAEIn addition to the baseline number of entries (for your age), you must add1 extra entry for every family member (including yourself) that receivedtesserae. These extra entries are cumulative.For example, if you are 14 years old, your baseline number of entrieswould be 3 (1 for each year—12, 13, and 14). Added to this numberwould be your tesserae. For example, if you have 5 members in yourfamily, the entries for tesserae at age 14 would be 5 3 15.Number of entries 3 (current age baseline) 5 (extra for tesserae age 12) 5 (extra for tesserae age 13) 5 (extra for tesserae age 14) 18.IMPLICATIONS OF TESSERAEA 14-year-old student with 5 family members receiving tesserae (if heor she received a calculator-generated 1) would have 18 entries.A 14-year-old student with 5 family members not receiving tesserae (ifhe or she received a calculator-generated 0) would have 3 entries.of the hunger games. See the activitysheet at the end of this article: Items 1-2 align with Part 1:Entries in the Reaping. Items 3-4 align with the individualstudent’s chances of being selectedfor the hunger games. Items 5-12 are follow-up questions that relate the mathematicsto the story and help studentsimagine themselves as characters inthe story.Vol. 17, No. 7, March 2012 Students immediately took aninterest in the activity sheet and wereplaced in groups of three. Any studentwho had not read The Hunger Gameswas grouped with at least one otherstudent who had. They were eager tocompare their own chances of beingdrawn in the reaping with those oftheir classmates. Rachel stated, “Notonly is the number of entries you havenot fair, it’s also not fair that 18-yearolds have to go against 12-year-olds.”We overheard a conversation betweenMathematics Teaching in the Middle School429
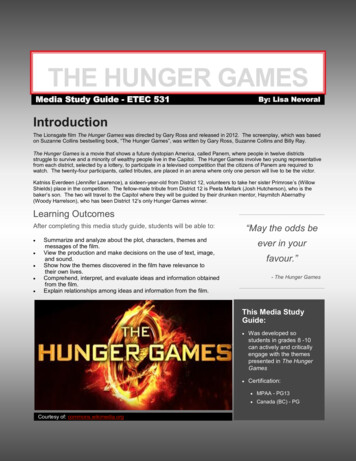
Fig. 2 Students calculated their number of entries on the basis of age and tesserae needs.a boy and girl who both had threeentries in the reaping. Althoughthey had the same number of entriesnumerically, their entries were not thesame proportionally.The boy’s chances of gettingdrawn were much higher than thegirl’s chances because of the difference in the total number of boy andgirl entries in that class. Students alsodiscussed the probability differencesbetween different class periods onthe basis of class sizes, boy-girl ratios,and the number of entries from eachstudent. Students told us:430 “My probability of being chosenin another class period [district]would be different from myclass period. This is because thepopulation of the class periods isdifferent, so the chance for mechanges.” “The chance for being selectedwould be different in anotherclass period because of differentvariables such as boy-girl ratio,number of students, studentsdrawn for tesserae, and with different numbers of family membersto support.”Mathematics Teaching in the Middle School Vol. 17, No. 7, March 2012FINDINGS FROM THE ACTIVITYAfter groups completed the activitysheet, the class reunited and discussed which questions were challenging and which results were interesting or surprising. Item 5, “Writean algebraic equation representing aperson’s total number of entries for agiven year,” was difficult for students.Generally, they were able to calculatetheir total number of entries arithmetically but struggled to representthe operations symbolically (addingfor age and multiplying for tesserae)in the form of an equation.Some students struggled to forman equation until we helped themdefine the possible variables. To helpthem think about the variables thatdetermined their total number ofentries, we asked, “What factors causeyou to have entries?” “What operationoccurs with that variable?” “What ifyour calculator generated a 0. Wouldyour equation still work?” See figure 3for various student-created equations.Students found a question involving permutations (item 9) andanother on grouping (item 12)especially challenging. Most studentsthought that the solution to item 9was extremely large, so we took thisopportunity to discuss how switching the order of just 2 people (out ofthe 24) counts as another possibility.Some students incorrectly wantedto find the number of combinations,rather than permutations, of thisevent.To help students realize the difference between a combination anda permutation, we wrote severalexamples on the board of nearly, butnot exactly, identical orders for the24 contestants. Making comparisonsseemed to help students conceptualize how there could be so many moredifferent possibilities in a permutation. For item 12, once studentsvisualized and illustrated what thequestion was asking, many students
stated that it reminded them of thewell-known Handshake problem.They then displayed creative ways tofind the solution. See the organizedlist and diagram in figure 4.Rounding percentages was anothercommon student misunderstanding. When calculating probability ontheir calculators, students wanted toround the decimal solution instead ofchanging the decimal to a percentagefirst and then rounding. For example,if a student’s chances of being drawnwere 10 out of 248, he or she wouldfind 10 248 0.0403225806 . . . onthe calculator. Next, he or she wouldnote that the directions asked students to round to the nearest hundredth percent. However, insteadof changing the decimal to a percentage first (4.03225806 . . . percent)and then rounding their solution(4.03 percent), students incorrectlyrounded their decimal to the nearestFig. 3 These student-invented equations answered question 5, which asked for anexpression representing the number of entries a person would submit in a year.NEW from NCTM—A Common-Sense Approach tothe Common Core State Standards for MathematicsAdministrator's Guide: Interpreting theCommon Core State Standards to ImproveMathematics Educationby Matthew R. LarsonThis book includes answersto frequently askedansquestions and detailed lists of resources tosupport school mathematics programs.Visit www.nctm.org/catalog for a table ofcontents and sample pages.Stock # 14288List Price 21.95NCTM Member Price 17.56For more information or to place an order,please call (800) 235-7566 or visit www.nctm.org/catalog.Vol. 17, No. 7, March 2012 bkadmin 509NCTM journals 2/12Mathematics Teaching in the Middle School431
Fig. 4 Question 12 asked students to count the number of “confrontations” in systematicways.CONCLUDING REMARKSThis activity provided a meaningfulway to connect probability to a workof adolescent literature that relatedto, was interesting to, and motivatedmiddle-grades students. The studentswho completed this two-day activitywere engaged, eager to find solutions, and personally invested in thestory line and main characters. Theycontributed valuable input and tookownership of the activity. They alsotook pride in the fact that theyremembered more facts about thestory than the teacher.But more important, this lessongave students the opportunity to investigate the notion of chance eventsand develop, use, and evaluate probability models as emphasized in boththe Common Core State Standardsfor Mathematics and the CurriculumFocal Points. Students’ perspectiveson the fairness of the hunger gameswere both interesting and surprising.We were most surprised by how students viewed fairness in two differentways—as the fairness of one entryin the reaping as a random selectionor as the fairness for the contestantscompeting in the games. We read andheard a variety of student responses:(a) “This game would not be fairbecause everyone had differentskills and different strategiesfor competing.” “Considering that it’s a random(b)432Mathematics Teaching in the Middle Schoolhundredth (.04) and wrote 4 percentas their answer. This problem provided an ideal opportunity to helpstudents by providing additionalexamples and showing connections towork done earlier in the school year.We circulated around the room, identifying students who had this misunderstanding and conducting quickassessments. From their responses, wewere quickly able to ensure that theygrasped the concept. Vol. 17, No. 7, March 2012
selection, yes, it is fair as far aschoice, but it is unfair becausenot all contestants are equallymatched.” “Yes, because it is random, but it’salso sort of not fair because somepeople have 18 entries whileothers have 2.”GENERAL REMARKSStudents used reasoning and sensemaking during this activity to addressmathematical situations from anengaging context in meaningful ways.Throughout the activity, studentsexpressed their disbelief at some of thesmall calculated probabilities and someof the large total possible outcomes, asfound on their activity sheet. Thesediscoveries provided a nice transitionto extended conversations about verysmall and very large numbers andthe probability of winning a game ofchance, such as the lottery.In some classes, we talked aboutsome games being based solely onchance, such as the lottery; somebased on multiple variables, such asthe skill needed in horse racing; oron both, such as found in card games.It was not surprising that the issueof fairness dominated students’initial discussions about the story.As their understanding of the underlying probability concepts becamemore sophisticated, their ability toseparate various nuances in fairnessincreased.Students quickly applied theirnew understanding to consequencesof finding a different total numberof entries for each class period. Thisunderstanding and application grewnaturally as students grappled withthese concepts in the context of thestory and discussed the implicationsof the antagonists with respect totheir personal situation.Their ability to blend their personal and story contexts and share themeaning of each in terms of fairnessas defined by probability contributedto a very powerful learning experience. Students were happy that thehunger games were only fiction, asreflected in such comments as “Iwould compete in the hunger gamesif for no other reason than to escapemy fate in a district” and “It is tragicthat 23 people are going to die duringeach annual hunger games.”The use of this piece of adolescentliterature in the mathematics classroom helped students become moremathematically proficient in manyways. They developed a conceptualunderstanding of probability concepts, learned flexibility while usingvarious procedures, solved mathematics problems strategically, engaged inlogical thought and reflection, andbelieved that they could do math.NCTM’sMember Referral ProgramLet’s Add Up! Refer. Receive.Participating in NCTM’s Member Referral Program is fun,easy, and rewarding. All you have to do is refer colleagues,prospective teachers, friends, and others for membership.Then as our numbers go up, watch your rewards add up.Learn more about the program, the gifts, and easyways to encourage your colleagues to join NCTM atwww.nctm.org/referral. Help others learn of themany benefits of an NCTM membership—Get started today!Vol. 17, No. 7, March 2012 mbrref0112 501journals433Mathematics Teachingin the Middle School
Note: The Hunger Games, an adolescent novel, includes elements ofviolence, so it may not be suitable forall middle-grades students.REFERENCESCollins, Suzanne. 2008. The HungerGames. New York: Scholastic Press.———. 2009. Catching Fire. New York:Scholastic Press.———. 2010. Mockingjay. New York:Scholastic Press.Common Core State Standards Initiative(CCSSI). 2010. Common Core StateStandards for Mathematics. Common Core State Standards (College- andCareer-Readiness Standards and K–12Standards in English Language Arts andMath). Washington, D.C.: NationalGovernors Association Center for BestPractices and the Council of ChiefState School Officers. http://www.corestandards.org.National Council of Teachers of Mathematics (NCTM). 2006. CurriculumFocal Points for Prekindergarten throughGrade 8 Mathematics: A Quest forCoherence. Reston, VA: NCTM.Sarah B. Bush,sbush@bellarmine.edu,is an assistant professorof mathematics educationat Bellarmine University inLouisville, Kentucky. Sheis a former middle-gradesmathematics teacherwho is interested inrelevant and engagingmiddle-grades mathematics activities.Karen S. Karp, karen@louisville.edu, is aprofessor of mathematics education at theUniversity of Louisville in Kentucky. She isa former member of the Board of Directors of the National Council of Teachers ofMathematics (NCTM) and a former president of the Association of MathematicsTeacher Educators (AMTE). She continuesto work in classrooms to support teachers of students with disabilities in theirmathematics instruction.434Mathematics Teaching in the Middle School Vol. 17, No. 7, March 2012
activity sheetNameHUNGER GAMES QUESTIONS1. On the basis of your current age and whether your calculator randomly generated a 0 or 1, calculate how many entriesyou would have in the reaping lottery this year. (If you received a 1, do not forget to add cumulative entries of tessaraefrom past years.) Show all work.2. Place your entries in the boy drawing or girl drawing (the total from question 1) using small pieces of paper from yourteacher.Check when complete.3. Given the grand total number of entries in your class (district) and for your gender, what is the probability that yourname would be selected? Express your answer as a percentage rounded to the nearest hundredth. Show all work.4. Suppose you were a student in another class period. Would your chances (or probability) of being selected for theHunger Games be the same? Why, or why not?5. Write an algebraic equation representing a person’s total number of entries for a given year. Define all possiblevariables, and write your equation below.6. If 11,500 total entries were in your district, and 42 of that number were your entries (similar to Gale in the book),what is the probability that your name would be drawn for the Hunger Games? Assume that the 11,500 entries arethe same gender. Express your answer as a percentage rounded to the nearest hundredth. Show all work.7. How many entries would you have if you were 18 years old, had 9 family members (including yourself), and receivedtesserae for each of them (and yourself) every year since you were 12? Show all work.8. Suppose you were Katniss and the name of your same-sex younger sibling was drawn for the Hunger Games. Wouldyou volunteer in his or her place? Why, or why not? Be serious.9. During the Hunger Games in the book, 24 contestants fight to the death until only 1 is standing. This last personstanding is declared the winner. How many orders are possible in which the contestants could have been eliminated?Assume that only 1 contestant is eliminated at a time. Show all work.10. Similar to horse racing, citizens at the capital placed bets on who would win the Hunger Games. How many ordersare possible for the first, second, and third person eliminated? Assume that only 1 person can be eliminated at a time.Show all work.11. Suppose you were in a mathematics class of 24 students, and each student randomly draws the name of a contestantfrom the Hunger Games. If your contestant wins the Hunger Games, you win a prize.a. Is this a fair game? Why, or why not?b. I f it were a fair game, what is the probability of your contestant winning the Hunger Games? Assume that there isonly one winner. Express your answer as a percentage rounded to the nearest hundredth. Show all work.12. Suppose that each contestant at the Hunger Games confronts all the other contestants but none die in the process.How many total confrontations would there be for each contestant to confront all the other contestants exactly onetime? Use drawings or lists to help organize your thoughts. Show all work.from the March 2012 issue of
of the hunger games. See the activity sheet at the end of this article: Items 1-2 align with Part 1: Entries in the Reaping. Items 3-4 align with the individual student’s chances of being selected for the hunger games. Items 5-12 are follow-up ques-tions t