Transcription
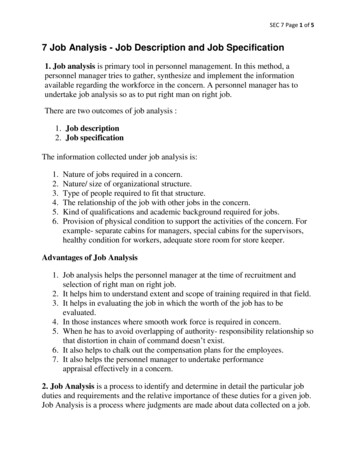
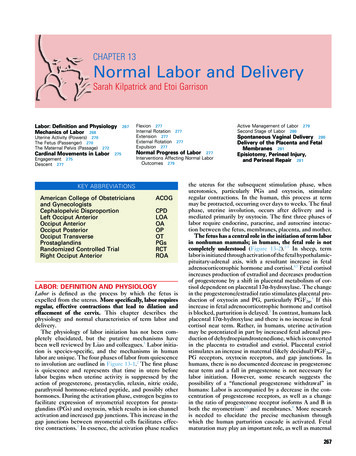
For release 10:00 a.m. (ET) Tuesday, May 3, 2022Technical information: (202) 691-5870 JoltsInfo@bls.gov www.bls.gov/jltMedia contact:(202) 691-5902 PressOffice@bls.govUSDL-22-0785JOB OPENINGS AND LABOR TURNOVER – MARCH 2022The number of job openings was at a series high of 11.5 million on the last business day of March,although little changed over the month, the U.S. Bureau of Labor Statistics reported today. Hires, at 6.7million, were also little changed while total separations edged up to 6.3 million. Within separations,quits edged up to a series high of 4.5 million, while layoffs and discharges were little changed at 1.4million. This release includes estimates of the number and rate of job openings, hires, and separationsfor the total nonfarm sector, by industry, by four geographic regions, and by establishment size class.Chart 1. Job openings rate, seasonally adjusted,March 2019 - March 2022Chart 2. Hires and total separations rates, seasonally adjusted,March 2019 - March Sep-19Mar-20Sep-20Mar-21Sep-21Mar-22Job OpeningsOn the last business day of March, the number of job openings was little changed at 11.5 million, thehighest level in the history of the series which began in December 2000. Over the month, the jobopenings rate was little changed at 7.1 percent. Job openings increased in retail trade ( 155,000) and indurable goods manufacturing ( 50,000). Job openings decreased in transportation, warehousing, andutilities (-69,000); state and local government education (-43,000); and federal government(-20,000). Job openings increased in the South region. (See table 1.)HiresIn March, the number of hires was little changed at 6.7 million. The hires rate was unchanged at 4.5percent. Hires were little changed in all industries and in all four regions. (See table 2.)SeparationsTotal separations includes quits, layoffs and discharges, and other separations. Quits are generallyvoluntary separations initiated by the employee. Therefore, the quits rate can serve as a measure ofworkers’ willingness or ability to leave jobs. Layoffs and discharges are involuntary separations initiated
by the employer. Other separations includes separations due to retirement, death, disability, and transfersto other locations of the same firm.In March, the number of total separations edged up to 6.3 million ( 239,000). The rate was littlechanged at 4.2 percent. Total separations were little changed in all industries. The number of totalseparations increased in the South region. (See table 3.)In March, the number of quits edged up to a series high of 4.5 million ( 152,000). The rate was littlechanged at 3.0 percent. Quits increased in professional and business services ( 88,000) and construction( 69,000). The number of quits increased in the South region. (See table 4.)In March, the number of layoffs and discharges was little changed at 1.4 million. The rate wasunchanged at 0.9 percent. Layoffs and discharges were little changed in all industries and in all fourregions. (See table 5.)The number of other separations was little changed in March at 380,000. Other separations increasedin construction ( 12,000); transportation, warehousing, and utilities ( 11,000); wholesale trade( 10,000); and educational services ( 4,000). The other separations level decreased in information(-6,000). Other separations were little changed in all four regions. (See table 6.)Net Change in EmploymentLarge numbers of hires and separations occur every month throughout the business cycle. Netemployment change results from the relationship between hires and separations. When the number ofhires exceeds the number of separations, employment rises, even if the hires level is steady or declining.Conversely, when the number of hires is less than the number of separations, employment declines, evenif the hires level is steady or rising.Over the 12 months ending in March, hires totaled 77.7 million and separations totaled 71.4 million,yielding a net employment gain of 6.3 million. These totals include workers who may have been hiredand separated more than once during the year.Establishment Size ClassIn March, the job openings rate increased in establishments with 50 to 249 employees andestablishments with 250 to 999 employees. The job openings rate decreased in establishments with 10 to49 employees. The quits rate decreased in establishments with 1,000 to 4,999 employees. The totalseparations rate increased in establishments with 250 to 999 employees. For a more in-depth descriptionof the JOLTS establishment size class estimates, please visit www.bls.gov/jlt/sizeclassmethodology.htm.The Job Openings and Labor Turnover Survey estimates for April 2022 are scheduled to bereleased on Wednesday, June 1, 2022 at 10:00 a.m. (ET).-2-
Table A. Job openings, hires, and total separations by industry, seasonally adjustedJob 185Total 9164LEVELS BY INDUSTRY(in thousands)Total. .Total private. . . . . . . . . . . . . . . . . . . . . . . . . . . . . . . . . . . . . . .Mining and logging. .Construction. . . . . . . . . . . . . . . . . . . . . . . . . . . . . . . . . . . .Manufacturing. . . . . . . . . . . . . . . . . . . . . . . . . . . . . . . . . .Durable goods. . . . . . . . . . . . . . . . . . . . . . . . . . . . . . .Nondurable goods. . . . . . . . . . . . . . . . . . . . . . . . . . .Trade, transportation, and utilities. . . . . . . . . . .Wholesale trade. . . . . . . . . . . . . . . . . . . . . . . . . . . . .Retail trade. . . . . . . . . . . . . . . . . . . . . . . . . . . . . . . . . . .Transportation, warehousing, andutilities. . . . . . . . . . . . . . . . . . . . . . . . . . . . . . . . . . . . . .Information. . . . . . . . . . . . . . . . . . . . . . . . . . . . . . . . . . . . . .Financial activities. .Finance and insurance. . . . . . . . . . . . . . . . . . . . .Real estate and rental and leasing. . . . . . .Professional and business services. . . . . . . . .Education and health services. . . . . . . . . . . . . . .Educational services. . . . . . . . . . . . . . . . . . . . . . . .Health care and social assistance. . . . . . . .Leisure and hospitality. . . . . . . . . . . . . . . . . . . . . . . .Arts, entertainment, and recreation. . . . . . .Accommodation and food services. . . . . . .Other services. . . . . . . . . . . . . . . . . . . . . . . . . . . . . . . . . .Government. . . . . . . . . . . . . . . . . . . . . . . . . . . . . . . . . . . . . . .Federal. . . . . . . . . . . . . . . . . . . . . . . . . . . . . . . . . . . . . . . . . .State and local. . . . . . . . . . . . . . . . . . . . . . . . . . . . . . . . .State and local education. . . . . . . . . . . . . . . . . .State and local, excluding education. . . . .RATES BY INDUSTRY(percent)Total. .Total private. . . . . . . . . . . . . . . . . . . . . . . . . . . . . . . . . . . . . . .Mining and logging. .Construction. . . . . . . . . . . . . . . . . . . . . . . . . . . . . . . . . . . .Manufacturing. . . . . . . . . . . . . . . . . . . . . . . . . . . . . . . . . .Durable goods. . . . . . . . . . . . . . . . . . . . . . . . . . . . . . .Nondurable goods. . . . . . . . . . . . . . . . . . . . . . . . . . .Trade, transportation, and utilities. . . . . . . . . . .Wholesale trade. . . . . . . . . . . . . . . . . . . . . . . . . . . . .Retail trade. . . . . . . . . . . . . . . . . . . . . . . . . . . . . . . . . . .Transportation, warehousing, andutilities. . . . . . . . . . . . . . . . . . . . . . . . . . . . . . . . . . . . . .Information. . . . . . . . . . . . . . . . . . . . . . . . . . . . . . . . . . . . . .Financial activities. .Finance and insurance. . . . . . . . . . . . . . . . . . . . .Real estate and rental and leasing. . . . . . .Professional and business services. . . . . . . . .Education and health services. . . . . . . . . . . . . . .Educational services. . . . . . . . . . . . . . . . . . . . . . . .Health care and social assistance. . . . . . . .Leisure and hospitality. . . . . . . . . . . . . . . . . . . . . . . .Arts, entertainment, and recreation. . . . . . .Accommodation and food services. . . . . . .Other services. . . . . . . . . . . . . . . . . . . . . . . . . . . . . . . . . .See footnotes at end of .12.65.73.22.53.37.16.37.24.2
Table A. Job openings, hires, and total separations by industry, seasonally adjusted — ContinuedJob openingsCategoryGovernment. . . . . . . . . . . . . . . . . . . . . . . . . . . . . . . . . . . . . . .Federal. . . . . . . . . . . . . . . . . . . . . . . . . . . . . . . . . . . . . . . . . .State and local. . . . . . . . . . . . . . . . . . . . . . . . . . . . . . . . .State and local education. . . . . . . . . . . . . . . . . .State and local, excluding education. . . . .p PreliminaryHiresTotal 1.91.91.81.41.91.91.8
Technical NoteThis news release presents statistics from the JobOpenings and Labor Turnover Survey (JOLTS). TheJOLTS program provides information on labordemand and turnover. Additional information aboutthe JOLTS program can be found atwww.bls.gov/jlt/. Estimates are published for jobopenings, hires, quits, layoffs and discharges, otherseparations, and total separations. The JOLTSprogram covers all private nonfarm establishments,as well as civilian federal, state, and localgovernment entities in the 50 states and the Districtof Columbia. Industries are classified in accordancewith the North American Industry ClassificationSystem.DefinitionsEmployment. Employment includes persons onthe payroll who worked or received pay for the payperiod that includes the 12th day of the referencemonth. Full-time, part-time, permanent, short-term,seasonal, salaried, and hourly employees areincluded, as are employees on paid vacation or otherpaid leave. Proprietors or partners of unincorporatedbusinesses, unpaid family workers, or employees onstrike for the entire pay period, and employees onleave without pay for the entire pay period are notcounted as employed. Employees of temporary helpagencies, employee leasing companies, outsidecontractors, and consultants are counted by theiremployer of record, not by the establishment wherethey are working. JOLTS does not publishemployment estimates but uses the reportedemployment for validation of the other reported dataelements.Job Openings. Job openings include allpositions that are open on the last business day of thereference month. A job is open only if it meets allthree of these conditions: A specific position exists and there is workavailable for that position. The position canbe full-time or part-time, and it can bepermanent, short-term, or seasonal.The job could start within 30 days, whetheror not the employer can find a suitablecandidate during that time.The employer is actively recruiting workersfrom outside the establishment to fill theposition. Active recruiting means that theestablishment is taking steps to fill aposition. It may include advertising innewspapers, on television, or on the radio;posting Internet notices, posting “helpwanted” signs, networking or making“word-of-mouth” announcements; acceptingapplications; interviewing candidates;contacting employment agencies; orsoliciting employees at job fairs, state orlocal employment offices, or similarsources.Excluded are positions open only to internaltransfers, promotions or demotions, or recall fromlayoffs. Also excluded are openings for positionswith start dates more than 30 days in the future,positions for which employees have been hired butthe employees have not yet reported for work, andpositions to be filled by employees of temporary helpagencies, employee leasing companies, outsidecontractors, or consultants. The job openings rate iscomputed by dividing the number of job openings bythe sum of employment and job openings andmultiplying that quotient by 100.Hires. Hires include all additions to the payrollduring the entire reference month, including newlyhired and rehired employees; full-time and part-timeemployees; permanent, short-term, and seasonalemployees; employees who were recalled to a job atthe location following a layoff (formal suspensionfrom pay status) lasting more than 7 days; on-call orintermittent employees who returned to work afterhaving been formally separated; workers who werehired and separated during the month, and transfersfrom other locations. Excluded are transfers orpromotions within the reporting location, employeesreturning from strike, employees of temporary helpagencies, employee leasing companies, outsidecontractors, or consultants. The hires rate iscomputed by dividing the number of hires byemployment and multiplying that quotient by 100.Separations. Separations include all separationsfrom the payroll during the entire reference monthand is reported by type of separation: quits, layoffsand discharges, and other separations. Quits includeemployees who left voluntarily with the exception ofretirements or transfers to other locations. Layoffsand discharges includes involuntary separationsinitiated by the employer including layoffs with nointent to rehire; layoffs (formal suspensions from paystatus) lasting or expected to last more than 7 days;
discharges resulting from mergers, downsizing, orclosings; firings or other discharges for cause;terminations of permanent or short-term employees;and terminations of seasonal employees (whether ornot they are expected to return the next season).Other separations include retirements, transfers toother locations, separations due to employeedisability; and deaths. Excluded from separations aretransfers within the same location; employees onstrike; employees of temporary help agencies,employee leasing companies, outside contractors, orconsultants. The separations rate is computed bydividing the number of separations by employmentand multiplying that quotient by 100. The quits,layoffs and discharges, and other separations rates arecomputed similarly.Estimation MethodThe JOLTS survey design is a stratified randomsample of 20,700 nonfarm business and governmentestablishments. The sample is stratified byownership, region, industry sector, and establishmentsize class. The establishments are drawn from auniverse of over 9.4 million establishments compiledby the Quarterly Census of Employment and Wages(QCEW) program which includes all employerssubject to state unemployment insurance laws andfederal agencies subject to the UnemploymentCompensation for Federal Employees program.Employment estimates are benchmarked, or ratioadjusted, monthly to the strike-adjusted employmentestimates of the Current Employment Statistics(CES) survey. A ratio of CES to JOLTS employmentis used to adjust the levels for all other JOLTS dataelements.Birth/death model. The time lag from the startup, or birth, of an establishment until its appearanceon the sampling frame is approximately one year.Also within the first year, new businesses may go outof business, referred to as a death. Because not allbirths and deaths of establishments can be reflectedon the sampling frame immediately, the JOLTSsample cannot capture job openings, hires, andseparations from them during their early existence.BLS has developed a birth/death model that usesestablishment birth and death activity from previousyears. The estimates of job openings, hires, andseparations produced by the birth/death model areadded to the sample-based estimates produced fromthe survey to arrive at the estimates for job openings,hires, and separations.Alignment. The JOLTS figure for hires minusseparations can be used to derive a measure of netemployment change. This change should becomparable to the net employment change from themuch larger CES survey. However, definitionaldifferences as well as sampling and nonsamplingerrors between the two surveys historically causedJOLTS to diverge from CES over time. To limit thedivergence, and improve the quality of the JOLTShires and separations series, BLS implemented themonthly alignment method. There are four steps tothis method: seasonally adjust, align, back out theseasonal adjustment factors, and seasonally adjustagain.Seasonal adjustment. BLS uses X-13 ARIMAfor seasonal adjustment. A concurrent seasonaladjustment methodology is used in which newseasonal adjustment factors are calculated eachmonth, using all relevant data up to and includingcurrent month data. JOLTS seasonal adjustmentincludes both additive and multiplicative models andREGARIMA (regression with auto-correlated errors)modeling to improve the seasonal adjustment factorsat the beginning and end of the series and to detectand adjust for outliers in the series. The seasonallyadjusted CES employment trends are applied to theseasonally adjusted JOLTS implied employmenttrends (hires minus separations) forcing them to beapproximately the same, while preserving theseasonality of the JOLTS data.Annual estimates. The JOLTS estimates arerevised annually to reflect annual updates to the CESemployment estimates and the JOLTS seasonaladjustment factors. The JOLTS employment levelsare ratio-adjusted to the CES employment levels, andthe resulting ratios are applied to all JOLTS dataelements. The seasonally adjusted data arerecalculated for the most recent 5 years in order toreflect updated seasonal adjustment factors. Theseannual updates result in revisions to both theseasonally adjusted and not seasonally adjustedJOLTS data series, for the period since the lastbenchmark was established.Annual levels for hires, quits, layoffs anddischarges, other separations, and total separationsare the sum of the 12 published monthly levels.Annual rates are computed by dividing the annuallevel by the Current Employment Statistics (CES)
annual average employment level, and multiplyingthat quotient by 100. This figure will beapproximately equal to the sum of the 12 monthlyrates. Consistent with BLS practice, annual estimatesare published only for not seasonally adjusted dataand are released with the January news release eachyear. Annual estimates are not calculated for jobopenings because job openings are a stock, or pointin-time, measurement for the last business day ofeach month.Reliability of the estimatesJOLTS estimates are subject to both samplingand nonsampling error. Nonsampling error occurswhen a sample is surveyed rather than the entirepopulation. There is a chance that the sampleestimates may differ from the true population valuesthey represent. The difference, or sampling error,varies depending on the particular sample selected.This variability is measured by the standard error ofthe estimate. BLS analysis is generally conducted atthe 90-percent level of confidence. That means thatthere is a 90-percent chance, or level of confidence,that an estimate based on a sample will differ by nomore than 1.6 standard errors from the truepopulation value because of sampling error.Sampling error estimates are available atwww.bls.gov/jlt/jolts median standard errors.htm.The JOLTS estimates also are affected bynonsampling error. Nonsampling error can occur formany reasons including: the failure to include asegment of the population; the inability to obtain datafrom all units in the sample; the inability orunwillingness of respondents to provide data on atimely basis; mistakes made by respondents; errorsmade in the collection or processing of the data; anderrors from the employment benchmark data used inestimation.Other informationIf you are deaf, hard of hearing, or have a speechdisability, please dial 7-1-1 to accesstelecommunications relay services.
Table 1. Job openings levels and rates by industry and region, seasonally adjusted1Rates2Levels (in thousands)Industry and regionMar.2021Total. .INDUSTRYTotal private. . . . . . . . . . . . . . . . . . . . . . . . . . . . . . . . . . .Mining and logging. .Construction. . . . . . . . . . . . . . . . . . . . . . . . . . . . . . . .Manufacturing. . . . . . . . . . . . . . . . . . . . . . . . . . . . . .Durable goods. . . . . . . . . . . . . . . . . . . . . . . . . . .Nondurable goods. . . . . . . . . . . . . . . . . . .Trade, transportation, and utilities. . . . . . .Wholesale trade. . . . . . . . . . . . . . . . . . . . . . . . .Retail trade. . . . . . . . . . . . . . . . . . . . . . . . . . . . . . .Transportation, warehousing, andutilities. . . . . . . . . . . . . . . . . . . . . . . . . . . . . . . . . .Information. . . . . . . . . . . . . . . . . . . . . . . . . . . . . . . . . .Financial activities. . . . . . . . . . . . . . . . . . . . . . . . .Finance and insurance. . . . . . . . . . . . . . . . .Real estate and rental and leasing. . .Professional and business services. . . . .Education and health services. . . . . . . . . . .Educational services. . . . . . . . . . . . . . . . . . . .Health care and social assistance. . . .Leisure and hospitality. . . . . . . . . . . . . . . . . . . .Arts, entertainment, and recreation. . .Accommodation and food services. . .Other services. . . . . . . . . . . . . . . . . . . . . . . . . . . . . .Government. . . . . . . . . . . . . . . . . . . . . . . . . . . . . . . . . . .Federal. . . . . . . . . . . . . . . . . . . . . . . . . . . . . . . . . . . . . .State and local. . . . . . . . . . . . . . . . . . . . . . . . . . . . .State and local education. . . . . . . . . . . . . .State and local, excludingeducation. . . . . . . . . . . . . . . . . . . . . . . . . . . . . 22 11,448 11,283 11,344 69669,935 10,343 10,235 10,256 225004675173073243603183431,913 1,942 1,832 1,993 2,0363182952943172741,036 1,036 1,029 1,139 7.46.76.77.17.17.16.67.47.07.13REGIONNortheast. . . . . . . . . . . . . . . . . . . . . . . . . . . . . . . . . . . . . .South. . . . . . . . . . . . . . . . . . . . . . . . . . . . . . . . . . . . . . . . . . .Midwest. . . . . . . . . . . . . . . . . . . . . . . . . . . . . . . . . . . . . . . .West. . . . . . . . . . . . . . . . . . . . . . . . . . . . . . . . . . . . . . . . . . . .1Job openings are the number of job openings on the last business day of the month.The job openings rate is the number of job openings on the last business day of the month as a percent of total employment plus job openings.3The states (including the District of Columbia) that comprise the regions are: Northeast: Connecticut, Maine, Massachusetts, New Hampshire, NewJersey, New York, Pennsylvania, Rhode Island, and Vermont; South: Alabama, Arkansas, Delaware, District of Columbia, Florida, Georgia,Kentucky, Louisiana, Maryland, Mississippi, North Carolina, Oklahoma, South Carolina, Tennessee, Texas, Virginia, and West Virginia; Midwest:Illinois, Indiana, Iowa, Kansas, Michigan, Minnesota, Missouri, Nebraska, North Dakota, Ohio, South Dakota, and Wisconsin; West: Alaska, Arizona,California, Colorado, Hawaii, Idaho, Montana, Nevada, New Mexico, Oregon, Utah, Washington, and Wyoming.p Preliminary2
Table 2. Hires levels and rates by industry and region, seasonally adjusted1Rates2Levels (in thousands)Industry and 022pTotal. .INDUSTRYTotal private. . . . . . . . . . . . . . . . . . . . . . . . . . . . . . . . . . .Mining and logging. .Construction. . . . . . . . . . . . . . . . . . . . . . . . . . . . . . . .Manufacturing. . . . . . . . . . . . . . . . . . . . . . . . . . . . . .Durable goods. . . . . . . . . . . . . . . . . . . . . . . . . . .Nondurable goods. . . . . . . . . . . . . . . . . . .Trade, transportation, and utilities. . . . . . .Wholesale trade. . . . . . . . . . . . . . . . . . . . . . . . .Retail trade. . . . . . . . . . . . . . . . . . . . . . . . . . . . . . .Transportation, warehousing, andutilities. . . . . . . . . . . . . . . . . . . . . . . . . . . . . . . . . .Information. . . . . . . . . . . . . . . . . . . . . . . . . . . . . . . . . .Financial activities. . . . . . . . . . . . . . . . . . . . . . . . .Finance and insurance. . . . . . . . . . . . . . . . .Real estate and rental and leasing. . .Professional and business services. . . . .Education and health services. . . . . . . . . . .Educational services. . . . . . . . . . . . . . . . . . . .Health care and social assistance. . . .Leisure and hospitality. . . . . . . . . . . . . . . . . . . .Arts, entertainment, and recreation. . .Accommodation and food services. . .Other services. . . . . . . . . . . . . . . . . . . . . . . . . . . . . .Government. . . . . . . . . . . . . . . . . . . . . . . . . . . . . . . . . . .Federal. . . . . . . . . . . . . . . . . . . . . . . . . . . . . . . . . . . . . .State and local. . . . . . . . . . . . . . . . . . . . . . . . . . . . .State and local education. . . . . . . . . . . . . .State and local, excludingeducation. . . . . . . . . . . . . . . . . . . . . . . . . . . . . .33REGIONNortheast. . . . . . . . . . . . . . . . . . . . . . . . . . . . . . . . . . . . . .South. . . . . . . . . . . . . . . . . . . . . . . . . . . . . . . . . . . . . . . . . . .Midwest. . . . . . . . . . . . . . . . . . . . . . . . . . . . . . . . . . . . . . . .West. . . . . . . . . . . . . . . . . . . . . . . . . . . . . . . . . . . . . . . . . . . .1Hires are the number of hires during the entire month.The hires rate is the number of hires during the entire month as a percent of total employment.3The states (including the District of Columbia) that
The number of job openings was little changed at 10.9 million on the last business day of December, the U.S. Bureau of Labor Statistics reported today. Hires and total separations decreased to 6.3 million and 5.9 million, respectively. Within separations, the