Transcription
Etor’sdiOIKOSChoiceOikos 122: 816–824, 2013doi: 10.1111/j.1600-0706.2012.20868.x 2012 The Authors. Oikos 2012 Nordic Society OikosSubject Editor: Peter Todd. Accepted 7 September 2012Positive versus negative effects of an invasive ecosystem engineeron different components of a marine ecosystemPaul E. Gribben, James E. Byers, Jeffrey T. Wright and Tim M. GlasbyP. E. Gribben (paul.gribben@uts.edu.au), Plant Functional Biology and Climate Change Cluster, and School of the Environment,Univ. of Technology, Sydney, NSW 2007, Australia. – J. E. Byers, School of Biological Sciences, Univ. of Wollongong, Wollongong, NSW 2522,Australia and Odum School of Ecology, Univ. of Georgia, Athens, GA 30602, USA. – J. T. Wright, National Centre for Marine Conservationand Resource Sustainability, Australian Maritime College, Univ. of Tasmania, Launceston, TAS 7250, Australia. – T. M. Glasby, New SouthWales Dept of Primary Industries, Port Stephens Fisheries Institute, Nelson Bay, NSW 2315, Australia.Habitat-forming invasive species have complex impacts on native communities. Positive above ground and negativebelow ground impacts are reported, suggesting that habitat-forming invasive species may affect community componentsdifferently. Furthermore, such effects may vary depending on the density of the invader. We determined the responsesof community components to different densities of the invasive green alga Caulerpa taxifolia in southeastern Australia.Initially we investigated differences in soft-sediment faunal communities (above and below ground) across a biomassgradient at two invaded sites. Caulerpa taxifolia biomass was positively associated with the composition and abundanceof the epifaunal community, but negatively correlated with the abundance of infauna. To examine the response of common community members in more detail, we caged two species of mollusk (the infaunal bivalve, Anadara trapezia andthe epifaunal gastropod, Batillaria australis) across the same biomass gradient to determine lethal and sublethal effectsof C. taxifolia biomass on individuals. Survivorship of A. trapezia was low when C. taxifolia was above 300 g m22.Negative sublethal effects were also density-dependent with A. trapezia tissue weight being lowest above this sameC. taxifolia biomass. The proportion of B. australis surviving was unaffected by C. taxifolia biomass. However, the totalnumber of live B. australis recovered in cages increased as C. taxifolia biomass increased, providing further evidenceof positive density dependent effects (in line with the survey data) of C. taxifolia on epifauna. Finally, we removedC. taxifolia from plots of differing C. taxifolia biomass and followed community change for 5 months. Communitychange following C. taxifolia removal was also density dependent as recovery 5 months post-removal depended onthe initial biomass of C. taxifolia, suggesting a lag in the recovery of communities due to residual environmental effectspost-removal (i.e. hysteresis). We have shown that the effects of a habitat-forming invasive species are biomass dependentand also affect community components differently, suggesting that, globally, the impact of these types of invaders maybe context dependent.Habitat-forming invasive species often have pervasive effectson entire ecosystems because of their strong control ofstructure and resource availability (i.e. via ecosystem engineering, sensu Jones et al. 1994, 1997). However, theresponses of native communities to habitat-forming invasivespecies can be varied, with both positive and negative effectsreported (Crooks 2002, Rodriguez 2006). Habitat-forminginvasive species often facilitate above ground communitiesby providing a refuge from predation or suitable habitatfor colonization where they add structure to previouslyunstructured habitats, or where native habitat-formingequivalents have been lost (Van Riel et al. 2000, Zavaletaet al. 2001, Neira et al. 2005, Wonham et al. 2005). However, below ground modification of the abiotic environment(e.g. changes in nutrient cycling, reducing dissolved oxygencontent and salt accumulation) by habitat-forming invasivespecies can have negative impacts on competitors and within816soil communities (Vitousek 1986, Kourtev et al. 2003,Brusati and Grosholz 2006, Neira et al. 2006, Thorpe andCallaway 2011). Typically, investigation of the impacts ofinvasive habitat-forming species focuses on only one aspectof the community (i.e. above or below ground), or determines the net effect on the entire community withoutconsideration of the responses of different communitycomponents. Because habitat-forming invasive specieshave the capacity to simultaneously ‘engineer’ both aboveand below ground factors, determining the response ofonly one aspect of the community or the entire communityper se may misconstrue the impacts of the invader. However,the intra-specific effects of habitat-forming invasive specieson different community components remain obscure.In a recent review, Thomsen et al. (2011) highlightedthe strong density dependent impacts of aquatic invasivespecies on native biota. Interestingly, 37 of the 39 studies
included in their analysis considered how different densitiesof the invasive species affected native species throughdirect biotic interactions (e.g. competition or predation).In contrast, empirical investigations of the impacts ofhabitat-forming invasive species on native species thatoccur via abiotic changes typically employ limited mani pulations of the invader, often comparing treatments withno invader with those of high invader density only(Gribben et al. 2009, Posey et al. 1993, Neira et al. 2006).These manipulations often represent worst-case scenarios(Elgersma and Ehrenfeld 2011), thus we know littleabout the density dependent effects of habitat-forminginvasive species, particularly when they are at low density(Parker et al. 1999, Ricciardi 2003). However, the impactsof Japanese barberry, Berberis thunbergii, leaf litter onmicrobial community structure was density dependent,with even small additions of litter eliciting large changesin the relative abundances of bacteria (Elgersma andEhrenfeld 2011). Low abundances of the invasive alga,Caulerpa racemosa, altered benthic community structure ofalgal dominated subtidal rocky reefs in the Mediterranean(Bulleri et al. 2010). Similarly, a few examples show thatthe facilitation of native macrophytes and epibiota byhabitat-forming invasive species is also density dependent(Thomsen 2010, White and Shurin 2011). Understandingthe density dependent impacts of habitat-forming invasivespecies will clearly benefit the development of appropriatemanagement strategies for these organisms (Yokomizoet al. 2009, Elgersma and Ehrenfeld 2011).Density dependent effects of invaders will also haveimportant individual level consequences. For example,sublethal effects on the key life-history traits of individualsmay be particularly important in the context of habitatforming invasive species because of their strong effectson the abiotic environment (Neira et al. 2005, 2006,Hacker and Dethier 2006) and life-history traits are oftenvery sensitive to environmental change. Generally, however,little is known about the sublethal impacts of invasive species on native biota (but see Levine et al. 2003 for review ofterrestrial plant invaders). In a marine example, Crooks(2001) demonstrated that the growth of the native softsediment bivalves, Chione spp., was significantly decreasedin the presence of invasive mussel Musculista senhousia.Investigating sublethal effects is important as they willlikely manifest themselves at lower invader densities thanthose at which changes in the abundance of native speciesoccur via mortality. If sublethal effects exist then managinginvader density to a level at which community change occursmay be insufficient for maintaining healthy populations(Gribben and Wright 2006b).The invasive green alga Caulerpa taxifolia has invadedseveral temperate regions worldwide where it covers largeareas of soft-sediment habitat, forms high density beds(Meinesz et al. 2001, Anderson 2005, Wright 2005) andmodifies chemical and physical sediment and water properties. Typically, there are high densities of epibionts and lowdensities of infauna associated with C. taxifolia in southernand southeastern Australia (Gribben and Wright 2006b,Gribben et al. 2009, McKinnon et al. 2009, Tanner 2011).The traits of a native bivalve (size, reproductive output) arealso reduced in C. taxifolia (Gribben and Wright 2006a,Wright et al. 2007, 2012, Wright and Gribben 2008).Similar positive above ground and negative below groundeffects linked to abiotic modification have been demonstrated for other habitat forming invasive species in softsediment marine ecosystems (Crooks 1998, 2002, Crooksand Khim 1999, Hedge and Kriwoken 2000, Wonhamet al. 2005, Levin et al. 2006, Neira et al. 2006). These effectsmay be density (or biomass) dependent and even uponremoval, the prior density of C. taxifolia may influencethe community because of hysteresis and residual environmental effects. To date, however, the impacts of C. taxifoliahave included limited density manipulations.Using C. taxifolia we tested the responses of differentcommunity components (above and below ground) anddifferent levels of community organization (communitiesand individuals) to different invader densities. Specificallywe investigated the following hypotheses: 1) C. taxifoliawill have differing density dependent effects on differentcommunity components (positive for epifauna and negativefor infauna); 2) Sublethal and lethal effects on individualswill be density dependent; 3) The recovery of the abioticenvironment and communities following its removal willbe dependent on initial C. taxifolia density.MethodsStudy site and organismsThe study was conducted at Sponge Bay and Yooralla Bay,Lake Conjola (35 15′44.3″S, 150 26′47.8″E) southeasternAustralia. Detailed descriptions of the organisms andstudy sites are found in Gribben and Wright (2006a, b) andWright et al. (2007). We present only brief descriptionshere. Lake Conjola is a temperate barrier estuary heavilyinvaded by Caulerpa taxifolia. Caulerpa taxifolia was firstdiscovered in Lake Conjola in April 2000, but may haveinvaded the estuary between 1987 and 1995 (Creese et al.2004). It is not known when C. taxifolia invaded SpongeBay, although it has been in the bay since at least 2002(Wright unpubl.). The alga spread throughout LakeConjola to cover greater than 150 ha of the lake floor(Creese et al. 2004, Wright 2005) at the time of the experiments. In Lake Conjola, native seagrasses (e.g. Zosteracapricorni) are patchily distributed and restricted to veryshallow subtidal regions, and there is no other vegetatedhabitat, so we did not compare biomass effects of C. taxifoliawith native seagrasses. In Lake Conjola and other estuariesin New South Wales, Australia, C. taxifolia commonlyinvades bays which contain large populations of the arkshell Anadara trapezia (Arcidae, Deshayes 1840) andthe mudwhelk Batillaria australis (Wright et al. 2007,McKinnon et al. 2009). At both bays studied, A. trapeziaand B. australis occur in both C. taxifolia invaded and unvegetated sediments.Responses of community components and abioticconditions to C. taxifolia densityBiotic communities and key abiotic characteristics (watercolumn dissolved oxygen (DO), sediment redox potential,817
sediment organic content) were determined across a naturally occurring biomass gradient in both Sponge Bayand Yooralla Bay (n 15 plots site21) in February 2008.Because the biomass of C. taxifolia is patchy, plots (0.5 0.5 m) were placed in a contiguous area of interminglingbiomasses of C. taxifolia between 1–2 m water depth thuslimiting any potential confounding effects of gradients inbiomass with water depth. We established plots thatencompassed the full range of C. taxifolia density. Onceeach plot was established, DO was determined for a singlewater sample which was collected 3–5 cm above thesediment surface using 20 ml syringes. Following collectionof water samples, two sediment cores were taken for eachplot and used for analyses of redox (200 ml core) and organics (50 ml core). Redox was measured on site, cores fororganics were labelled, placed on ice and transported to theUniv. of Technology, Sydney (UTS), and stored in a freezeruntil analysed. All samples were collected between11 a.m. and 1 p.m. to limit changes that may occur over thecourse of day/night cycles. Procedures for quantifyingDO, redox and sediment organics are described below. AllC. taxifolia was then carefully removed from each plot,placed in labeled plastic bags and transported to UTS whereit was thoroughly searched for associated biota. (Note: theseplots also formed the basis of community recovery experiment described below). Any epifauna visible on the surfaceof each plot were identified and recorded. Infauna were sampled by collecting a single sediment core (10 cm diam. 10 cmdeep) and sorted on a 500 mm sieve. All organisms wereidentified to the lowest taxonomic level possible and theirabundances determined. Epifaunal abundances are expressedas numbers of organisms/0.25 m2, infauna are expressed asnumbers of organisms/core.For DO, collected samples were immediately wrapped infoil and DO measured within 15 min of sample collectionusing oxygen-sensing 100 mm optodes (Precision Sensing).The optodes were calibrated linearly to 100% air saturationusing methods outlined in Ulstrup et al. (2005). Redoxwas measured using a Pt-wire electrode with Ag/AgClreference electrode and pH meter. The electrode wascalibrated using Orion Application Solution Standardand all redox readings corrected for ERefH 2210 3 mV,i.e. reported redox potentials are versus the hydrogenelectrode, E0H 0 mV. Percent organics was determinedby placing 2 g from each of the sediment samples in a drying oven at 60 C for 24 h, and then weighing them. Thesamples were then placed in a muffle furnace at 440 C at24 h and reweighed. The proportion of organics was thendetermined from the differences in sample weight pre- andpost-furnacing.Community composition was compared between sitesusing ANOSIM (square root transform and Bray–Curtissimilarities). Multivariate and univariate Pearson correlations were used to examine relationships between invertebrate communities (infauna or epifauna) and C. taxifoliabiomass or abiotic variables. Multivariate analyses were donewith the BIOENV routine in the PRIMER software packageusing Bray–Curtis similarities calculated from squareroot transformed biotic data, or normalised Euclidiandistances for abiotic data. The DISTLM sub-routinein PRIMER was used to examine the relationship (linear818regression) between Shannon diversity and C. taxifolia biomass, using squart-root transformed data Euclidian distancesand 9999 permutations of the data.Sublethal and lethal effects of C. taxifolia densityon individualsTo examine the sublethal and lethal effects of C. taxifoliabiomass on two abundant native species (Anadara trapeziaand Batillaria australis), we exposed these species to agradient of C. taxifolia density for five months in SpongeBay. For B. australis we investigated density dependenteffects on mortality only; animals were lost because of afaulty freezer. Anadara trapezia and B. australis were collected from unvegetated sediments in St Georges Basin inFebruary, 2008, to avoid any prior influence of C. taxifoliaon the traits of both these species. In addition, A. trapeziaare now rare in Sponge Bay and sufficient numbers couldnot be found in available unvegetated habitat. Organismswere transported to Sponge Bay and randomly assignedto cages within 2 h of collection. Clams (n 30) andgastropods (n 20) were added to each of 15 cages (50 cmlong 50 cm wide 20 cm high; 9 mm2 mesh size) placedin C. taxifolia within 1 m of each of the C. taxifoliaremoval plots described above. (Note: we lost one cage inthe process of the experiment.) Cages were inserted to adepth of 10 cm. We did not record the initial size ofclams, but all were in the range of 40–60 mm shell length(anterior–posterior axis) and final lengths were measured.The placement of cages within 1 m of the C. taxifoliaremoval plots was done to expose the native molluscs to aknown density of C. taxifolia that was well quantified inthe initial survey described above. Any A. trapezia orB. australis naturally occurring in C. taxifolia were removedprior to the addition of the experimental animals. Cageswere left untouched for 5 months, although they weregroomed monthly to remove fouling (note, cages did notexperience extensive fouling on a month to month basis).Because all plots were treated the same (i.e. all hadcages), the mesh size was large enough to maintain waterflow (but prevent snails from escaping), and we regularlygroomed the cages, we believe any caging effects, if therewere any, were minimal. (Note, at the end of the experiment, the abundance of Caulerpa in the cages appearedvisibly similar to that surrounding Caulerpa cages.) Afterfive months, the percent survival of clams and gastropodswas determined. Sampling of all remaining clams andgastropods coincided with sampling of the removal plotsin July. After collecting all clams and gastropods, allC. taxifolia was removed from the cages and dry weight (g)determined for each cage. The proportion of clams andgastropods surviving was determined from the total numberof individuals for each species (alive dead) recovered.Any mortality of animals was attributed to the effects ofC. taxifolia biomass as the common predators of A. trapeziaand presumably B. australis (blue swimmer crabs, Portunuspelagicus; rays and stingarees, Urolophus spp.; octopods,Octopus tetricus; Byers et al. 2010) were excluded by cages.In addition, we found no evidence of predation (crushedor chipped shells) on animals in cages. For all individualclams recovered alive, we recorded the final shell length
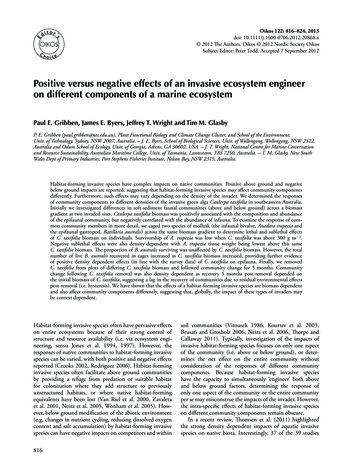
(anterior–posterior axis), dry shell weight, and dry tissueweight. Dry shell and tissue weights were determined byseparating all tissues from their shells and drying the separate components in an oven for 48 h at 60 C.Nested analysis of variance (ANOVA) followed byTukey’s tests were used to test the effect of C. taxifoliabiomass on A. trapezia shell length, dry shell weight anddry tissue weight. Numbers of replicate A. trapeziarecovered per plot ranged from 16–27. A bonferroniadjusted p-value of 0.017 used to account for the multipletests. For all analyses, plot (6 low, 5 medium, 3 high) was arandom factor nested within fixed C. taxifolia biomasscategories: 200 g m22 dry weight (low), 200–300 g m22dry weight (medium) and 300 g m22 dry weight (high).These biomass categories were based on Gribben andWright (2006a; Fig. 2) who showed that the number ofrecruits of A. trapezia increased up to 200 g m22 dry weight,was very high between 200 and 300 g m22 dry weight, andlow at biomasses higher than 300 g m22 dry weight.For all analyses, assumptions were checked by examiningthe distributions of residuals and plots of residualsversus means (Quinn and Keough 2002). The effect ofC. taxifolia biomass on the proportion of A. trapezia andB. australis surviving as a function of total number of eachspecies recovered (alive dead) was explored using linearregression. The proportion surviving/plot was regressedagainst initial C. taxifolia biomass for each corresponding plot.Density dependent effects of initial C. taxifoliadensity on community recovery following itsremovalThe recovery of communities following the removal ofC. taxifolia was investigated at Sponge Bay. Followingsampling of the community components and removalof C. taxifolia to estimate biomass in each of the plotsfor the initial community study (described above), we further removed C. taxifolia from all plots to expand the areacleared to 2 2 m, so that we could create enough area tosubsample the plot over time without resampling thesame place. (These expanded plots did not impinge on theB. australia and A. trapezia cages described above whichwere always 1–2 m away for the adjacent removal plots.)The abundance of epibiotic and infaunal organisms wereidentified and enumerated in each of the 15 plots asdescribed above, after five months (July 2008). Allplots were gardened monthly to prevent encroachment ofC. taxifolia into plots. To ensure all plots were handledsimilarly, plots that had little or no starting biomass ofC. taxifolia were prodded by hand to mimic C. taxifoliaremoval. We could not include unmanipulated unvegetatedcontrols due to the rarity of naturally unvegetated areasat our site and the continued expansion of C. taxifoliainto them, although we did have plots of very low biomass.To account for any temporal variation in communities inC. taxifolia that could have contributed to changes in communities in our recovery plots, after five months, wealso sampled communities in C. taxifolia outside four ofour 15 removal plots (methods as described above forthe initial biomass survey). Each control and removalplot were within 2 m of each other. The communities werecompared to those found in removal plot in the initialbiomass survey. The four control/removal plot pairscovered the entire biomass range found in plots from theinitial survey.We used nMDS ordination to compare infaunal communities in plots 1) with C. taxifolia at the start of the experiment (February; filled circles), 2) with C. taxifolia inJuly (closed triangles), 3) without C. taxifolia in July (fivemonths post removal; open triangles). We also graphedthe multivariate similarity of infaunal community composition in individual plots at time 0, individual plots atfive months after removal, and control plots withoutC. taxifolia biomass removal. Changes in communitiesafter removal of C. taxifolia (before removal vs five monthspost removal) were investigated using ANOSIM and bycomparing Bray–Curtis similarities between communitiesin the same plots from before to after C. taxifolia removal.ResultsResponses of community components and abioticconditions to Caulerpa taxifolia densityInfaunal and epibiotic communities did not differ significantly between Sponge Bay and Yooralla Bay (infauna:Global R 0.018, p 0.26, epibenthic: Global R 0.008,p 0.31). Data were therefore combined to test forcorrelations between communities and Caulerpa taxifoliabiomass. There were positive associations betweenC. taxifolia biomass and Shannon diversity of epifauna(r2 0.303, p 0.002) and number of epibenthic species(r 0.32, p 0.008). Similarly, C. taxifolia biomass waspositively associated with the numbers of epibenthic individuals (r 0.51, p 0.01; Fig. 1). The latter associationwas driven by the numerically dominant (69% of all individuals) mussel Musculus varicosa (r 0.48, p 0.01).The next three most abundant species, Cathalotia fragum(9.7% of individuals), Nassarius burchadi (8.9%) andAnadara trapezia (4.2%), showed no significant correlationwith C. taxifolia biomass (r 0.06, 0.06 and 0.07, respectively,p 0.1 for each). The gastropod Batillaria australis,Figure 1. Correlations between C. taxifolia biomass and number ofepibenthic individuals (black circles, solid black line) and numberof infaunal individuals (grey squares, grey dotted line).819
Sublethal and lethal effects of C. taxifolia densityon individualsThere was a significant effect of Caulerpa biomass onA. trapezia survivorship (F1,12 51.045, p 0.001; r 2 0.810, Fig. 2A). Because we were concerned about theundue influence of the one extremely high density plot(779 g m22), we re-ran the analysis without this plot. Theresults were still highly significant although biomass nowexplained less of the variation in clam survivorship(F1,11 15.389, p 0.005; r 2 0.583).There was no significant relationship between C. taxifoliabiomass and B. australis survivorship with the highestdensity Caulerpa plot included (F1,12 0.410, p 0.534;r 2 0.033) or excluded (F1,11 0.041, p 0.843;r 2 0.020) (Fig. 2B). The lack of fit may have been influenced by the unequal numbers of B. australis recoveredfrom each plot (total lost 62 of 280, range lost in individualplots 5–20). Batillaria australis may have escaped byburrowing under the cages. However, the total numberof gastropods recovered from each plot was positively correlated to C. taxifolia biomass (F1,12 4.884, p 0.047;r 2 0.289).Final dry tissue weight was significantly different amongC. taxifolia biomass categories (F2,14 7.593, p 0.001)(Fig. 3A). Tissue biomass was significantly lower in thehigh C. taxifolia biomass treatment compared to theother two treatments, and significantly lower in the lowC. taxifolia biomass treatment compared to the middleC. taxifolia biomass treatment (all Tukey’s p 0.002). There820Proportion surviving(A) 1.0r 2 0.8100.90.80.70.60.50.002004006008001000(B) 1.0r 2 0.033Proportion survivingalthough uncommon (2.6% of all individuals, occurring in20% of samples), was positively associated with C. taxifoliabiomass (r 0.52, p 0.01).No significant relationship was detected betweenC. taxifolia biomass and Shannon diversity of infauna(r 2 0.028, p 0.376) or the number of infaunal speciesand (r 0.11, p 0.131). The number of infaunal indivi duals was, however, negatively correlated with C. taxifoliabiomass (r 20.45, p 0.05, Fig. 1). The strongest relationship with C. taxifolia for an individual infaunal taxonwas for the nematode Metoncholaimus sp. (r 20.50,p 0.01), which accounted for 72% of all individuals.Abundances of larvae of the insect Pontomyia sp., whichaccounted for an additional 23% of infaunal individuals,did not correlate significantly with C. taxifolia biomass(r 20.07, p 0.1).There was no significant multivariate correlationbetween abiotic variables and infaunal or epibenthic communities. Correlations between abiotic sediment variablesand individual infaunal and epibenthic taxa were typicallyweak or non-existent. There were, however, significantnegative relationships between C. taxifolia biomass andwater column dissolved oxygen (r 20.66, p 0.001) andC. taxifolia biomass and sediment redox (r 20.47,p 0.01). There was a non-significant negative associationbetween C. taxifolia biomass and organic content (r 20.35, p 0.05), which is notable given suggestions thatC. taxifolia tends to thrive in organically rich sediments(Chisholm et al. 1997).0.80.60.40.20.00200400600Biomass (g)8001000Figure 2. Relationship between (A) A. trapezia and (B) B. australisproportion surviving and C. taxifolia biomass (dry weight m22).were also significant differences among plots nested withinC. taxifolia biomass categories (F12,333 5.289, p 0.001).There was no difference in final shell length amongC. taxifolia biomass categories (F2,14 1.843, p 0.183) oramong plots within categories (F12,333 1.680, p 0.07)(Fig. 3B). There was also no difference in final dry shellweight among C. taxifolia biomass categories (F2,14 2.412,p 0.109) or among plots within categories (F12,333 1.08,p 0.376) (Fig. 3C).Density dependent effects of initial C. taxifoliadensity on community recovery following itsremovalThe most dramatic effect of C. taxifolia removal occurredfor epibenthic species, which had disappeared from allplots within five months of removing C. taxifolia. There wassome evidence for a change in infaunal communities fivemonths after removal of C. taxifolia, particularly for thelow initial biomass plots. Infaunal communities in plotsfrom which C. taxifolia had been removed for five months(sampled in July) were significantly different from thosein undisturbed plots where C. taxifolia was still presentin July (Global R 0.49, p 0.006, Fig. 4). Infaunal communities in plots that had not had C. taxifolia removed didnot change significantly over the five month experiment(Global R 0.117, p 0.16; Fig. 4). However, the communities in plots from which C. taxifolia had been removed
(A) 1.6Dry tissue weight (g)1.4BAC1.21.00.80.60.40.20.0(B)35Figure 4. nMDS ordination comparing infaunal communities inplots 1) with C. taxifolia at the start of the experiment (February;filled circles), 2) with C. taxifolia in July (closed triangles), 3) without C. taxifolia in July (five months post removal; open triangles).Dry shell weight (g)302520151050Final shell length (mm)(C)6050403020100 200 g200–300 g 300 gBiomass categoryFigure 3. Mean ( SE) dry tissue weight (g), dry shell weight (g)and final shell length (mm) of live Anadara trapezia recovered fromplots (n 15 in total) containing different biomasses of Caulerpataxifolia after six months. Plots were placed into three C. taxifoliabiomass categories (200 g, 200–300 g and 300 g dry weight;n 3–6 plots/biomass category), and category means were determined from plot averages for each trait measured. (n 16–29clams recovered alive from plots). Different letters indicate significant differences among treatments (Tukey’s tests, p 0.05).for five months were still not particularly different fromthose amongst C. taxifolia at the start of the experiment(Global R 0.182, p 0.004; note that the small GlobalR value is a more reliable indicator of significance than thep-value when there are very large numbers of possible permutations, Clarke and Gorley 2006). As for the initial survey,there was no significant relationship between C. taxifoliabiomass and diversity for infauna (r 2 0.022, p 0.801).SIMPER analyses indicated that at the end of the experiment, 69% of the differences between infaunal communitieswith versus without C. taxifolia were caused by nematodes(Metoncholaimus sp.), insect larvae (Pontomyia sp.) andgastropods (Assiminea buccinoides) being more abundant inplots where C. taxifolia had been removed. (Note thatA. buccinoides may be epifaunal but we only found itshallowly buried in plots so it
effects linked to abiotic modification have been demon-strated for other habitat forming invasive species in soft- sediment marine ecosystems (Crooks 1998, 2002, Crooks and Khim 1999, Hedge and Kriwoken 2000, Wonham et al. 2