Transcription
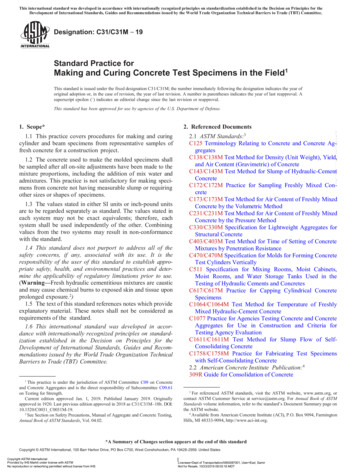
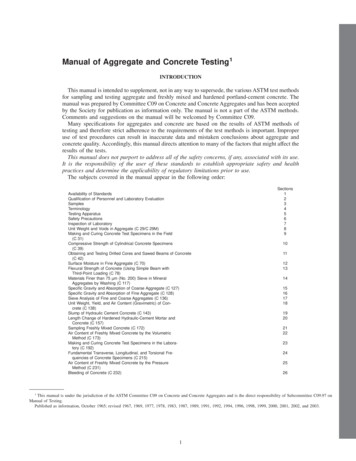
CHALLENGE JOURNAL OF STRUCTURAL MECHANICS 1 (3) (2015) 149–155Defining parameters for concrete damage plasticity modelYusuf Sümer *, Muharrem AktaşDepartment of Civil Engineering, Sakarya University, 54187 Sakarya, TurkeyABSTRACTARTICLE INFOBehavior of reinforced concrete beam cannot be captured by elastic damage modelsor elastic-plastic constitutive laws only. When these two models coupled, load deflection behavior of reinforced concrete can be observed through numerical modeling.Thus, using concrete damage plasticity approach in finite element modeling can leadresearches for sufficient numerical results when compared to experimental tests. Inorder to determine the material damage model of concrete, some laboratory tests arerequired. This paper offers an equation for damage parameter to capture damage behavior. In addition, modeling strategies are developed by checking the model sensitivity against mesh density, dilation angle and fracture energy of concrete. Finite element models are verified by three different experimental tests. In this studyABAQUS finite element software is employed to model reinforced concrete beamwith concrete damage plasticity approach. This study shows that difference betweenthe results from numerical models and experimental tests are in acceptable range.Article history:Received 14 May 2015Accepted 11 July 20151. IntroductionConstitutive behavior of concrete is very difficult tocapture by using elastic damage models or elastic plasticlaws. In elastic damage model irreversible strains cannotbe captured. It can be seen in Fig. 1(b) that a zero stresscorresponds to a zero strain which makes damage valueto be overestimated. On the other hand when elasticplastic relation is adopted the strain will be overestimated since the unloading curve will follow the elasticslope (Fig. 1(c)). Concrete Damage Plasticity (CDP)model which combines these two approaches can capture the constitutive behavior of experimental unloading(Fig. 1(a)) (Jason et al., 2004).Keywords:Finite element methodReinforced concrete beamPlastic damage modelFailure mechanismsIn this model two main failure mechanisms are assumed: tensile cracking and compressive crushing of theconcrete. The evolution of the yield surface is controlledby tensile and compressive equivalent plastic strains. Inthe following sections main assumptions about thismodel will be discussed in detail. In this study, developing a finite element model along with required parameters is discussed. ABAQUS nonlinear finite element commercial software package is employed. All the modelingparameters are validated by experimental results.2. Material Constitutive BehaviorsNumerical models for the constituent material properties are described in this section.2.1. Concrete modelFig. 1. Elastic plastic damage law (Jason et al., 2004).CDP is one of the possible constitutive models to predict the constitutive behavior of concrete. It describesthe constitutive behavior of concrete by introducing scalar damage variables. Tensile and compressive responseof concrete can be characterized by CDP in Fig. 2.* Corresponding author. Tel.: 90-264-2696908 ; Fax: 90-264-2956424 ; E-mail address: ysumer@sakarya.edu.tr (Y. Sümer)
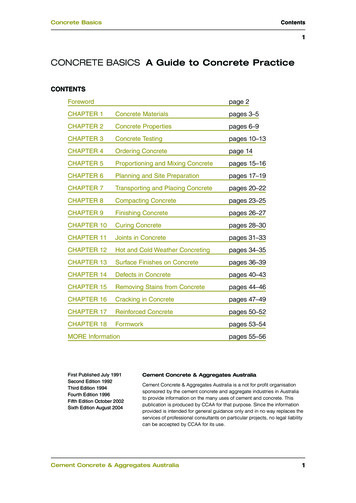
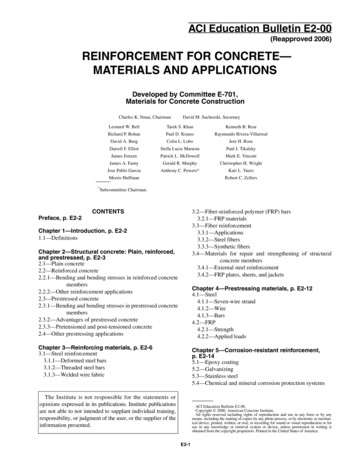
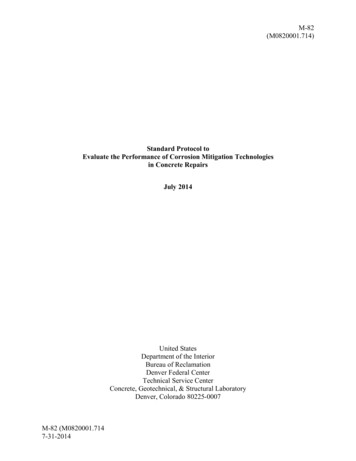
150Sümer and Aktaş / Challenge Journal of Structural Mechanics 1 (3) (2015) 149–155There is a mesh sensitivity problem when crackingfailure in not distributed evenly. This phenomenon exists when there is no reinforcement in significant regionsof the model. To overcome this unreasonable mesh sensitivity problem Hillerborg’s (1976) fracture energy approach can be used instead of post failure stress-strainrelation (Hillerborg et al., 1976). In this approach; theamount of energy (GF) which is required to open a unitarea of crack is assumed as a material property. Thus;concrete’s brittle behavior is defined by stress-displacement response rather than a stress-strain response. Specifying the post failure stress versus corresponding cracking displacement is enough to describe this approach asshown in Fig. 3(a-b) (Abaqus User Manual, 2008).(a)(a)(b)(b)Fig. 2. Behavior of concrete under axial compressive (a)and tension(b) strength (Abaqus User Manual, 2008).As shown in Fig. 2, the unloaded response of concretespecimen seems to be weakened because the elastic stiffness of the material appears to be damaged or degraded.The degradation of the elastic stiffness on the strain softening branch of the stress-strain curve is characterizedby two damage variables, dt and dc, which can take valuesfrom zero to one. Zero represents the undamaged material where one represents total loss of strength (AbaqusUser Manual, 2008). E0 is the initial (undamaged) elastic 𝑝𝑙 𝑝𝑙stiffness of the material and 𝜀𝑐 , 𝜀𝑡 , 𝜀𝑐 𝑖𝑛 , 𝜀𝑡 𝑖𝑛 arecompressive plastic strain, tensile plastic strain, compressive inelastic strain and tensile inelastic strain respectively. The stress-strain relations under uniaxialtension and compression are taken into account in Eq.(1) and Eq. (2). 𝑝𝑙𝜎𝑡 (1 𝑑𝑡 ) 𝐸0 (𝜀𝑡 𝜀𝑡 ) ,(1) 𝑝𝑙𝜎𝑐 (1 𝑑𝑐 ) 𝐸0 (𝜀𝑐 𝜀𝑐 ) .(2)Interface behavior between rebar and concrete ismodeled by implementing tension stiffening in the concrete modeling to simulate load transfer across thecracks through the rebar. Tension stiffening also allowsto model strain- softening behavior for cracked concrete.Thus it is necessary to define Tension stiffening in CDPmodel. ABAQUS allows us to specify Tension Stiffeningby post failure stress-strain relation or by applying afracture energy cracking criterion (Abaqus User Manual,2008).Fig. 3. Post failure stress-strain relation with fracture energy approach (Abaqus User Manual, 2008).As an alternative, GF can be implemented directly as amaterial property. However in this case, a linear loss ofstrength after cracking is assumed (Fig. 3(b)). From CDPperspective, ABAQUS automatically calculates both plastic displacement values using the Eq. (3) and Eq. (4).𝑑𝑝𝑙𝑢𝑡 𝑢𝑡𝑐𝑘 (1 𝑑𝑡 𝑝𝑙𝜀𝑐𝜎𝑡 𝐼0𝑡 ) 𝐸0𝑑 𝜀𝑐 𝑖𝑛 (1 𝑑𝑐,𝜎𝑐𝑐 ) 𝐸0(3).(4)From these equations “effective” tensile and compressive cohesion stresses (𝜎̅𝑡 , 𝜎̅𝑐 ) can be defined as:𝜎̅𝑡 𝜎̅𝑐 𝜎𝑡(1 𝑑𝑡 )𝜎𝑐(1 𝑑𝑐 )𝑝𝑙(5) 𝑝𝑙(6) 𝐸0 (𝑢𝑡 𝑢𝑡 ) , 𝐸0 (𝜀𝑐 𝜀𝑐 ) .The effective cohesion stresses determines the size ofthe yield (or failure) surface (see Fig. 4). In Abaqus theparameters required to define the yield surface consists
151Sümer and Aktaş / Challenge Journal of Structural Mechanics 1 (3) (2015) 149–155of four constitutive parameters. The Poisson’s ratio controls the volume changes of concrete for stresses belowthe critical value which is the onset of inelastic behavior.Once the critical stress value is reached concrete exhibitsan increase in plastic volume under pressure (Chen,1982). This behavior is taken into account by defining aparameter called the angle of dilation. In CDP model ψ isthe dilation angle measured in the p-q plane at high confining pressure and in this study it is determined withsensitivity analysis. ϵ is an eccentricity of the plastic potential surface with default value of 0.1. The ratio of initial biaxial compressive yield stress to initial uniaxialcompressive yield stress, σb0/σc0, with default value of1.16. Finally Kc is the ratio of the second stress invarianton the tensile meridian to compressive meridian at initial yield with default value of 2/3 (Abaqus User Manual,2008). The parameter Kc should be defined based on thefull triaxial tests of concrete, moreover biaxial laboratory test is necessary to define the value of σb0/σc0. Thispaper does not discuss the identification procedure forparameters ϵ, σb0/σc0, and Kc because tests that are goingto be verified in this study do not have such information.Thus, default values are accepted in this study.𝜎 𝑓𝑐 (2𝜀𝜀 [2𝜀𝜀𝑐 ] ).(7)(a)(b)Fig. 5. Stress-strain behavior of concrete under uniaxialcompression and tension a) Hognestad concrete compressive behavior b) Bilinear tensile behavior.For tensile behavior of concrete, bilinear model isadopted as plotted in Fig. 5(b) (Coronado and Lopez,2006). Crack opening (wc) is calculated as a ratio of thetotal external energy supply (GF) per unit area requiredto create, propagate and fully break a Mode I crack inconcrete. However; Mode I tensile fracture energy ofconcrete is defined as a function of the concrete compressive strength, fc*, in CEB-FIP MC90 (CEB-FIB, 1993)as shown in Eq. (8). In this equation Gfo is a coefficientrelated to the maximum aggregate size (dmax). Severalvalues are given in Table 1.𝑓 0.7𝐺𝐹 𝐺𝑓𝑜 ( 𝑐 )Fig. 4. Biaxial yield surface in CDP Model (Abaqus UserManual, 2008).2.1.1. Uniaxial tension and compression stress behavior oftest modelSince the compression and tension stress behavior ofthe experimental test specimens are not reported theserelations are created by using mathematical modelsfrom literature. The compressive behavior of concrete isobtained by employing Hognestad probala along withlinear descending branch. However the crushing of concrete is affected by the closed stirrups and some modifications are made for concrete in compression accordingto CEB-FIP MC90 (Fig. 5(a)) (CEB-FIB, 1993). Equationof the parabola is shown in Eq. (7) where σ is the compressive stress, fcu is ultimate compressive stress, c* isthe peak compressive strain, E is the elastic modulus andfc* is the modified compressive strength. Details of thismodel can be found in Arduini et al., 1997.10.(8)Table 1. Aggregate size-based fracture coefficients(Rots, 1988).Maximum aggregate sizedmax (mm)CoefficientGfo (J/m2)82516303258Thus, uniaxial tension and compression stress behavior are defined by using above mathematical models.These mathematical models are not enough to defineCDP model. As mentioned above damage parameters arerequired to specify the CDP model. But these damage parameters are not reported for the experiments that aregoing to be verified in this study. Most of the reinforcedconcrete flexural test reports in the literature are also
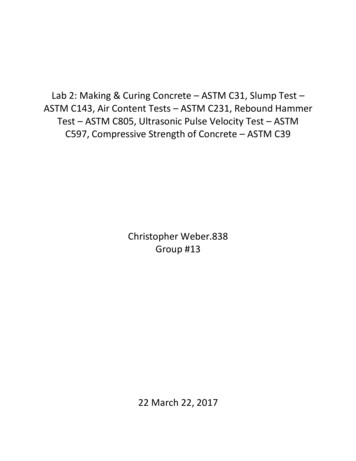
152Sümer and Aktaş / Challenge Journal of Structural Mechanics 1 (3) (2015) 149–155missing this information. Because to define these damage parameters, some laboratory tests in material levelshould be done in advance. In this study damage parameter for concrete compressive behavior is obtained froma verification problem given in ABAQUS verificationmanual. By applying curve fitting method to this examplea third degree polynomial curve as in Eq. (9) is obtainedfor this corresponding damage parameter (Fig. 6(a)).Then the very same equation is applied to get the damage parameter for the test cases that are going to be verified in this study. Also tension damage parameter is obtained by following the same behavior of example material given in ABAQUS verification manual (Fig. 6(b)).𝑦 2𝐸 0.6𝑥 3 41740𝑥 2 324. 𝑥 0.0052 .properties from different researchers, were selected forverification purpose. All the beams are tested under fourpoint load. Test layout and material properties for eachexperiment are given in Figure 8 and Table 2. All the details of Test Case 1, Test Case 2, and Test Case 3 can befound in Arduini et al. (1997), Benjeddou et al. (2007)and Sharif et al. (1994) respectively.(9)Fig. 7. Elastic perfectly plastic model for steel reinforcingbars.1(a)0,80,6dcy 2E 06x3 - 41740x2 324.24x 0.0052Model 10,4Model 2Model 30,2Abaqus-SampleTest Case 1000,0020,0040,0060,0080,010,012Inelastic strain1,2(b)10,8dtTest Case 20,6Test Case 10,4Test Case 2Test Case 30,2000,10,20,30,4DisplacementFig. 6. Compression and tension damage parametersused in the models a) Compression damage parameterb) Tension damage parameter.Test Case 3Fig. 8. Layout of test beam (dimensions are mm).4. Finite Element Modeling2.2. Uniaxial tension behavior of steelThe stress–strain curve of the reinforcing bar is assumed to be elastic perfectly plastic as shown in Fig. 7. Inthis model material yields under constant load. The parameters needed to specify this behavior are the modulusof elasticity (Es), poisson ratio ( ) and yield stress (fy).3. Verification Test GroupDeveloping the finite element model strategies for reinforced concrete beam is verified by the experimentstudies. A total of 3 beams with different mechanicalThe non-linear finite element software package,ABAQUS, is employed for numerical analysis. Since thereis no computational expense all the beams are modeledwith full geometry in 2 dimensions (Fig. 9). Steel bars areembedded in concrete with the same degrees of freedomwhich also means that there is a perfect bond betweenconcrete and steel. The advantage of the embeddedmodel is that it allows independent choice of the concrete mesh. Concrete is modeled by using four-nodedplain strain element with reduced integration formulation. Since first order elements use linear interpolationto obtain nodal displacements, the edges of these elements are unable to curve under bending resulting in
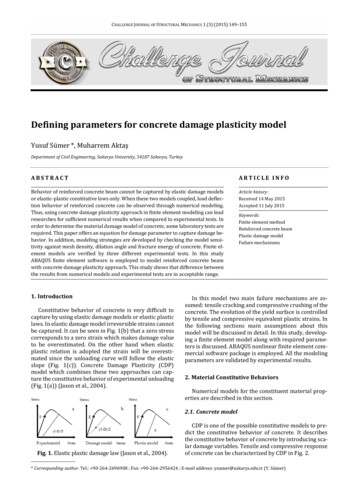
153Sümer and Aktaş / Challenge Journal of Structural Mechanics 1 (3) (2015) 149–155shear rather than bending deformation. This phenomenon is known as shear locking (Abaqus User Manual,2008). To overcome this problem element with reducedintegration formula is employed. All the beams areloaded by displacement control in the vertical direction.Finite element members and typical finite element meshgeometry employed in this study can be seen in Table 3and Fig. 9.Table 2. Material properties of test beams.TestCase BeamRef. NoWidth, Height, Shearspan (mm)E(GPa)(-)fc'(MPa)fy 27-37.7450--Table 3. Finite element types.MaterialDescriptionCodeAdditional informationConcreteFour-noded plain strainCPE4RReduced integrationSteelTwo-noded trussT2D2EmbeddedFig. 9. Typical finite element mesh of numerical models.5. Results and Discussions5.1. Test Case 1 (Arduini et al., entDA 35DA 37DA 40DA 4530M252010M5020M75100Load (KN)80Load (KN)Load (KN)It is clear that, the finite element simulation is very capable of capturing the experimentally observed loadingtrends and magnitudes for the entire loading range. Forthis test case, models with finer mesh captures the test result better than the models with course mesh (Fig. 10(a)).The best result is obtained with 50 mm mesh. The valuefor dilation angle for reinforced concrete in literature isgiven as 30 (Lubliner et al., 1989). Based on this information angle of dilation is varied to see the sensitivity ofthe results against it. Plots show that the results are notvarying dramatically as the dilation angle changes (Fig.10(b)). The best result is observed at 37 . As discussed before GF depends on the diameter of aggregate (Eq. (8)).Since the aggregate diameter is not reported in test reportthis value is also changed to see how it affects the results.With the best results obtained from both mesh sensitivityand the dilation angle analysis, GF is calculated for different aggregate diameter and result are plotted in Fig. 10(c).1020Displacement(mm)a) Mesh sensitivity3030ExperimentGF from da 8mmGF from da 16mmGF from da 32mm20100004001020Displacement (mm)30b) Dilation angle sensitivityFig. 10. Numerical results for Test Case 1.01020Displacement (mm)c) Fracture energy sensitivity30
154Sümer and Aktaş / Challenge Journal of Structural Mechanics 1 (3) (2015) 149–1555.2. Test Case 2 (Benjeddou et al., 2007)that the models are not dilation angle sensitive, in thismodel values for dilation angles are changed into 30 and 50 to seek for further different values. But still it isfound that the behavior can be captured within the rangeof the dilation angle value reported in the literature (Fig.11(b)). Also it is clear from this test case that modelingis not very sensitive to GF value (Fig. 9ExperimentDA 30DA 40DA 506M50321Load (KN)Load (KN)Load (KN)Similar results are also observed in this test case.However; models with finer mesh has more rigid behavior than models with course mesh. But still the differenceis in the acceptable range. Also 50 mm mesh gives thebest results as in Test Case 1 (Fig. 11(a)). Since it is found3M7005101520ExperimentGF from da 8mm6GF from da 16mm3GF from da 32mm000902551015200255a) Mesh sensitivity10152025Displacement (mm)Displacement (mm)Displacement (mm)b) Dilation angle sensitivityc) Fracture energy sensitivityFig. 11. Numerical results for Test Case 2.5.3. Test Case 3 (Sharif et al., 1994)This test case gives different results from other testcases. In this model some of the material properties arenot reported in the test report. For example; ft value isnot reported in the test report. ft value is calculated according to ACI (ACI 318, 1999). Unreported critical values such as elastic modulus, fc and ft change the resultsdramatically. But still the finite element simulation iscapable of capturing the loading trends. In this casemesh with 25 mm captures the results of the experiment (Fig. 12(a)). But mesh with 50 mm model givesunrealistic results. Authors think that this is much related to the unreported diameter value of aggregate.Because in this case, the results are also very sensitiveto GF unlike other cases (Fig. 12(c)). The mesh shouldbe selected with a dimension that should include thecontinuum properties of the material. Dilation angle of30 captures the best results in this test case (Fig.12(b)).6090806050504040Load (KN)Load (KN)60504030103020ExperimentM10M25M5020Load (KN)7005101520Displacement (mm)a) Mesh sensitivity2530GF from da 8mmGF from da 16mm10GF from da 32mm000Experiment20ExperimentDA 20DA 30DA 40103005101520Displacement (mm)2530b) Dilation angle sensitivity05101520Displacement (mm)2530c) Fracture energy sensitivityFig. 12. Numerical results for Test Case 3.Table 4 compares the experimental yield loads anddeflections with those obtained from the finite elementanalysis for three test cases. As can be seen in Table 4,the predicted yield load and deflections for Test Case 1and Test Case 2 is nearly same with experimental results.However, yield load is %7 higher than experimentalresult for the Test Case 3. According to these results,proposed finite-element model proves its capability toaccurately predict the load–deflection relationships ofthe reinforced concrete beams.
155Sümer and Aktaş / Challenge Journal of Structural Mechanics 1 (3) (2015) 149–155Table 4. Comparison of results.Test Case 1Test Case 2Test Case 3Yield Load(kN)Deflection(mm)Yield Load(kN)Deflection(mm)Yield 3Finite .011.001.000.941.071.006. ConclusionsThree different experimental tests are verified by using modeling strategies explained in the previous sections. Results show that experimentally observed loading trends and magnitudes for entire loading range of RCbeams can be captured by employing CDP modeling approach. Basically mesh density, dilation angle and concrete fracture energy are calibrated to develop modelingstrategies. It is obvious that if material properties andgeometrical information about real test are given in detail then numerical models give better results than thosewith missing information. Also this study proves that defining damage parameters for compression behaviorwith proposed equation gives satisfactory results. Butthis equation can be improved with real test results forfurther investigations.REFERENCESABAQUS (2008). User’s Manual, Version 6.8, Hibbitt, Karlsson&Sorensen, Inc., Pawtucket, Rhode Island, USA.ACI 318-99 (1999). Building Code Requirements for Structural Concrete and Commentary. American Concrete Institute, Detroit, MI.Arduini M, Di Tommaso A, Nanni A (1997). Brittle failure in FRPplate and sheet bonded beams. ACI Structural Journal, 94 (4),363-70.Benjeddou O, Ouezdou BM, Bedday A (2007). Damaged RC beams repaired by bonding of CFRP laminates. Construction and BuildingMaterials, 21(6), 1301-1310.Chen WF (1982). Plasticity in Reinforced Concrete, XV. New York:McGraw-Hill, 474.Comite Euro-International du Beton (1993). CEB-FIP Model Code1990 (CEB-FIP MC90). Bulletin D’Information, No. 215, Lausanne.Coronado CA, Lopez MM (2006). Sensitivity analysis of reinforced concrete beams strengthened with FRP laminates. Cement and Concrete Composites, 28(1), 102–114.Hillerborg A, Modeer M, Petersson PE (1976). Analysis of crack formation and crack growth in concrete by means of fracture mechanics and finite elements. Cement and Concrete Research, 6,773–782.Jason L, Pijaudier-Cabot G, Huerta A, Ghavamian S (2004). Damageand plasticity for concrete behavior. European Congress on Computational Methods in Applied Sciences and Engineering,Jyväskylä.Lubliner J, Oliver J, Oller S, Onate E (1989). Plastic-damage model forconcrete. International Journal of Solids Structures, 25(3), 299–326.Rots JG (1988). Computational Modeling of Concrete Fracture. Ph.D.thesis, Delft University of Technology, Delft, Netherlands.Sharif A, Al-Sulaimani GJ, Basunbul IA, Baluch MH, Ghaleb BN (1994).Strengthening of initially loaded reinforced concrete beams usingFRP plates. ACI Structural Journal, 91(2), 160-16.
model. ABAQUS allows us to specify Tension Stiffening by post failure stress-strain relation or by applying a fracture energy cracking criterion (Abaqus User Manual, 2008). There is a mesh sensitivity problem when cracking failure in not distributed evenly. This phenomenon ex-i