Transcription
ROUTLEDGE.TAYLOR & FRANCISHack AudioAn Introduction to to Computer Programming and Digital Signal Processing in MATLABby Eric TarrChapter 2 - Basics of Programming in MATLABwww.routledge.com/audio
Table of ContentsDedication List of TablesList of Figures Acknowledgements1 Introduction2 Basics of Programming in MATLAB3 Basics of Audio in MATLAB4 LAB Programming Environment5 Logicals and Control Structures in Programming6 Signal Gain and DC Offset7 Introduction to Signal Synthesis8 Summing, Fades, and Amplitude Modulation9 Stereo Panning and Mid-Side Processing10 Distortion, Saturation, and Clipping11 Echo Effects12 FIR Filters13 IIR Filters14 Delay Buffers and Fractional Delay15 Modulated Delay Effects16 Algorithmic Reverb Effects17 Amplitude Envelope Effects18 Dynamic Range Processors IndexHack AudioAn Introduction to Computer Programming and Digital SignalProcessing in MATLABBy Eric Tarr 2019– Routledge - 458 pagesPaperback: 9781138497559List Price: 69.95Hardback: 9781138497542List Price: 190.0030% Discount Available for AES MembersEnjoy a 30% discount across our entire range of Audio books. Simply add thediscount code AES30 at the checkout.Please note: This discount code cannot be combined with any other discount or offer and is only valid on printtitles purchased directly from www.routledge.com.www.routledge.com/audio
Chapter 2roupBasics of Programming in MATLAB G2.1 Introduction: Computer Programming in MATLABay-T2.2 Programming Languageslor&FrancisComputers can be used for calculations, analysis, visualization, and processing. These are allimportant tasks when working with audio. In order to program a computer to complete allthese tasks with audio information, it is important to understand how a computer performsthese tasks with more general types of information. This chapter introduces necessaryprogramming concepts in preparation for working with audio in Chapter 3.MaterialA programming language is a vocabulary or a set of instructions a computer can interpret.Computers can interpret many different programming languages. Despite their differences,many languages have similar constructs. As an analogy, there are many spoken languages thatuse the same conceptual constructs (nouns, verbs, punctuation, etc.), yet might incorporate theconstructs differently. The rules for what is allowed in a language is called syntax.CopyrightedDifferent programming languages have various advantages and disadvantages. Somelanguages allow for advanced control of the computer, but are complex. Other languages aresimpler, but have less control. MATLAB is a programming language specialized for scientificcomputing that makes many mathematical and engineering tasks intuitive while maintainingadvanced control of the computer. It is used in a diverse range of fields including statistics,finance, biomedical engineering, computer vision, wireless communication, robotics, andeconomics. More specifically for audio, MATLAB is a common language for DSP.Examples of other general-purpose programming languages are C/C , Java, HTML, Python,Fortran, Visual Basic, Swift, Objective-C, assembly, and machine code. Comparably,MATLAB has many aspects that make it very useful for working with audio. There are otherprogramming languages created specifically for working with audio. Some examples areCsound, FAUST, Max/MSP, ChucK, Pure Data, and SuperCollider.3
4Chapter 22.3 Executed CommandsA computer executes commands provided by a programmer to perform tasks. There areseveral analogies that can be used to illustrate the idea of executed commands by a computer:architectural blueprints provide the steps for a construction crew to build a structure; the linesin a movie script are followed by actors and actresses to perform a scene; and a recipe isfollowed by bakers and chefs when completing a dish or meal.GroupJust as there is an order to how blueprints, scripts, and recipes are meant to be completed, acomputer executes commands in a particular order. Therefore, it is important to carefullyorganize commands in the proper order for an application.ancisA command can be executed in MATLAB by typing it in the Command Window andpressing [RETURN].Fr2.3.1 Error Statements-Taylor&If a command is entered that cannot be executed by the computer, an error statement isdisplayed. The contents of the error statement depend on the problem with the executedcommand. The topic of error statements is further explored throughout this book.ial2.4 MathematicsMaterOne task computers excel at performing is mathematics. Even basic calculators are computersthat execute mathematical commands. Conventionally, computers use numbers and operatorsfor mathematics.ed2.4.1 OperatorsCopyrightMany common mathematical symbols are designated as operators in programminglanguages. MATLAB uses the following symbols for basic mathematical operations: (addition), – (subtraction), * (multiplication), / (division), and (exponentiation).Parantheses, ( and ), are also available in MATLAB to control the order of operations.MATLAB executes calculations based on an order of operations used in most calculators.A programmer should be intentional about the order executed in their commands. Otherwise,unexpected results from the computer may occur. The order of precedence from highest tolowest is: parentheses (for nested parentheses, the innermost are executed first),exponentiation, multiplication and division (equal precedence), addition and subtraction(equal precedence). If an expression has multiple operations of equal precedence, theexpression is executed from left to right.
Basics of Programming in MATLAB 5In Example 2.1, several commands are provided to demonstrate the use of mathematicaloperators. Each command should be executed individually and the answer observed.Examples: Execute the following commands in MATLAB. 2 3 2 – 3 2 * 3up 2 / 3 10 8 / 2ro (10 8) / 2ancExample 2.1: Arithmetic in MATLABisG 2 3aylor&FrThere are other mathematical operations for which an operator symbol is not defined. Instead,MATLAB has many predefined mathematical functions, called built-in functions. Thesefunctions can be used along with mathematical operators. Table 2.1 displays several commonmathematical functions in MATLAB. More information can be found in the MATLAB helpdocumentation for functions.erial-TIn Example 2.2, there are several commands that demonstrate the use of mathematicalfunctions. Each command should be executed individually and the answer observed.MatTable 2.1: Mathematical operators in MATLABlog2(x)Base 2 Logarithm log2Sinemax(x)Maximum Valueasin(x)Arc Sinemin(x)Minimum Valuecos(x)Cosineabs(x)Absolute Valueacos(x)Arc Cosinesign(x)Signum Functiontan(x)Tangentround(x)Round to Nearest Integeratan(x)Arc Tangentfix(x)Round towards 0exp(x)Natural Number exceil(x)Round towards log(x)Natural Logarithm logefloor(x)Round towards log10(x)Base 10 Logarithm log10conj(x)Complex ConjugateSquare Rootedsqrt(x)Copyrightsin(x)
6Chapter 2Examples: Execute the following commands in MATLAB. sqrt(9) abs(–9) log10(100) cos(0) asin(1) exp(1)up sign(5)ro sign(–5)G round(8.1)is ceil(8.1)ancExample 2.2: Mathematical functions in MATLABFr2.4.2 Variablesial-Taylor&Variables are an aspect of computer programming languages that allow for information to beassigned, stored, and recalled. As an example, when MATLAB is used as a basic calculator,the result of a command is stored in the MATLAB Workspace as the current answer, calledans. This result can be iteratively recalled. In Example 2.3, notice that the result from the firstexecuted command is used as the value of the variable ans in the second command. Then, theresult of the second command is used as the value of the variable ans in the third command.MaterExamples: Execute the following commands in MATLAB. 5 6 ans 3Example 2.3: Using the ans variablerighted ans 4CopyDuring the execution of this command, MATLAB has implicitly assigned the result of thecalculation to a variable. Variables can be explicitly created using an equals sign, . This ismore accurately called the assignment operator in computer programming. When a variableis created, it is assigned a value and given a name. Then, when the variable name is used insubsequent commands, the variable value is inserted in place of the variable name.The process to create a variable is the following. As part of a command, the name of a variableis written by itself on the left side of the assignment operator. The variable is assigned thevalue of the result of the right side of assignment operator. It should be noted that the reverseorder is not permitted in MATLAB. In Example 2.4, the syntax for assigning variables isdemonstrated. An example of using invalid syntax is included to demonstrate an error to avoid.
Basics of Programming in MATLAB 7Examples: Execute the following commands in MATLAB. a 1 x 5 6 y x – 3 y x zErr 3xup z 3 * xGroExample 2.4: Assigning variablesancisJust as a value can be assigned or written to a variable, it can also be overwritten. Therefore, itis always important to be aware of how the value of a variable can change throughout acomputer program.FrExamples: Execute the following commands in MATLAB.& h 4lor y h 1ay h y-T y h 1ialExample 2.5: Overwriting variablesMaterA semicolon can be used at the end of an assignment statement to suppress the output to theMATLAB Command Window. In other words, the result of the assignment statement is notprinted to the Command Window, yet the variable is still stored in the Workspace.ht r 12;edExamples: Execute the following commands in MATLAB.rig t r – 6;Example 2.6: Suppressing execution outputCopy s r / tVariable Naming Rules and ConventionsThe names of variables can be individual letters or multiple letters. Variable names can alsocontain numbers, but the first character in a variable name cannot be a number. Other symbols(@, #, , %, &, etc.) commonly found on QWERTY keyboards cannot be used in variablenames. Variable names cannot contain spaces.
8Chapter 2It is common practice to name variables based on their meaning or purpose wheneverpossible. Although the naming of variables is arbitrary from the computer’s perspective, it canhelp a programmer understand command statements in a program. Furthermore, manyprogrammers follow a convention called camel case or camel caps. In this convention,variable names start with lowercase letters. Then, the first letter in concatenated words iscapitalized (e.g., numOfSeconds, audioSignal). In Example 2.7, the naming rules andconventions of variables are demonstrated, including examples of invalid names.upExamples: Execute the following commands in MATLAB.ro regulationTime 90;G extraTime 4;is totalTime regulationTime extraTime;anc 4square 66; square4 66;Fr four square 66;aylor&Example 2.7: Naming variables-T2.5 Data TypesopyrightedMaterialComputers can process different types of data or information. Just as many spoken andwritten languages use different types of information, computer languages also make use ofvarious data types. As an example, the number 2 in the English language can be writtenwith a numerical symbol, “2”. It can also be written with a sequence of text characters, “two”.In certain circumstances it is appropriate to use the numerical symbol and in othercircumstances it is appropriate to use the text characters. A computer processes and storesinformation on different data types depending on when it is appropriate, efficient, and intuitiveto a user.C2.5.1 NumbersProgramming languages, including MATLAB, can store numerical representations ofinformation or data. An example of this is a variable that stores a number as its value. Anothername for a single number is a scalar.There are many different types of numerical representations in MATLAB including 16-bitfixed-point, 24-bit fixed-point, and 32-bit floating-point numbers, which are common fordigital audio. As a default, MATLAB uses 64-bit double-precision floating-point numbers.Although there are many different types, in many cases it is not necessary for a MATLABprogrammer to determine which to use, as it is automatically set by the computer.
Basics of Programming in MATLAB 92.5.2 CharactersAside from storing numbers as values, MATLAB can store text as information. A single unitof text is called a character. Characters can be letters, symbols, and numbers. Characters canbe assigned to variables, and created by putting text between single quotation marks.Examples: Execute the following commands in MATLAB. Y 'a'up X 'A'ro W '#' V '3'ancExample 2.8: Creating charactersisG errW #lor&FrIt is important to note that the use of a numerical symbol as a character has a different meaningto a computer than the same symbol as a numerical data type (i.e., '3' is different than 3).ay2.5.3 Stringsial-TMultiple characters can be combined together to create a string. Letters, symbols (includingwhite space), and numbers can be used in the same string by enclosing the characters in singlequotations.MaterExamples: Execute the following commands in MATLAB. Y 'aA#3'Example 2.9: Creating stringsrighted X 'Hello World!'opyString ConcatenationCTwo or more strings can be combined together to create a new string. This process is calledconcatenation, and can be accomplished by using square brackets, [ , ], or the built-infunction strcat.Examples: Execute the following commands in MATLAB. a 'Hello' b 'World' c [ a b ] cc strcat(a,b) B ' World!'
10Chapter 2 C [ a B ] d [ a ; b ] D [ a ; B ] D char(a,b)Example 2.10: String concatenationup2.6 ArraysisGroIn MATLAB, arrays are used to arrange and group multiple values together. The individualvalues in an array are called elements. If strings are a method to arrange and group characters,arrays are a more general method of grouping information.FrancArrays can contain sets of numbers, characters, strings, or even other arrays. Just as it is withstrings, the process of combining multiple arrays is called concatenation. As a rule, a singlearray is limited to a single data type. An array cannot contain different data types.-Taylor&The elements in an array must be arranged in a rectangular shape with one or more columnsand one or more rows. To be a valid array, if one column has a certain number of rows, then allother columns must have the same number of rows. Likewise, if one row has a certain numberof columns, then all other rows must have the same number of columns.ial2.6.1 Basic Array CreationedMaterA one-dimensional array, or vector, is a sequence of information in either one row or onecolumn. A row vector is created by enclosing a sequence of data, separated by spaces,between square brackets. A column vector is created by enclosing a sequence of data,separated by semicolons, between square brackets.rightExamples: Execute the following commands in MATLAB. arr [ 5 ]opy rowVec [ 1 2 3 4 ] colVec [ 1 ; 2 ; 3 ; 4 ]C charVec [ 'H' 'e' 'l' 'l' 'o' ] strCol [ 'One' ; 'Two' ] strErr [ 'One' ; 'Two' ; 'Three' ] strRow1 [ 'One' 'Two' 'Three'] strRow2 [ 'One ' 'Two' ' Three'] rowConcat [ rowVec arr ] colErr [ colVec arr ] colConcat [ colVec ; arr ]Example 2.11: Creating arrays
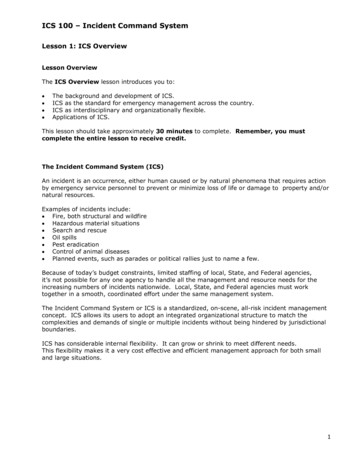
Basics of Programming in MATLAB 11A two-dimensional array, or matrix, is a set of information stored in multiple rows andcolumns. The dimensions of a matrix are rectangular. Therefore, it is not necessary for thenumber of rows to be the same as the number of columns.Examples: Execute the following commands in MATLAB. mat1 [ 1 2 3 ; 4 5 6 ] mat2 [ 1 2 ; 3 4 ; 5 6]up mat3 [ mat1 ; 7 8 9 ]ro mat4 [ mat2 ; 7 8 ]GExample 2.12: Creating matricesancis2.6.2 Plotting Arrays&FrThe MATLAB function, plot, can be used for plotting arrays. By default, it plots a lineconnecting the values of an array. With one input variable, the function, plot(t), displays aline connecting the values of each element, t[n], versus the element number, n.lorExamples: Execute the following commands in MATLAB.ay t [ 5 2 4 4 –3 3 ];-T plot(t);erialExample 2.13: Plotting arraysMatThe resulting output is shown in Figure 2.1. In this case, the value of each element is plottedalong the vertical axis versus the element number on the horizontal axis.ed5Copyright43210–1–2–312345Figure 2.1: Example of the plot function6
12Chapter 22.7 Mathematical FunctionsA mathematical function is a relationship between a dependent variable (y) and anindependent variable (x). The value of “y” is based on, or dependent on, the value of “x.” Asan example, a linear relationship between a dependent variable and independent variable isy mx b, where “m” refers to the slope and “b” refers to the offset or y-intercept.GroupFor every value of “x,” a value of “y” can be calculated. Given a value of “x,” the value of “y”is written y(x). A sequence of values of “y” at regular intervals, x {1, 2, 3, 4, .}, can bewritten y(x) {y(1), y(2), y(3), y(4), .}. A MATLAB array is one method to store the values ofmathematical functions.ancis2.7.1 Plotting Mathematical Functionslor&FrWith two input variables, the function plot(x,y) displays a line connecting the values of thesecond variable, y, versus the first variable, x. In Example 2.14, the provided commands canbe executed to assign arrays to variables. Then, the variables are plotted to display severalvalues of a mathematical function.ayExamples: Execute the following commands in MATLAB.-T m 3; b 1;ial x [ 0 1 2 3 ];er y [ (m * 0 b) , (m * 1 b) , (m * 2 b) , (m * 3 b) ]Mat plot(x,y); t [ 0 , pi/2 , pi , 3 * pi/2 , 2 * pi];ed a [ sin(0) , sin(pi/2) , sin(pi) , sin(3 * pi/2) , sin(2 * pi)];ht plot(t,a);opyrigExample 2.14: Plotting mathematical functionsC2.8 APPENDIX: Additional Plotting OptionsThere are many plotting options in MATLAB for customizing the visualization ofinformation. This appendix covers several of the options. The MATLAB help documentationfor plot provides complete details of available functionality.2.8.1 Line SpecificationThere are many possibilities for setting the display options of a line on a plot. These optionsinclude the color, style, and width of a line.
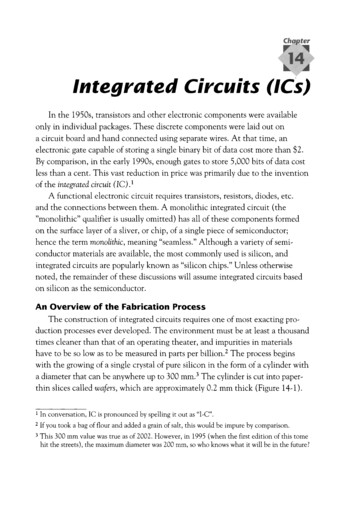
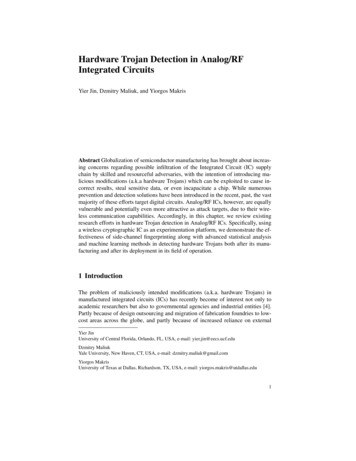
Basics of Programming in MATLAB 13Table 2.2: Plot line colors and styles in MATLABColorSpecifierStyle'r'Red'–'Solid Line (Default)'g'Green'––'Dashed Line'b'Blue':'Dotted Line'c'Cyan'–.'Dash-Dot Line'm'Magenta'o'Circle Marker'y'Yellow'*'Asterisk Marker'k'Black' 'Plus Sign Marker'w'White'.'Dot MarkerFrancisGroupSpecifier&Line Color and StyleaylorThe color and style for each line can be set in the plot function. Table 2.2 displays severaloptions for additional input variables to the plot function.ial-TThe line specifiers for color and style can be used together in the same set of single quotationsas a single input variable to the plot function; this is demonstrated in Example 2.15. TheMATLAB documention for Line Specification provides additional details about line options.MaterLine WidthedThe width of the plotted line can be set using the 'LineWidth' attribute. It is specified as aninput variable to the plot function, followed by a positive number. The 'LineWidth'attribute is demonstrated in Example 2.15, and the result is shown in Figures 2.2 and 2.3.rightExamples: Execute the following commands in MATLAB.opy x [ 0 ; 1 ; 2 ; 3 ; 4 ]; y [ 0 2 ; 1 2 ; 2 2 ; 3 2 ; 4 2 ];C plot(x,y,'r––','LineWidth',4); z [ 0 3 ; 1 3 ; 2 3 ; 3 3 ; 4 3 ]; plot(x,z,'k:o','LineWidth',2);Example 2.15: Plot line optionsStem PlotA similar function to plot is the stem function, which produces a stem plot. An example ofthe stem function is shown in Figure 2.4.
14Chapter 216141210up8ro6G40.511.522.53anc03.54Fr0is2&Figure 2.2: Plot line style options: Example 22.533.5Figure 2.3: Plot line style options: Example 2Examples: Execute the following commands in MATLAB. x [ 0 ; 1 ; 2 ; 3 ; 4 ]; y [ sqrt(0) ; sqrt(1) ; sqrt(2) ; sqrt(3) ; sqrt(4) ]; stem(x,y)Example 2.16: Stem plot function4
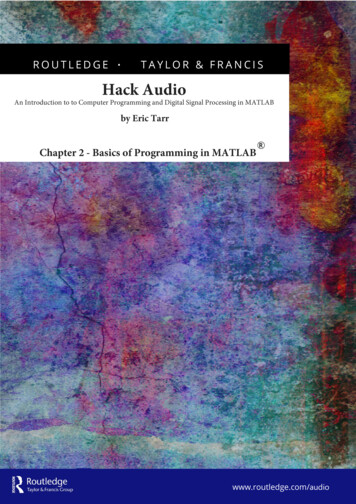
Basics of Programming in MATLAB s0.43.54lor&Figure 2.4: Example of the stem plot functionay2.8.2 Axis LabelsMat2.8.3 Figure Titleerial-TThe label of the x- and y-axes can be set by using the functions xlabel('string')and ylabel('string'), respectively. The use of these functions is demonstrated inExample 2.17.rightedThe title of a figure can be set by using the function title('string'). The use of thisfunction is demonstrated in Example 2.17.opy2.8.4 Figure LegendCA legend can be added to a figure by using the function legend('string1','string2',.). It is necessary for the number of input variables to the legend function to match thenumber of plotted arrays. The use of this function is demonstrated in Example 2.18.2.8.5 Axis ScaleThe axis scale in a figure can be changed from linear to logarithmic by using the followingfunctions instead of plot(x,y). The function semilogx(x,y) makes the x-axislogarithmic. The function semilogy(x,y) makes the y-axis logarithmic. The function
16Chapter 2Base 10 logarithmic 1&0 010Fr0.5-TayFigure 2.5: Example of the semilog plot functionloglog(x,y) makes the x- and y-axes logarithmic. In Example 2.17, several plottingialfunctions are demonstrated with the result shown in Figure 2.5.MaterExamples: Execute the following commands in MATLAB. x [ 1 ; 10 ; 100 ; 1000 ; 10000 ]; y 0000)];ed semilogx(x,y,'–x');ht title('Base 10 Logarithmic Function');rig xlabel('x');Example 2.17: Logarithmic axis scaleCopy ylabel('y(x)');2.8.6 Axis DimensionsBy default, the span of the x-axis and y-axis in a figure fits the data. However, the span of thex-axis and y-axis can be user specified by using the axis function. The following syntax canbe used to set the limits for the x-axis and y-axis on the current figure:axis([xmin xmax ymin ymax]). Example 2.18 demonstrates the function to change theaxis dimensions with the result shown in Figure 2.6.
Basics of Programming in MATLAB 17Square-root 56aylorFigure 2.6: Example of the axis and legend functions x [ 0 ; 1 ; 2 ; 3 ; 4 ];-TExamples: Execute the following commands in MATLAB.ial y [ sqrt(0) ; sqrt(1) ; sqrt(2) ; sqrt(3) ; sqrt(4) ];er plot(x,y);Mat title('Square–Root Function'); axis([–1 6 –2 4]);Example 2.18: Setting axis dimensionsrighted legend('sqrt(x)');opy2.8.7 Multiple ArraysCThere are several possible methods to plot multiple arrays. Multiple figure windows can beopened and each set with their own plot. Multiple arrays can be plotted on the same axes in afigure. Additionally, separate axes can be plotted within the same figure.Multiple WindowsThe figure function can be used to open and plot in multiple windows. By default, each figurewindow is automatically numbered. A plot can be placed in a specified window by including anumber as an input variable to the figure(num) function. The use of this function isdemonstrated in Example 2.19.
18Chapter 4lor&Figure 2.7: Plot of two functions in one figure windowayIdentical Dimensionsial-TMultiple arrays can be plotted in the same figure by using the plot function, if thedimensions of the arrays are identical. This is demonstrated in Example 2.19 and Figure 2.7.erExamples: Execute the following commands in MATLAB.Mat x [ 0 ; 1 ; 2 ; 3 ; 4 ]; y [ sqrt(0) ; sqrt(1) ; sqrt(2) ; sqrt(3) ; sqrt(4) ];ed z [ 0 2 ; 1 2 ; 2 2 ; 3 2 ; 4 2 ];ht plot(x,y);rig figure; plot(x,z);opy figure(3); plot(x,y,x,z);C legend('sqrt','pow2');Example 2.19: Plot commands for multiple functions in one windowFigure HoldMultiple arrays with different dimensions can be plotted in the same figure by using hold onand hold off. The same figure window is held open for each executed plot commandbetween hold on and hold off. (Example 2.20, Figure 2.8)
Basics of Programming in MATLAB 619line 1line 2line 3543roup2isG1–1–202Franc046810aylor&Figure 2.8: Example of hold on and hold off functionsial x [ –2 ; –1 ; 0 ; 1 ; 2 ];-TExamples: Execute the following commands in MATLAB. a [ 1 ; 2 ; 3 ];Mat b [ 4 ; 5 ; 6 ];ht plot(a,b);ed plot(x,y); hold on;er y [ abs(–2) ; abs(–1) ; abs(0) ; abs(1) ; abs(2) ];rig plot([9 ; 10], [–1 ; 6]); legend('line1','line2','line3');Copy hold off;Example 2.20: Plot commands hold on and hold offSubplotSeparate axes (and arrays) can be plotted within the same figure by using the subplotfunction. This function specifies the number of axes and their arrangement within a singlefigure. The MATLAB documention for subplot provides additional details about its use. It isdemonstrated in Example 2.21 and Figure 2.9.
20Chapter 2Examples: Execute the following commands in MATLAB. x [ –2 ; –1 ; 0 ; 1 ; 2 ]; y [ abs(–2) ; abs(–1) ; abs(0) ; abs(1) ; abs(2) ]; a [ 1 ; 2 ; 3 ]; b [ 4 ; 5 ; 6 ]; subplot(2,1,1); plot(x,y);up subplot(2,1,2);ro plot(a,b);ancisGExample 2.21: Subplot 5C0.5Mat5.540ial6–0.5-T0–2ay0.51.522.5Figure 2.9: Using subplot for multiple functions3
Basics of Programming in MATLAB: 2.1 Introduction: Computer Programming in MATLAB Computers can be used for calculations, analysis, visualization, and processing. These are all important tasks when working with audio. In order to program a computer to complete all these tasks with audio info