Transcription
June 2021ResearchInstituteGlobal wealth databook 2021Thought leadership from Credit Suisse and the world’s foremost experts
PrefaceFor the past 12 years, the Credit SuisseResearch Institute’s Global Wealth Report hasbeen the leading reference on global householdwealth. It contains the most comprehensive andup-to-date findings on global wealth across theentire wealth spectrum – from the very base ofthe “wealth pyramid,” covering 2.9 billion adultswith wealth below USD 10,000, to those at theapex of the wealth pyramid, who now comprise1.1% of the adult population and own 45.8%of household wealth. During the 12 monthsup to end-2020, and in spite of the economicdisruption caused by the COVID-19 pandemic,we estimate that aggregate global wealth hasrisen by USD 28.7 trillion ( 7.4%) to a combinedtotal of USD 418.3 trillion. Wealth per adult grewby 6% to a new record high of USD 79,952per adult. The core reason for the apparentdisconnect between the ongoing global recessionin 2020 and household wealth is the pre-emptiveaction taken by governments and central banks,and the rapid development of COVID vaccines,which combined led to a strong rally in financialassets.While the Global Wealth Report highlights themain features of global wealth holdings in recentyears, the Credit Suisse Research Institute’sGlobal Wealth Databook provides a great dealmore detail. It presents a considerable quantityof additional data on the level and distributionof household wealth across countries, as wellas describing the data sources used in theproject and the methodology used to obtain thepublished results. This level of detail sets it apartfrom other reports in this field.2Research for the Global Wealth Report andGlobal Wealth Databook has been undertaken onbehalf of the Credit Suisse Research Institute byProfessors Anthony Shorrocks and Jim Davies,recognized authorities on this topic, assistedby Dr. Rodrigo Lluberas. The Credit SuisseResearch Institute is Credit Suisse's in-housethink tank. The Institute was established inthe aftermath of the 2008 financial crisis withthe objective of studying long-term economicdevelopments, which have – or promise to have– a global impact within and beyond the financialservices industry.The Global Wealth Databook provides estimatesfor the level and distribution of wealth for over200 countries for the period from 2000 toend-2020. It covers the pattern and trend ofhousehold wealth at both the regional andcountry levels. This year’s report examines inmore detail the development of wealth andwealth distribution in what has been a truly outof-the-ordinary year. Particular attention is paidto the continued growing importance of Chinaand other emerging economies in global wealthcreation, and to the differences across groups ofcountries that share a number of demographicand economic features.Nannette Hechler-Fayd'herbeChief Investment Officer International WealthManagement and Global Head of Economics &Research, Credit Suisse
4Section 1Estimating the pattern of global household wealth9Table 1-1Coverage of wealth levels data10Table 1-2Household balance sheet and financial balance sheet sources12Table 1-3Survey sources14Table 1-4Changes in asset prices and exchange rates 2020, selected countries15Table 1-5Wealth shares for countries with wealth distribution data19Section 2Household wealth levels, 2000–2021Table 2-1Country details25Table 2-2 (by year) Wealth estimates by country 2000–20109Table 2-3Components of wealth per adult in USD, by region and year110Table 2-4Components of wealth as percentage of gross wealth, by region and year111Table 2-5Changes in household wealth 2020, selected countries112Section 3Estimating the distribution of global wealth115Table 3-1Wealth pattern within countries, 2020119Table 3-2Wealth pattern by region, 2020120Table 3-3Membership of top wealth groups for selected countries, 2020121Table 3-4Percentage membership of global wealth deciles and top percentiles by country of residence, 2020125Table 3-5Main gains and losses in global wealth distribution, 2020126Table 3-6High net worth individuals by country and region, 2020128Section 4Region and country focus130Table 4-1Summary details for regions and selected countries, 2020131Table 4-2Wealth per adult (USD) at current and smooth exchange rates, for regions and selected countries, 2000–20133Table 4-3Total wealth (USD trn) at current and smooth exchange rates, for regions and selected countries, 2000–20135Table 4-4Composition of wealth per adult for regions and selected countries, 2020136Table 4-5Wealth shares and minimum wealth of deciles and top percentiles for regions and selected countries, 2020137Table 4-6Distribution of wealth for regions and selected countries, 2020140Bibliography and data references143About the authors144General disclaimer / Important informationGlobal wealth databook 20213
1.1 IntroductionWe provide estimates of the wealth holdings ofhouseholds around the world for each year since2000. More specifically, we are interested in thedistribution within and across nations of individualnet worth, defined as the marketable value offinancial assets plus non-financial assets(principally housing and land) less debts. Nocountry in the world has a single comprehensivesource of information on personal wealth, andmany low- and middle-income countries havelittle direct evidence of any kind. However, agrowing number of countries – including Chinaand India as well as many high-income countries– have relevant data from a variety of differentsources, which we are able to exploit in order toachieve our objective.We begin with 227 countries or economicallyself-governing territories (such as Hong Kong,SAR) whose population sizes are recorded by theUnited Nations. These include 39 small islandstates, which, for convenience, we merge into sixcountry groupings. “British Caribbean”: Anguilla, Antigua andBarbuda, British Virgin Islands, CaymanIslands, Dominica, Grenada, Montserrat, St.Kitts and Nevis, St. Lucia, St. Vincent andthe Grenadines and Turks and CaicosIslands. “Dutch Caribbean”: Aruba, Bonaire,Sint Eustatius and Saba, Curacao, andSt Maarten. “French Caribbean”: Guadeloupe, Martinique,Saint Barthélemy, Saint Martin, and SaintPierre and Miquelon. Melanesia: New Caledonia, Solomon Islands,and Vanuatu. Micronesia: Guam, Kiribati, Marshall Islands,Micronesia, Nauru, Northern MarianaIslands, and Palau, Polynesia: American Samoa, Cook Islands,French Polynesia, Niue, Samoa, Tokelau,Tonga, Tuvalu, and Wallis and Futuna Islands4These are treated as if they are countries, andtheir characteristics (e.g. GDP per adult) are thegroup averages. This reduces the number of“countries” we consider to the 194 listed in Table2-1 along with some summary details. Note thatChina and India are treated as separate regionsdue to the size of their populations.Our estimation procedure involves three mainsteps, the first two of which follow the structureset out in Davies et al. (2008, 2011). (See alsoDavies et al., 2017.) The first step establishesthe average level of wealth for each country. Thebest source of data for this purpose is householdbalance sheet (HBS) data, which are nowprovided by 50 countries, although 25 of thesecountries cover only financial assets and debts.For an additional three countries, wealth levelscan be calculated from household survey data.Together these countries cover 63% of theglobal population and 96% of total global wealth.The results are supplemented by econometrictechniques, which generate estimates of the levelof wealth in countries that lack direct informationfor one or more years.The second step involves constructing thepattern of wealth holdings within nations. We usedirect data on the distribution of wealth for 37countries. Inspection of data for these countriessuggests a relationship between wealthdistribution and income distribution, which can beexploited in order to provide an initial estimate ofwealth distribution for the other 157 countries,which have data on income distribution but noton wealth ownership.It is well known that the traditional sources ofwealth distribution data are unlikely to provide anaccurate picture of wealth ownership in the toptail of the distribution for most countries. Toovercome this deficiency, the third step makesuse of the information in the Forbes world list ofbillionaires to adjust the wealth distributionpattern in the highest wealth ranges.
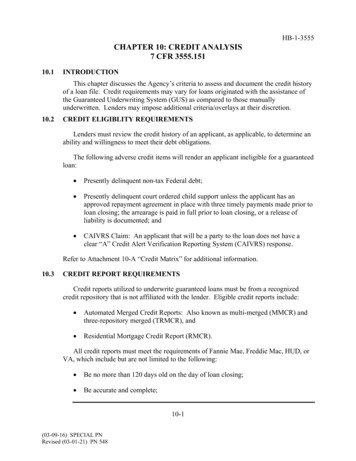
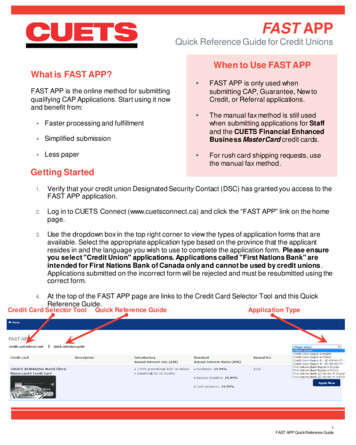
Implementing these procedures leaves 26countries for which it is difficult to estimate eitherthe level of household wealth or the distribution ofwealth, or both. Usually the countries concernedare small (e.g. Andorra, Bermuda, Monaco) orsemi-detached from the global economy (e.g.Cuba, Somalia, North Korea). Excluding thesenations from the global picture would make littledifference to our estimates of the pattern of globalwealth. However, for completeness, we assumethese countries have the same wealth/GDP ratioand the same wealth distribution pattern as the(United Nations) subregion to which they belong.The less reliable nature of these estimates meansthat we do not report the details in the summaryTable 2-2 or elsewhere.The following sections describe the estimationprocedures in more detail. Two other generalpoints should be mentioned at the outset. First,we use official exchange rates throughout toconvert currencies to our standard measure ofvalue, which is US dollars at the time in question.In international comparisons of consumption orincome it is common to convert currencies usingpurchasing power parity (PPP) exchange rates,which take account of local prices, especially fornon-traded services. However, in all countries, alarge share of personal wealth is owned byhouseholds in the top few percentiles of thedistribution, who tend to be internationally mobileand to move their assets across borders withsignificant frequency. For such people, theprevailing foreign currency rate is most relevantfor international comparisons. So there is astronger case for using official exchange rates instudies of global wealth.The second issue concerns the appropriate unitof analysis. A case can be made for basing theanalysis on households or families. However,personal assets and debts are typically owned (orowed) by named individuals and may be retainedby those individuals if they leave the family.Furthermore, even though some householdassets, such as housing, provide communalbenefits in households that include membersother than a single individual or married couple, itis unusual for members to have an equal say inthe management of assets, or to share equally inthe proceeds if the asset is sold. Membership ofhouseholds can be quite fluid (e.g. with respectto older children living away from home) and thepattern of household structure varies markedlyacross countries. For all these reasons – plus thepractical consideration that the number ofhouseholds is unknown in most countries – weprefer to base our analysis on individuals ratherthan household or family units. More specifically,since children have little formal or actual wealthownership, we focus on wealth ownership byadults, defined to be individuals aged 20 orabove.1.2 Household balance sheet dataThe most reliable source of information onhousehold wealth is household balance sheet(HBS) data. As shown in Table 1-1, “complete”financial and non-financial balance sheet data areavailable for 25 countries for at least one year.These are predominantly high-income countries,the exceptions being China, Mexico and SouthAfrica, which fall within the upper middle-incomecategory according to the World Bank. The dataare described as complete if financial assets,liabilities and non-financial assets are alladequately covered. Another 26 countries havefinancial balance sheets, but no details of realassets. This group contains nine upper middleincome countries, six lower middle-incomecountries, and one low-income country (India).Hence it is less biased toward the rich world thanthe group with complete household balancesheets. The sources of these data are recordedin Table 1-2.Europe and North America, and OECD countries,in particular, are well represented among countrieswith HBS data. China joined this group last year.There has been considerable recent discussion ofthe household balance sheet in China. Li (2017)surveys the series that have been developed bydifferent researchers. Piketty et al. (2017, 2018)provide the most comprehensive data and also thelongest times series, so we use their estimateshere. Li (2017) shows that his own independentestimates, which are for 2004–14 only, are similarto those of Piketty et al., (2017) if farmland isomitted from the latter. This provides support forthe accuracy of the Piketty et al. estimates, butalso a reason to prefer them in addition to thegreater length of their time series, since farmlandis a key household asset in rural China. Piketty etal. estimate the value of this land carefully, takinginto account its increasingly private character overtime.HBS coverage is sparse in Africa, Asia and LatinAmerica. Survey evidence on wealth is availablefor Uruguay ad Indonesia, which compensates alittle for this deficiency. Also, financial HBS dataare available for Russia. nine other Europeantransition countries, and India, which helps tomake coverage more complete.1.3 Household survey dataInformation on assets and debts is collected innationally representative surveys undertaken inan increasing number of countries (see Table 1-3for our current list and sources.) For twocountries, this is the only data we have, and weuse it to help estimate wealth levels, as explainedin the next section, as well as distributions. Dataon wealth obtained from household surveys varyin quality, due to the sampling and non-samplingproblems faced by all sample surveys. The highskewness of wealth distributions makes samplingGlobal wealth databook 20215
error important. Non-sampling error is also aproblem due to differential response rates –above some level wealthier households are lesslikely to participate – and under-reporting,especially of financial assets. Both of theseproblems make it difficult to obtain an accuratepicture of the upper tail of the wealth distributionusing survey evidence alone. To compensate,wealthier households are over-sampled in anincreasing number of surveys. This is best doneusing individual information, as in the US Surveyof Consumer Finances, the Household Financeand Consumption (HFCS) surveys in Finland,France and Spain, and the Wealth and AssetsSurvey (WAS) in the United Kingdom(Vermeulen, 2018). Over-sampling at the upperend is not routinely adopted by the developingcountries, which include asset information in theirhousehold surveys, but the reported responserates are much higher than in developedcountries and the sample sizes are large in somecases, e.g. in India.The U.S. Survey of Consumer Finance issufficiently well designed to capture mosthousehold wealth, but this is atypical. Inparticular, surveys usually yield lower totals forfinancial assets compared with HBS data.However, surveys generally do remarkably wellfor owner-occupied housing, which is the maincomponent of non-financial assets (see Daviesand Shorrocks, 2000, p. 630). Our methodologyrecognizes the general under-reporting offinancial assets in surveys and attempts tocorrect this deficiency.For countries which have both HBS and surveydata, we give priority to the HBS figures. TheHBS estimates typically use a country’s wealthsurvey results as one input, but also take accountof other sources of information and shouldtherefore dominate wealth survey estimates inquality. However, this does not ensure that HBSdata are error-free.1.4 Estimating the level and composition ofwealth for other countriesWe use standard econometric techniques toestablish the determinants of per capita wealthlevels in the 53 countries with HBS or surveydata in at least one year. The regressionequations are then used to estimate wealthlevels in the countries that have no direct dataon wealth. Availability of data on the explanatoryvariables needed for the latter procedure limitsthe number of countries that can be included.However, we are able to estimate wealth valuesfor 172 countries, which collectively cover 98%of the world’s population in 2020 either fromdirect data on wealth or by using thisregression-based procedure. There is a tradeoff here between coverage and reliability.Alternative sets of explanatory variables could6achieve greater country coverage, but notwithout compromising the quality of theregression-based estimates.Separate regressions are run for financial assets,non-financial assets and liabilities. As errors inthe three equations are likely to be correlated,the seemingly unrelated regressions (SUR)technique due to Zellner (1962) is applied, butonly to financial assets and liabilities, since thereare fewer observations for non-financial assets.The independent variables selected are as listedin Davies et al. (2017). In particular, we include adummy for cases where the data source is asurvey rather than HBS data. This turns out to benegative and highly significant in the financialassets regression, indicating that the averagelevel of financial assets tends to be much lowerwhen the data derive from sample surveys. Weuse this result to adjust upwards the value offinancial assets in the wealth level estimates forIndonesia and Uruguay. We also include regionincome dummies to capture any common fixedeffects at the region-income level, and yeardummies to control for shocks – like the globalfinancial crisis – or time trends that affect theworld as a whole.The resulting estimates of net worth per adultand the three components are reported in Table2-2 for the years 2000 to 2020. HBS data areused where available (see Table 1-1); adjustedsurvey means are used for India, Indonesia, andUruguay in specific years, except for financialassets in the case of India as explained above.Wealth is partly or fully estimated using theregression-based approach described above for144 countries.For a few countries, including the United States,wealth levels are available for the most recentyears, including the last quarter of 2020. In orderto obtain estimates of net worth per adult and itscomponents, we update the most recentavailable figures with the help, where available, ofhouse price indexes, share price data and GDPper adult growth (see Table 1-4). Our projectionsare based on estimated relationships betweenthese variables and the corresponding asset/debttotals in preceding years, rather than onproportionality. For countries without informationon house prices and share prices, recent growthof GDP per capita is used to project net worthper adult forwards to end-2020.1.5 Wealth distribution within countriesAn analysis of the global pattern of wealthholdings by individuals requires information onthe distribution of wealth within countries. Directobservations on wealth distribution acrosshouseholds or individuals are available for 37countries. The number of survey years we havevaries across countries. Summary details are
reported in Table 1-5 using a common template,which gives the shares of the top 10%, 5%, and1%, together with other distributional informationin the form of cumulated shares of wealth (i.e.Lorenz curve ordinates).The distributional data have certain fairlystandard features. The unit of analysis isusually a household or family, but is in a fewcases the (adult) individual. Household samplesurveys are employed in almost all countries.The exceptions are the Nordic countries(Denmark, Finland, Norway and Sweden),which use data from tax and other registerscovering the entire population. For all othercountries, except the United States, the wealthshares of the top groups are expected to beunderstated because wealthy households areless likely to respond, and because thefinancial assets that are of greater importanceto the wealthy – e.g. equities and bonds – areespecially likely to be under-reported. And inthose countries using register data there canbe difficulties due to valuation problems, e.g.in connection with pension assets and lifeinsurance. The United States has DistributionalFinancial Accounts (DFA) published quarterlythat combine the triennial Survey of ConsumerFinance (SCF) and Flow of Funds balancesheet data, as well as taking into account thewealth of the “Forbes 400.” The DFA providesshares of the top 1%, top 10% and bottom50%. We interpolate other shares using theSCF survey nearest in date.The summary details reported in Table 1-5 showa great deal of distributional information, butthere are some empty cells. Estimates for theempty cells were generated by a revised versionof the Shorrocks-Wan ungrouping program,which constructs a synthetic sample conformingexactly to any set of Lorenz values (Shorrocksand Wan, 2009). Where countries have somewealth distribution data, Lorenz curves formissing years are estimated by interpolation or byprojection forwards or backwards.For most countries lacking direct wealth distributiondata, the pattern of wealth distribution wasconstructed from information on income distribution,based on the view that wealth inequality is likely tobe highly correlated with income inequality acrossthe countries with missing wealth data. Incomedistribution data was derived from the World IncomeInequality Database, and the ungrouping programwas used to generate all the Lorenz curve valuesrequired for the same template applied to wealthdistribution.For the 37 countries which have data on bothwealth and income distribution, the Lorenz curvesfor wealth are everywhere lower than for income,indicating that wealth is more unequallydistributed than income. We calculate the Ginicoefficient values for both income and wealthand then estimate the missing Lorenz curves forwealth by scaling down the Lorenz curves forincome by the median ratio of income to wealthGinis.To generate regional and global wealth patternsfor each country lacking income distribution data,we assign the average (adult populationweighted) wealth distribution pattern for thecorresponding subregion. This again was done inpreference to simply disregarding the countriesconcerned.1.6 Assembling the global distribution ofwealthTo construct the global distribution of wealth, thelevel of wealth for each country was combinedwith details of its wealth pattern. Specifically, theungrouping program was applied to each countryto generate a set of synthetic sample values andsample weights consistent with the (estimated orimputed) wealth distribution, with the sampleweights representing approximately 10,000adults in the bottom 90% of the distribution,1,000 adults in the top decile, and 100 adults inthe top percentile. The wealth sample valueswere then scaled up to match the mean wealthof the respective country and merged into asingle world dataset comprising between 1.1million and 1.4 million observations for each year.The complete global sample may be processed ina variety of ways, e.g. to obtain the minimumwealth and the wealth share of each percentile inthe global distribution of wealth. The distributionwithin regions may also be calculated, along withthe number of representatives of each country inany given global wealth percentile.1.7 Adjusting the upper wealth tailThe survey data from which most of our wealthdistribution estimates are derived tend to underrepresent the wealthiest groups and to omit ultrahigh net worth individuals. This deficiency doesnot affect our estimates of average wealth levelsaround the world, since these are determined byother methods. It does imply that the shares ofthe top percentile and top decile are likely to erron the low side unless adjustments are made tothe upper tail. We would also not expect togenerate accurate predictions of the number andvalue of holdings of high net worth individuals.We tackle this problem by exploiting well-knownstatistical regularities in the top wealth tail and bymaking use of information on the wealth holdingsof named individuals revealed in the rich list datareported by Forbes magazine and otherpublications. As described in more detail inSection 3, we use the number of billionairesreported by Forbes to fit a Pareto distribution tothe upper tail of 56 countries. The revised top tailGlobal wealth databook 20217
values in the synthetic sample were thenreplaced by the new estimates, and the resultingsample for each country was re-scaled to matchthe mean wealth value. This sequence wasrepeated until the process converged, typicallyafter a few rounds. The overall global weightedsample still contains between 1.1 and 1.3 millionobservations, typically representing about 100,1,000 or 10,000 adults. The adjusted samplecan be used to produce improved estimates ofthe true wealth pattern within countries, regionsand the world. The minimum sample size of 100allows reliable estimates of the number and valueof wealth holdings up to USD 100 million at theregional and global level. Estimates above USD100 million are obtained by projecting the Paretodistribution forward.1.8 Concluding remarksWhile the study of global household wealth is stillat an early stage, enormous progress has beenachieved in recent years. Data on the level ofwealth are improving in quality and are availablefor more countries. New household wealthsurveys have begun in many countries, includinga sizeable number within the Eurozoneorchestrated by the European Central Bank.More needs to be done to improve the qualityand frequency of wealth data, and to make thedata available for a greater number of countries.In the meantime, we will continue to try to fill thegaps in the estimates of wealth level by countryand to improve the estimates of wealthdistribution within countries. In future, somerevisions to our estimates are inevitable.Nevertheless, we are confident that the broadtrends revealed in the Credit Suisse GlobalWealth Report for 2020 will remain substantiallyintact.8
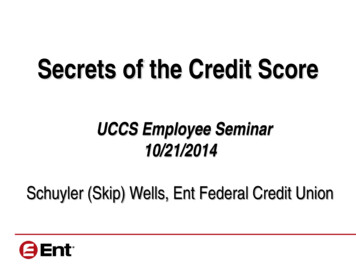
Table 1-1: Coverage of wealth levels dataHigh incomeUpper middle incomeLowermiddle incomeLow incomeCumulative% of worldpopulationCumulative % ofworld wealth34.886.738.387.563.495.5Complete financial and non-financial data for at least one yearNorth AmericaEuropeAsia-PacificCanadaCzech dJapanSouth AfricaFranceKoreaGermanyNew ZealandGreeceSingaporeHungaryTaiwanHousehold dUnited KingdomSurvey dataUruguayIndonesiaIncomplete dataNorth ThailandFinancial lIndiaIcelandNumber of countrieswith wealth partly or fullyestimated by mber of countrieswith wealth imputed bymean value of groupSource: Columns 8-9 computed from Table 2-4 data for 2016Global wealth databook 20219
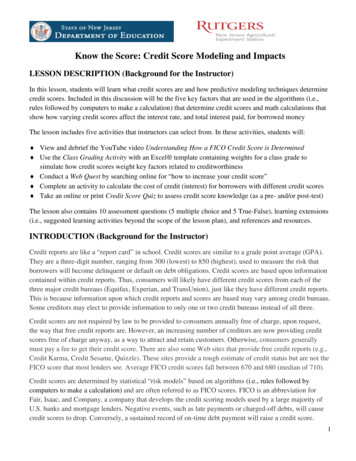
Table 1-2: Household balance sheet and financial balance sheet sourcesCountryFinancial dataNon-financial dataFinancial and nonfinancial data compiled byLink to open-access dataAustraliaAustralian Bureau of StatisticsAustralian Bureau of Statis-Australian Bureau of Statis-www.abs.gov.auticsticsAustriaOECD and Oesterreichische Nationalbank n.a.n.a.stats.oecd.org; www.oenb.atBelgiumOECD and Bank of ts.oecd.orgBulgariaOECD and Bank of Bulgarian.a.n.a.stats.oecd.orgCanadaStatistics CanadaStatistics CanadaStatistics Canadawww.statcan.gc.caChileChile Central Bankn.a.n.a.www.bcentral.clChinaPiketty et al. (2018)Piketty et al. (2018)Piketty et al. bia Central Bankn.a.n.a.www.banrep.gov.coCroatiaEurostat Financial Balance Sheetsn.a.n.a.ec.europa.eu/eurostatCyprusEurostat Financial Balance Sheetsn.a.n.a.ec.europa.eu/eurostatCzech Republic OECD and Czech National Bank (CNB)OECD and CNBAuthorsstats.oecd.org; www.cnb.czDenmarkStatistics DenmarkAuthorsec.europa.eu/eurostat;Eurostat Financial Balance Sheets andStatistics Denmarkwww.statbank.dkEstoniaOECD and Bank of Estonian.a.n.a.stats.oecd.org; www.eestipank.infoFinlandOECD and Statistics FinlandStatistics FinlandAuthors.stats.oecd.org; www.stat.fiFranceOECD and Banque de FranceOECDAuthorsstats.oecd.org; www.banquefrance.frGermanyOECD,Eurostat Financial Balance SheetsOECDAuthorsand BundesbankGreeceEurostat Financial Balance Sheets andtatWIDAuthorsBank of GreeceHungaryEurostat Financial Balance Sheets andMalhotra rsn.a.n.a.Hungarian Central BankIndiastats.oecd.org; nb.hu/ stentId doi:10.7910/DVN/DPQPJYIrelandOECD and Eurostat Financial Balancen.a.n.a.Sheets and Central Bank of Irelandstats.oecd.org; ec.europa.eu/eurostat; orgItalyBank of Italy and Eurostat Financial Bal-Bank of Italy and OECDAuthorswww.bacaditalia.itance SheetsJapanOECD and Bank of JapanOECDAuthorsstats.oecd.org; www.boj.or.jpKazakhstanUnicredit: CEE Households’ Wealth andn.a.n.a.n.a.Debt MonitorKoreaOECD and Bank of KoreaOECDAuthorsstats.oecd.org; www.bok.or.krLatviaEurostat Financial Balance at Financial Balance Sheetsn.a.n.a.ec.europa.eu/eurostatLuxembourgOECD and Banque Central du Luxem-n.a.n.a.stats.oecd.org; www.bcl.lubourgMaltaOECD and Bank of ats.oecd.orgNetherlandsOECD and Statistics NetherlandsOECDAuthorsstats.oecd.orgwww.cbs.nlNew Zealand10New Zealand Reserve BoardOECDAuthorswww.rbnz.govt.nz
Table 1-2: Household balance sheet and financial balance sheet sources, continuedCountryFinancial dataNon-financial dataFinancial and nonfinancial data compiled byLink to open
Global wealth databook 2021 3 4 Section 1 Estimating the pattern of global household wealth 9 Coverage of wealth levels data Table 1-1 10 Table 1-2 Household balance sheet and financial balance sheet sources 12 Table 1-3 Survey sources 14 Changes in asset prices and exchange rates Table 1-4 2020, selected countri