Transcription
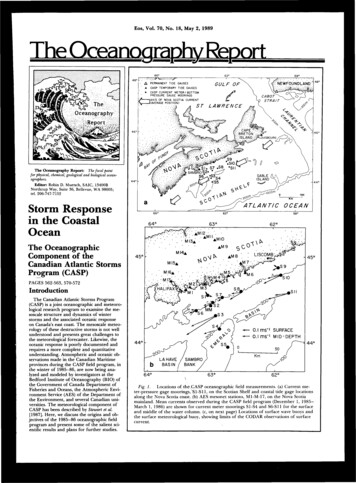
Eos, V o l . 7 0 , N o . 18, M a y 2 , 1989The Oceanography Report66' -V/.- V*i-:-.-:-::vV"PERMANENT TIDE'GAUGESCASP TEMPORARY T I D ECASP CURRENTPRESSUREGAUGESMETER/BOTTOMGAUGEMOORINGS" l A X I S OF NOVA S C O T I ACURRENTJ (AVERAGE P O S I T I O N )srThe Oceanography Report:The focal pointfor physical, chemical, geological and biological oceanographers.Editor: Robin D. Muench, SAIC, 13400BNorthrup Way, Suite 36, Bellevue, WA 98005;tel. 206-747-7152Storm Responsein the CoastalOceanThe OceanographicComponent of theCanadian Atlantic StormsProgram (CASP)PAGES 562-563, 570-572IntroductionT h e Canadian Atlantic Storms Program(CASP) is a joint oceanographic and meteoro logical research program to examine the mesoscale structure and dynamics o f winterstorms and the associated oceanic responseon Canada's east coast. T h e mesoscale meteo rology o f these destructive storms is not wellunderstood and presents great challenges tothe meteorological forecaster. Likewise, theoceanic response is poorly documented andrequires a more complete and quantitativeunderstanding. Atmospheric and oceanic o b servations made in the Canadian Maritimeprovinces during the CASP field program, inthe winter o f 1985-86, are now being ana lyzed and modeled by investigators at theBedford Institute o f Oceanography (BIO) o fthe Government o f Canada Department o fFisheries and Oceans, the Atmospheric Envi ronment Service (AES) o f the Department o fthe Environment, and several Canadian uni versities. T h e meteorological component o fCASP has been described by Stewart et al.[1987]. Here, we discuss the origins and o b jectives o f the 1985—86 oceanographic fieldprogram and present some o f the salient sci entific results and plans for further studies.Fig. 1.Locations o f the\CASP oceanographic field measurements, (a) Current me ter-pressure gage moorings, SI-SI 1, on the Scotian Shelf and coastal tide gage locationsalong the Nova Scotia coast. (B) AES mesonet stations, Ml-M-17, on the Nova Scotiamainland. Mean currents observed during the CASP field program (December 1, 1 9 8 5 March 1, 1986) are shown for current meter moorings S1-S4 and S6-S11 for the surfaceand middle o f the water column, (c, o n next page) Locations o f surface wave buoys andthe surface meteorological buoy, showing limits o f the C O D A R observations o f surfacecurrent.
Eos, V o l . 70, N o . 18, M a y 2, 198963 00'NOVASCOTIAtopography is characterized by a relativelyuniform bottom slope near shore, a midshelftrough about 200 m deep, and a series o fshallow offshore banks separated by subma rine channels. T h e residual circulation on theinner shelf is dominated by the Nova ScotianCurrent (Figure la), which transports waterfrom the Gulf o f St. Lawrence along the coastto the southwest. Historical estimates o f thesurface strength o f the current range from0.06 to 0.12 m s" based on drift bottle re turns [Bumpus and Lauzier, 1965] and the advection o f oil [Forrester, 1971], or on sea sur face temperature anomalies [Sutcliffe et al.,1976]. Geostrophic calculations [Drinkwater etal., 1979] place the axis o f the current 50 to70 km from the coast with a wintertime (De cember-March) alongshore transport o f from0.2 to 0.5 x 10 m s" . Within the current,the water column is least stratified during thelate winter months (February-April), exhibit ing a nearly homogeneous surface layer andweakly stratified deep layer separated by apycnocline at 5 0 - 7 0 m.1663 00"Fig. 1. (cont.) (c) Locations o f surface wave buoys and the surface meteorologicalbuoy, showing limits o f the C O D A R observations o f surface currents. Figure 1 (a) and(b) are on the preceding page.MotivationT h e severe winter weather o f eastern Cana da is due primarily to extratropical cyclonicstorms that develop along the U.S. easternseaboard and travel northeast along the PolarFront. These storms exhibit organization overa broad range o f horizontal length scales.T h e large (synoptic) scale is o f order 2000km and corresponds to the classical model o fcyclonic storms. T h e extremes o f wind andprecipitation, which in many cases have themost destructive impact on society, occur onthe smaller "mesoscale," o f order 2 0 - 2 0 0 km.These phenomena are not resolved by opera tional meteorological networks and are notroutinely forecast. Much remains to belearned before mesoscale storm features andthe associated oceanic response can be accu rately forecast.Principal ObjectivesT h e working hypothesis o f the oceano graphic component o f CASP is that the gen eration o f currents and surface waves bystorms is significantly influenced by the meso scale structure o f the atmospheric forcingfield. T h e oceanographic sampling strategyo f CASP was thus designed to resolve thestructure o f the ocean current, subsurfacepressure, and surface wave fields over hori zontal length and time scales comparable tothe anticipated mesoscale variability in themeteorological forcing field. These relativelyhigh-resolution oceanographic measure ments, coupled with similarly dense meteoro logical observations, are expected to improveour understanding o f how the coastal oceanresponds to mesoscale atmospheric forcing.At the same time the larger-scale wind-drivencirculation can also be examined using thehigh-resolution current measurements andsea level records from a much larger part o fthe coast. T h e CASP surface waves experi ment was designed to examine developmento f the directional wave spectrum in fetch-lim ited situations, interaction between wind seaand swell, and transformation o f wave fieldspropagating into shallow water. Optimal rela tions among wave spectral parameters, partic ularly those that take wave direction into ac count, are also being sought.Field ProgramT h e oceanographic field program was con ducted on the Scotian Shelf (Figure la) be tween December 1985 and April 1986. T h eshelf is about 700 km long, 120-240 kmwide, and has an average depth o f 90 m. Its31Eleven moorings were deployed in CASP tomeasure current, bottom pressure and waterproperties on the inner shelf east o f Halifax(Figure l b ) . Mooring locations were chosen todetect variability on horizontal scales o f 10 to120 km, and the instruments on each moor ing were concentrated around the pycnocline(40-70 m) with at least one instrument in thesurface and bottom layers. Coastal sea levelobservations were made at ten sites regularlyspaced along the Nova Scotia coast, and con ductivity-temperature-depth (CTD) surveyswere conducted on the eastern half o f theScotian Shelf during the mooring deploy ment and recovery cruises (about December1, 1985, and April 1, 1986). T h e surfacewave field east o f Halifax was measured bythree directional wave buoys and six conven tional wave buoys (Datawell W A V E C and 0.9m WAVERIDER, respectively) anchoredshoreward o f the 100 m isobath (within 30km o f shore; see Figure l c ) . Water depth inthe wave array ranged from 22 to 100 m,which is deep water for all fetch-limited off shore-propagating waves. T h e W A V E C buoysand two o f the WAVERIDERs were locatedon a line extending seaward normal to thecoast, with the four remaining W A V E R IDERs from 5 to 20 km on either side o f theline. Within the wave buoy array, high-fre quency ground-wave radar (CODAR) wasused to produce hourly maps o f the surfacecurrent field during selected storms.Special efforts were also made to observethe mesoscale variability o f the surface windfield in the experimental area. A land-basedmesonet, consisting o f seventeen 10-m ane mometer masts in a triangular array (Figurelb), was deployed by AES during JanuaryMarch, 1986 [Stewart et al., 1987]. T h e coastalleg o f the mesonet array provided wind mea surements about every 15 km adjacent to thewave buoy and current meter arrays. Surfacemeteorology buoys were placed on the Sco tian Shelf to record wind, sea surface tem perature, atmospheric pressure, and air tem perature; low-altitude aircraft flights wereused during cold air outbreaks following sev eral storms to map the lateral variations inthe planetary boundary layer near the coast[Smith and MacPherson, 1987].T h e CASP subsurface oceanography andsurface waves programs yielded remarkablycomplete data sets, considering the severe
Eos, V o l . 70, N o . 18, M a y 2, 1989winter weather over the northwest Atlantic.More than 85% o f the subsurface observa tions were successful; in 81 days (January 10March 31, 1986) more than 5000 hourly di rectional wave spectra and 10,000 hourlynondirectional wave spectra were archived.Unfortunately, however, buoy failures limitedthe observations o f marine winds to thosefrom a single meteorological buoy (CoastalClimate Co. Ltd. M I N I M E T ) anchored at the100 m isobath (Figure lb) near the outerW A V E C buoy.Scientific ResultsMean FlowThe CASP mean current measurementsprovide credible estimates o f the barotropictransport at Halifax and suggest that duringthe winter o f 1986 it was 1 to 2 times as largeas the purely baroclinic transport estimatedby Drinkwater et al. [1979]. During CASP,both the mean surface currents (0.10—0.29 ms at depths o f 5 - 1 5 m) and the mid-depthcurrents (0.05-0.20 m s " at 4 0 - 7 0 m; Figurelb) in water deeper than 100 m were consid erably higher than historical estimates. T h emaximum mean surface current was o b served on the 150 m isobath (site S3), roughly46 km from the coast. In addition, monthlymean transports at the Halifax mooring line(S1-S5), based on reasonable assignments o fcross-sectional areas to each current meter,were in the range o f 0.7 to 1.2 x 1 0 m s" ,exceeding the previous geostrophic transportestimates by about a factor o f three. Never theless, the shear o f the winter mean cur rents, calculated between 16 and 110 m at S3,appears to be in geostrophic balance (via thethermal wind relation) with the mean hori zontal density gradient between S2 and S3 at70 m. Moreover, direct comparisons o fmonthly mean alongshore currents with thegeostrophic shear from C T D data indicate astrong barotropic component in the NovaScotian Current with bottom currents o f or der 0.05-0.06 m s " to the southwest be tween the 100 and 150 m isobaths.SSP, a diagnostic variable for the remoteforcing. T h e results indicate that the sub-tidalSSP response is nearly frequency-indepen dent; thus, the complex gains for a singleband (0.125 cpd, Figure 2) are representativeo f the entire low-frequency regime.With few exceptions the dominant localforcing term was found to be the alongshore(T ') component o f the wind stress. From eastto west the amplitude o f the response toincreases as the phase decreases, in opposi tion to the behavior o f a typical low-pressuresystem, which deepens and intensifies as itmoves eastward through the region. Schwing[1989] has shown that this response is similarto that o f Csanady's [1978] "arrested topo graphic wave," suitably modified to includetime dependence (Figure 2, solid curve).Thus the wind-driven response is trapped inthe nearshore region o f the Scotian Shelf and5diffuses outward with increasing (westward)distance along the coast. T h e success o f thisidealized model in explaining the local parto f the wind-driven response signifies that thelow-frequency dynamics o f the nearshore re gime are dominated by friction and that non local forcing contributes significantly to theobserved response.The amplitude o f the nonlocal SSP re sponse (Figure 2) decreases to the west andoffshore while phase indicates westwardpropagation. Least-squares fits o f these quan tities to coastal tide gauge observations sug gest a remotely generated signal with an ex ponential decay scale o f 900 km and phasespeed o f 7 m s " at periods greater than 5days. At shorter periods, the phase speed was1 2 - 1 7 m s . For idealized Scotian Shelf to pography, these values are consistent withfrictional C T W theory. Thus the CASP data1- 1COASTS4S5- 1163LEAST SQUARES FIT1MODEL RESULT1Low-frequency MotionsThe oceanic response to synoptic-scale at mospheric forcing during CASP occurredprimarily at periods o f 2 - 1 0 days, consistentwith previous observations from the ScotianShelf [Smith et al, 1978] and many other midlatitude regions. Subsurface pressure(SSP(mb) measured bottom pressure at mospheric pressure) was highly coherentalong the Nova Scotian coast and throughoutthe CASP mooring array at all frequenciesand was well-correlated with alongshore windstress [Schwing, 1989]. In contrast, the currentfield had a much smaller spatial coherencescale and was poorly correlated with direct at mospheric forcing at most locations.SSP appears to respond directly to the localwind and to nonlocal forcing that causes en ergy to propagate westward along the shelf ina manner consistent with coastal-trappedwave (CTW) theory [Gill and Schumann,1974]. Frequency-dependent linear regres sion [Jenkins and Watts, 1968] was applied torelate the SSP observations statistically to thecross- (r*) and alongshore (7 ) wind stress es timates from Sable Island and to Louisbourg-200-800-600-400ALONGSHORE DISTANCE ( k m ) FROM N.SYDNEYCROSS-SHORE DISTANCE (km)Fig. 2Phase and amplitude o f the 0.125 cpd subsurface pressure (SSP) response toSable Island alongshore wind stress,and to Louisbourg SSP, taken as a proxy for re mote forcing. Variations with respect to (a) alongshore distance and (b) cross-shore dis tance are shown. Error bars represent 95% confidence limits when the response differssignificantly from zero at that confidence level. Solid curves represent the forced re sponse o f a simple time-dependent model with linear friction [Schwing, 1989]. Dashedlines denote least-squares fits to phase and amplitude o f the nonlocal response.
Eos, V o l . 70, N o . 18, M a y 2, 1989provide the first direct evidence for coastaltrapped waves o n the Scotian Shelf.T h e regression model containing localwind stress and nonlocal forcing accounts forover 90% o f the SSP variance at all locationsand frequencies. T h e relative contributions o fthe forcing terms (Figure 3) indicate that atSambro (near Halifax) local and nonlocalforcing are o f nearly equal importance at pe riods greater than 2 days, while nonlocal ef fects are enhanced at snorter periods. T h esecondary role o f cross-shelf stress is also evi dent. T h e relative importance o f local along shore stress with respect to nonlocal forcingincreases from east to west along the coast asthe local response grows and the remotelyforced signal decays.Unlike the pressure field analysis, the inter pretation o f the multiple regression o f theCASP currents o n atmospheric and remoteforcing is not nearly as clear. Nonlocal contri butions to the alongshore current were sub stantial, particularly at periods o f 5 days andgreater. This signal propagated and decayedto the west at scales similar to those o f theSSP field. At shorter periods, however, theamplitude o f the velocity response to nonlocalforcing was substantially smaller. Further more the response to local wind forcing wasgenerally small at all frequencies and variedgreatly over scales o f only 20—50 km. WhileT ' was the dominant forcing for SSP, r* wasshown to be an important contributor toalongshore velocity in many instances. Never theless, there is some measure o f consistencybetween SSP and current results in that esti mates o f the cross-shelf pressure gradientfrom the average current gain at the S1-S4moorings are comparable to those inferredfrom the differences between the SSP re sponses at S5 and the coast. This indicatesthat the integrated current response toandnonlocal forcing is nearly geostrophic. In ad dition, statistically significant velocity respons es at individual moorings are relatively inde pendent o f depth; that is, the current re sponse seems to be barotropic. Nevertheless,the multiple regression model that explainsSSP variability so well accounts for only 5 0 80% o f the alongshore current variance. T h epoor correlation o f the velocity field andlarge variability o f the response within themooring array suggest that the dynamics thatcontrol low-frequency currents are muchmore complex than those for pressure.3Inertial M o t i o n sSpectral analysis o f the CASP data revealsthat the dominant current variability in wa ters deeper than 100 m is found in the iner tial frequency band. However, the structure,strength and timing o f the intermittent burstso f inertial wave energy are governed in acomplex manner by the character o f the me soscale wind forcing, the background densityand mean velocity fields, and the nearshoregeometry (coastline shape and bottom topog raphy). T h e intermittency o f inertial wave en ergy is most clearly revealed by complex de modulation o f the current velocity c o m p o nents at the inertial frequency (Figure 4c, d).Peak amplitudes o f the cross-shore c o m p o nent reach 0.20 m s in the surface layer onthe 150 m isobath and are only slightly small er at depth. "Coastal inhibition" o f the iner tial waves [Kundu, 1986] is also evident bycomparing the very weak energy levels o n the60-m isobath (SI(12m), Figure 4c) with thosefurther offshore.1.050.10.51.0u(cpd)Fig. 3Distribution o f variance in Sambro SSP due to Sable Island wind stress com ponents (T*, T ) and nonlocal forcing ( S S P ) . Each level o f shading represents the vari ance accounted for by the indicated independent variable in the multiple regressionmodel. Area labelled e at bottom denotes residual error.7NNL0.6(no.4 Uw0.20.0-0.2 -0.4i1iiS-0.6E0. 1J.-i6W0.4 Oin0.20.0-0.2 -0.4W- --.1.1.11 . .0355.010.030.0(1985)DAYFig. 4Time series o f Shearwater wind stress and the amplitude o f the inertial com plex demodulate o f the cross-shore current component, (a) North-south wind stresscomponent, (b) east-west wind stress component, (c) inertial current amplitude in thesurface layer at moorings SI-S3 and SI 1, and (d) inertial current amplitude at the fourdepths at mooring S3. Sea surface wind stress is estimated according to Smith and Banke[1975]. T h e arrows mark the IOP 14 storm (0600Z, March 7-0600Z, March 10, 1986).
Eos, V o l . 7 0 , N o . 18, M a y 2, 198980 70 60 50180 ms70 60 50 contrast to along-frontal scales in excess o f500 km (see Figure 5a).T o investigate the inertial response o f thecurrent field during IOP 14, the tidal-residu al current records were band-pass filtered atthe inertial frequency. T h e complex correla tions [Kundu, 1986] between the inertial oscil lations at the near-surface instrument on theS3 mooring (S3(16 m)) and all others in thefield were then evaluated over the 3-day in terval commencing at 0600Z on March 7.The magnitude o f this quantity gives aweighted average correlation o f two vectortime series, while the phase gives the averagecounterclockwise angle (looking downward)o f the second vector with respect to the first.The phase o f the correlation on the Halifaxmooring line (Figure 6a) exhibits rapid clock wise turning with depth in the pycnocline(50-70 m deep) consistent with upward phaseand downward energy propagation o f inertialwaves. Near the shore, however, the sharpdecline o f the correlation indicates coastal in hibition o f the waves, which appear to propa gate onshore in the surface layer.ESTIMATEDPHASE VELOCITIESLOW PRESSURE SYSTEM:AVERAGE FROM SURFACEPRESSURE ARRAY ANDSYNOPTIC CHARTSFRONTAL MOVEMENTFROM AES MESONET WINDSINERTIAL CURRENTSIN THE SURFACE LAYERBAROCLINIC INERTIALOSCILLATIONS270-9.0 180'Fig. 5(a) Synoptic weather charts showing movement o f the CASP IOP 14 stormacross the region during 0600-1800Z, March 7, 1986. Selected surface wind measure ments are shown, (b) Estimated phase velocities during CASP IOP 14, including motiono f the low pressure center from AES surface pressure measurements and synopticcharts, frontal velocity from mesonet winds, two estimates (see text) o f propagation ve locity o f clockwise current oscillations in the surface layer, and estimate o f baroclinicphase velocity on the Liscomb mooring line (S9-S11).Examination o f the sea surface wind stresstime series (Figure 4a, b) reveals that most o fthe peaks in inertial wave energy are associat ed with strong wind events, but that the tim ing and amplitudes o f the responses are notvery consistent. In an effort to understandsome o f the dynamics o f inertial wave genera tion in this nearshore environment, the re sponse to storm forcing during CASP inten sive observation period (IOP) 14 (0600Z,March 7-0600Z, March 10, 1986) has beenstudied in some detail. O n March 7 the lowpressure center associated with IOP 14tracked northeast across Nova Scotia and intothe Gulf o f St. Lawrence (Figure 5a). Be tween 0000Z and 1200Z, the low underwentA plan view o f the vertically averaged cor relation in the surface layer (depth 40 m;Figure 6b) suggests that the contour lines o fboth magnitude and phase o f the correlationare roughly parallel to the coast. However,closer inspection reveals that the inertialphase varies much more slowly o n the Liscomb mooring line (S9-S11) than along theHalifax line, implying that the component o fphase speed along the Liscomb line is about 5times greater. From the Liscomb line plus100-m isobath stations, the estimated propa gation was directed onshore at a rate o f 8.1 0.9 m s , comparable to the measured atmo spheric frontal velocity (Figure 5b). This o b servation is consistent with Kundu and Thom son's [1985] description o f the "inertial wake"behind an idealized 2-D front moving at aspeed U such that Ci U Co, where Cq andCi are characteristic speeds o f the barotropicand first baroclinic modes. O n the otherhand, the propagation speed estimate on theHalifax line, 1.6 0.4 m s \ is less certainand is inconsistent with such a response.The inertial response o f temperature andsalinity fields during IOP 14 appears to be inphase throughout the pycnocline (50—70 m),but the strongest oscillations at S3, for in stance, are delayed by roughly 12 hours afterthe passage o f the front. With internal wavespeeds o f order 1 m s \ this suggests that the- 1"explosive deepening" (the central pressurefalling faster than 1 mb h r ) , and Nova Sco tia felt the full fury o f the storm when it ar rived at midday. T h e scattered synoptic windvectors and local time series measurementsfrom the AES mesonet indicate a rapid clock wise veering o f the wind behind the warmfront, which was oriented roughly east-westas the system passed through the region. T h efrontal velocity was estimated to be 10 m s "to the north by using a plane wave model todescribe the movement o f the sharp directionchange through the AES mesonet [Smith,1989]. Since most o f that change at an indi vidual station occurred in 20 minutes, thewidth o f the front was o f order 15 km, in11
Eos, V o l . 70, N o . 18, M a y 2, 1989dominant baroclinic response was caused bypassage o f an internal wave generated at thecoast, but, as with the current oscillations, cal culations o f the phase speed using 70 m tem peratures, salinities, or densities gave ambigu ous results. O n the Liscomb line, the baro clinic waves propagate offshore at anestimated rate o f 1.8 0.1 m s (Figure 5b),as expected. However, no significant esti mates o f the baroclinic phase velocity couldbe obtained for the Halifax line, where thephase relationships were much more com plex.DISTANCE FROM SHORE (kilometres)- 1Gross-shore Variations in the Nearsurface W i n d FieldT o interpret and model the mesoscale vari ations in the oceanic response to wind forc ing, it is essential to know the strength anddistribution o f the wind at the sea surface o nsimilar scales. When the wind blows fromland to sea, the flow in the planetary bound ary layer adjusts, over some length scale,from its terrestrial equilibrium to a new ma rine equilibrium profile that is characterizedby lower roughness and generally by a differ ent buoyancy flux at the sea surface. T o in vestigate cross-shore variations in the surfacewind field near the coast o f Nova Scotia, theTwin Otter atmospheric research aircraft o fthe National Aeronautical Establishment o fCanada flew airborne surveys o f the plane tary boundary layer, primarily at altitudes o f5 0 - 7 0 m, under conditions o f cold offshoreadvection [Smith and MacPherson, 1987]. Inaddition to other meteorological variables,the Twin Otter measures three orthogonalcomponents o f gust velocity, air temperature,and wind speed and direction. T h e windspeed calculation is based on a ground speedmeasurement by a Doppler radar system thatis biased over water by the "effective" motiono f the sea surface (itself a complicated func tion o f the phase and orbital speeds o f thesurface waves). In CASP, this bias was ac counted for by determining the differencebetween the actual displacement o f the air craft over the water (from navigation) andthat obtained from the integrated Dopplerspeed.After correcting for the Doppler biases, in termediate averages o f wind speed and direc tion and the three components o f atmospher ic turbulence were computed at 1- to 2-minute intervals along each flight path(horizontal resolution o f roughly 5 km).Then, assuming a straight coastline, the off shore distances along the flight path wereconverted to displacements from the coastalong the fetch. Since atmospheric conditionswere comparable on four o f the flights, thesedata were treated as an ensemble for estimat ing cross-shore variations versus fetch. Inspite o f high spatial variability on individualtransects, averaging o f all the 50-m-altitudedata in 10-km overlapping bins and normaliz ing by marine equilibrium values (i.e., aver ages for fetches exceeding 40 km) producedreasonably smooth horizontal gradients o fmean wind speed and turbulence (Figure 7ac). As a crude measure o f the cross-shorevariations, the average transects were fit withexponential functions o f fetch that yieldedlength scales o f 9.3, 3.4 and 3.8 km for meanwind speed, turbulent kinetic energy and ver tical gust velocity, respectively. These scalesare o f the same order as the cross-shore di \L 63 00"i/ 62 00'Fig. 6Contour plot o f magnitude and phase o f the squared complex correlation o fcurrents measured during CASP IOP 14. (a) Vertical section along the Halifax mooringline (S1-S4), and (b) plan view o f the average values in the surface mixed layer (depth 40 m).mensions o f the CASP mooring and surfacewave arrays, and thus have important impli cations for studies o f such processes as fetchlimited wave growth.The vertical heat and downwind momen tum fluxes were also computed from the 1and 2-minute covariances o f high-pass fil tered vertical velocity with temperature anddownwind gust velocity. T h e 50-m momen tum fluxes showed a consistent decrease withoffshore distance, whereas the heat fluxes in creased or decreased depending on condi tions over the land. T h e downwind momen tum flux was found to be nearly constant upto an altitude o f 300 m, but the heat flux di minished with height above 70 m. T o esti mate the importance o f free convection in themarine boundary layer at z 50 m, the aver age stability parameter, z/L (where L is theMonin-Obukhov length), was computed forthe over-water part o f each cross-shore leg.Values in the range - 1 . 2 - z / L *s 0.3 indi cate that buoyancy effects, though weak, arenot negligible in the CASP 50-m aircraft data.Surface W a v e StudiesTime series o f wind speed, wind and wavedirection, and significant wave height (Figure8) give an idea o f the conditions encounteredduring the CASP field program. Note the 6m maximum in wave height near day 30, thesharp rise times and gentle decay times o f the
Eos, V o l . 70, N o . 18, M a y 2, 19895 0 m MEAN WIND SPEED4 b.50m VERTICALGUST V E LJULIAN DAY (1986)C-50m ANCE ALONG F E T C H ( k mFig. 7 Ensemble average cross-shoredistributions o f 50-m ratios o f local to off shore values o f (a) mean wind speed, (b)standard deviation o f vertical gust veloci ty, and (c) turbulent kinetic energy. Over lapping 10-km average data (solidsquares) have been fitted by least squaresto an exponential curve (solid). FromSmith and MacPherson, [1987].wave height, and the predominance o f south erly swell (wind from the north, waves fromthe south).T h e Joint North Sea Wave Project (JONSWAP) study [Hasselmann et al, 1973] and oth er similar experiments provide ample evi dence that the growth o f fetch-limited wavespectra is governed by simple power laws. InCASP, the growth o f surface gravity waves asa function o f offshore wind fetch was exam ined by classifying the wave spectra at eachwave buoy by wind direction, each directionrepresenting a different effective fetch fromthe coast to the buoy [Dobson et al., 1989]. De termination o f the correct growth law, howev er, requires an accurate accounting o f the off shore variation o f wind velocity along theeffective fetch (see Figure 7). T h e strong de pendence o f the spectral energy level o nwind speed means that the particular defini tion chosen for the wind speed is crucial, andcomparisons o f the CASP results with paststudies indicate that many o f the discrepan cies among them may be attributed to differ ences in the wind definitions used. As a first5560706575JULIAN DAY (1986)Fig. 8T i m e series o f wave height H , wind speed U i , wave direction 0(f ) at maxi mum o f the wave spectrum, and wind direction 0 observed in CASP (January 15March 15, 1986); after Dobson et al. [1989]. T h e wind velocity shown is a shoreward ex trapolation o f the wind at the M I N I M E T buoy, using the Taylor and Lee [1984] guide lines, except for the period January 15—30, when it is a seaward extrapolation o f thewind at AES mesonet site M3 (see Figure l b ) . T h e wave observations are from the inter mediate-depth W A V E C buoy (depth o f 50 m; see Figure l c ) .s0m1Oapproximation, a linear spatial average wasu
Program (CASP) PAGES 562-563, 570-572 Introduction The Canadian Atlantic Storms Program (CASP) is a joint oceanographic and meteoro logical research program to examine the me-soscale structure and dynamics of winter storms and the associated ocea