Transcription
White paperCisco publicCisco Visual Networking Index:Global Mobile Data TrafficForecast Update, 2017–2022February, 2019The Cisco Visual Networking Index (VNI) Global Mobile DataTraffic Forecast Update is part of the comprehensive Cisco VNIForecast, an ongoing initiative to track and forecast the impactof visual networking applications on global networks. This reportpresents some of the major global mobile data traffic projectionsand growth trends.Executive SummaryThe Mobile Network in 2017Global mobile data traffic grew 71 percent in 2017. Global mobile data traffic reached 11.5 exabytes permonth at the end of 2017, up from 6.7 exabytes per month at the end of 2016. (One exabyte is equivalent to onebillion gigabytes, and one thousand petabytes.)Mobile data traffic has grown 17-fold over the past 5 years. Mobile networks carried 686 petabytes per monthin 2012.Fourth-generation (4G) traffic accounted for 72% of mobile traffic in 2017. Although 4G connectionsrepresented only 35 percent of mobile connections in 2017, they already accounted for 72 percent of mobile datatraffic, while 3G connections represented 30 percent of mobile connections and 21 percent of the traffic. In 2017,a 4G connection generated nearly three times more traffic on average than a 3G connection.Mobile offload exceeded cellular traffic by a significant margin in 2017. Fifty-four percent of total mobile datatraffic was offloaded onto the fixed network through Wi-Fi or femtocell in 2017. In total, 13.4 exabytes of mobiledata traffic were offloaded onto the fixed network each month.Nearly Six hundred and fifty million mobile devices and connections were added in 2017. Global mobiledevices and connections in 2017 grew to 8.6 billion, up from 7.9 billion in 2016.Globally, smart devices represented 53 percent of the total mobile devices and connections in 2017; theyaccounted for 92 percent of the mobile data traffic. (For the purposes of this study, “smart devices” refers tomobile connections that have advanced multimedia/computing capabilities with a minimum of 3G connectivity.) In2017, on an average, a smart device generated 10 times more traffic than a nonsmart device. 2019 Cisco and/or its affiliates. All rights reserved.
White paperCisco publicContentsExecutive Summary2017 Year in ReviewGlobal Mobile Data Traffic,2017 to 2022Top Global Mobile NetworkingTrendsTrend 1: Evolving towardSmarter Mobile DevicesTrend 2: Defining CellNetwork Advances—2G, 3G,4G and 5G ProjectionsMobile network (cellular) connection speeds grew 1.3-fold in 2017.Globally, the average mobile network downstream speed in 2017 was 8.7Megabits per second (Mbps), up from 6.8 Mbps in 2016.Mobile video traffic accounted for 59 percent of total mobile data trafficin 2017. Mobile video traffic now accounts for more than half of all mobiledata traffic.The top 1 percent of mobile data subscribers generated 6 percent ofmobile data traffic, down from 52 percent in 2010. The top 20 percent ofmobile users generated 62 percent of mobile data traffic.Average smartphone usage grew 49 percent in 2017. The average amountof traffic per smartphone in 2017 was 2.3 GB per month, up from 1.6 GB permonth in 2016.Trend 3: Measuring Mobile IoTAdoption—M2M and EmergingWearablesSmartphones (including phablets) represented only 51 percent of totalmobile devices and connections in 2017, but represented 88 percentof total mobile traffic. In 2017, the typical smartphone generated 47 timesmore mobile data traffic (2.3 GB per month) than the typical basic-featurecell phone (which generated only 50 MB per month of mobile data traffic).Trend 4: Analyzing theExpanding Role and Coverageof Wi-FiGlobally, there were 526 million wearable devices (a sub-segment ofthe machine-to-machine [M2M] category) in 2017. Of these, 19 millionwearables had embedded cellular connections.Trend 5: Identifying NewMobile Applications andRequirementsPer-user iOS mobile devices (smartphones and tablets) data usagesurpassed that of Android mobile devices data usage. By the endof August 2018, average iOS consumption exceeded average Androidconsumption in North America, where iOS usage was 9.1 GB per month andAndroid was 8.6 GB per month.Trend 6: ComparingMobile Network SpeedImprovementsTrend 7: Reviewing TieredPricing—Unlimited Data andShared PlansConclusionFor More InformationAppendix A: The Cisco VNIGlobal Mobile Data TrafficForecastAppendix B: Global 4GNetworks and ConnectionsAppendix C: IPv6-CapableDevices, 2017–2022 2019 Cisco and/or its affiliates. All rights reserved.In 2017, 47 percent of mobile devices were potentially IPv6-capable.This estimate is based on network connection speed and OS capability.In 2017, the number of mobile-connected tablets increased 14% to 176million, and the number of mobile-connected PCs increased 1% to 135million. In 2017, the average mobile data traffic per PC/Tablet was 3.3 GBper month, compared to 2.3 GB per month per smartphone.Average nonsmartphone usage increased to 50 MB per month in 2017,compared to 34 MB per month in 2016. Basic handsets still made up 40percent of handsets on the network.
White paperCisco publicThe Mobile Network Through 2022Mobile data traffic will reach the following milestones within the next 5 years: Monthly global mobile data traffic will be 77 exabytes by 2022, and annual traffic will reach almost one zettabyte. Mobile will represent 20 percent of total IP traffic by 2022. The number of mobile-connected devices per capita will reach 1.5 by 2022. The average global smartphone connection speed will surpass 40 Mbps by 2022. Smartphones will surpass 90 percent of mobile data traffic by 2022. 4G connections will have the highest share (54 percent) of total mobile connections by 2022. 4G traffic will be more than seven-tenths (71 percent) of the total mobile traffic by 2022. 5G traffic will be more than ten percent (12 percent) of the total mobile traffic by 2022. Nearly three-fifths of traffic (59 percent) will be offloaded from cellular networks (on to Wi-Fi) by 2022. Nearly four-fifths (79 percent) of the world’s mobile data traffic will be video by 2022.Global mobile data traffic will increase seven-fold between 2017 and 2022. Mobile data traffic will grow at aCompound Annual Growth Rate (CAGR) of 46 percent from 2017 to 2022, reaching 77.5 exabytes per month by 2022.By 2022 there will be 1.5 mobile devices per capita. There will be 12.3 billion mobile-connected devices by 2022,including M2M modules—exceeding the world’s projected population at that time (8 billion) by one and a half times.Mobile network connection speeds will increase more than three-fold by 2022. The average mobile networkconnection speed (8.7 Mbps in 2017) will reach 28.5 Megabits per second (Mbps) by 2022.By 2022, 4G will be 54 percent of connections, but 71 percent of total traffic. By 2022, a 4G connection willgenerate nearly twice as much traffic on average as a 3G connection.By 2022, 5G will be 3.4 percent of connections but 11.8 percent of total traffic. By 2022, a 5G connection willgenerate 2.6 times more traffic than the average 4G connection.By 2022, nearly three-quarters of all devices connected to the mobile network will be “smart” devices. Globally,72.8 percent of mobile devices will be smart devices by 2022, up from 52.8 percent in 2017. The vast majority ofmobile data traffic (99 percent) will originate from these smart devices by 2022, up from 92 percent in 2017.By 2022, 76 percent of all global mobile devices could potentially be capable of connecting to an IPv6 mobilenetwork. There will be 9.4 billion IPv6-capable devices by 2022.Nearly four-fifths of the world’s mobile data traffic will be video by 2022. Mobile video will increase 9-foldbetween 2017 and 2022, accounting for 79 percent of total mobile data traffic by the end of the forecast period.By 2022, mobile-connected tablets and PCs will generate 6.8 GB of traffic per month on average, a doublingover the 2017 average of 3.3 GB per month. Aggregate traffic associated with PCs and tablets will be three and ahalf times greater than it is today, with a CAGR of 28 percent.The average smartphone will generate 11 GB of traffic per month by 2022, more than a four and a half-foldincrease over the 2017 average of 2 GB per month. By 2022, aggregate smartphone traffic will be seven timesgreater than it is today, with a CAGR of 48 percent.By 2017, 59 percent of all traffic from mobile-connected devices (111 exabytes) will be offloaded to the fixednetwork by means of Wi-Fi devices and femtocells each month. Of all IP traffic (fixed and mobile) in 2022, 51%will be Wi-Fi, 29% will be wired, and 20% will be mobile. 2019 Cisco and/or its affiliates. All rights reserved.
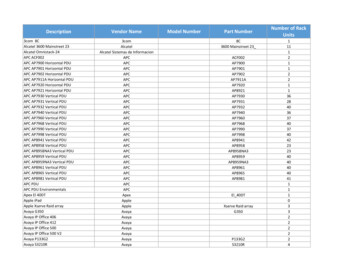
White paperCisco publicThe Middle East and Africa will have the strongest mobile data traffic growth of any region with a 56 percentCAGR. This region will be followed by Asia Pacific at 49 percent and Latin America at 43 percent.China’s mobile traffic surpassed that of the United States by the end of 2017. China’s mobile traffic reachednearly 2 exabytes per month by the end of 2017, and mobile traffic in the United States was 1.2 exabytes per month.Appendix A summarizes the details and methodology of the VNI Mobile Forecast.2017 Year in ReviewGlobal mobile data traffic grew an estimated 71 percent Year over Year (YoY) in 2017. Growth rates varied widely byregion, with Middle East and Africa having the highest growth rate (92 percent) followed by Asia Pacific (86 percent),Latin America (68 percent), and Central and Eastern Europe (66 percent). Western Europe grew at an estimated 60percent, and North America trailed Western Europe at 23 percent growth in 2017 (refer to Figure 1). At the countrylevel, China, France, and South Africa led global growth at 178, 149, and 98 percent, respectively. China along withIndonesia and India was among the top three countries that topped traffic growth in 2016, though in 2017 China’straffic growth accelerated.Figure 1. Mobile Data Traffic Growth in 201792%Middle East and Africa86%Asia PacificLatin America68%Central and Eastern Europe66%Western Europe60%North America23%0%Source: Cisco VNI Mobile, 2019 2019 Cisco and/or its affiliates. All rights reserved.20%40%60%80%100%
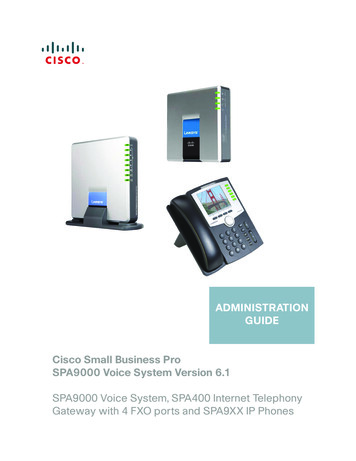
White paperCisco publicGlobal Mobile Data Traffic, 2017 to 2022Overall mobile data traffic is expected to grow to 77 exabytes per month by 2022, a seven-fold increase over 2017.Mobile data traffic will grow at a CAGR of 46 percent from 2017 to 2022 (Figure 2).Figure 2. Cisco Forecasts 77 Exabytes per Month of Mobile Data Traffic by 202246% CAGR2017-202290778070576050Exabytes 40per : Cisco VNI Mobile, 2019Asia Pacific will account for 56 percent of global mobile traffic by 2022, the largest share of traffic by any region bya substantial margin, as shown in Figure 3. North America, once the region with largest traffic share, will have onlythe fourth-largest share by 2022, having been surpassed by Central and Eastern Europe and Middle East and Africa.Middle East and Africa will experience the highest CAGR of 56 percent, increasing 9-fold over the forecast period.Asia Pacific will have the second-highest CAGR of 49 percent, increasing 7-fold over the forecast period (Figure 3).Figure 3. Global Mobile Data Traffic Forecast by Region46% tes 40per Month3055.7%20100201720182019Latin America (LATAM) (43% CAGR)Western Europe (WE) (38% CAGR)North America (NA) (36% CAGR)Source: Cisco VNI Mobile, 2019 2019 Cisco and/or its affiliates. All rights reserved.202020212022Central and Eastern Europe (CEE) (41% CAGR)Middle East and Africa (MEA) (56% CAGR)Asia Pacific (APAC) (49% CAGR)
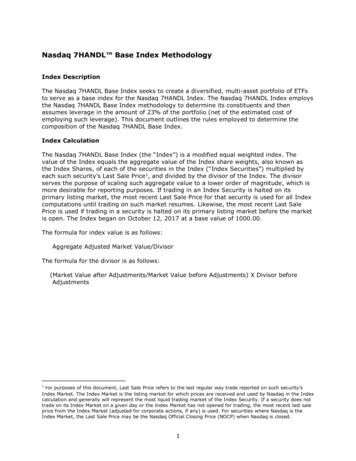
White paperCisco publicTop Global Mobile Networking TrendsThe sections that follow identify 7 major trends contributing to the growth of mobile data traffic.1. Evolving toward Smarter Mobile Devices2. Defining Cell Network Advances—2G, 3G, 4G and 5G Projections3. Measuring Mobile IoT Adoption—M2M and Emerging Wearables4. Analyzing the Expanding Role and Coverage of Wi-Fi5. Identifying New Mobile Applications and Requirements6. Comparing Mobile Network Speed Improvements7. Reviewing Tiered Pricing—Unlimited Data and Shared PlansTrend 1: Evolving toward Smarter Mobile DevicesThe ever changing mix and growth of wireless devices that are accessing mobile networks worldwide is one of theprimary contributors to global mobile traffic growth. Each year several new devices in different form factors andincreased capabilities and intelligence are introduced in the market. In the last couple of years, we have seen a riseof phablets and more recently we have seen many new M2M connections coming into the mix. More than 600 million(648 million) mobile devices and connections were added in 2017. In 2017, global mobile devices and connectionsgrew to 8.6 billion, up from 7.9 billion in 2016. Globally, mobile devices and connections will grow to 12.3 billion by2022 at a CAGR of 7.5 percent (Figure 4).By 2022, there will be 8.4 billion handheld or personal mobile-ready devices and 3.9 billion M2M connections(e.g., GPS systems in cars, asset tracking systems in shipping and manufacturing sectors, or medical applicationsmaking patient records and health status more readily available, et al.). Regionally, North America and Western Europeare going to have the fastest growth in mobile devices and connections with 16 percent and 12 percent CAGR from2017 to 2022, respectively.Figure 4. Global Mobile Devices and Connections Growth7% CAGR2017-20221412108Billions ofDevices6420201720182019Smartphones (42%, 44%)Phablets (8%, 10%)Tablets (2%, 3%)Other Portable Devices (0.1%, 0.0%)Note: Figures in parentheses refer to 2017, 2022 device share.Source: Cisco VNI Mobile, 2019. 2019 Cisco and/or its affiliates. All rights reserved.202020212022M2M (11%, 31 %)Nonsmartphones (34%, 10%)PCs (2%, 1%)
White paperCisco publicWe see a rapid decline in the share of nonsmartphones from 34 percent in 2017 (3.0 billion) to 10 percent by 2022(1.2 billion). Another significant trend is the growth of smartphones (including phablets) from 50 percent share of totaldevices and connections in 2017 to over 50 percent (54 percent) by 2022. The most noticeable growth is going tooccur in M2M connections, followed by tablets. M2M mobile connections will reach nearly a third (31 percent) of totaldevices and connections by 2022. The M2M category is going to grow at 32 percent CAGR from 2017 to 2022, andtablets are going to grow at 14 percent CAGR during the same period. Along with the overall growth in the number ofmobile devices and connections, there is clearly a visible shift in the device mix. This year, we see a further slowdownin the growth of tablets as well as laptops and a more rapid decline in nonsmartphones and other portables.From a traffic perspective, smartphones and phablets will continue to dominate mobile traffic (93 percent) while theM2M category will continue to gain share by 2022 (refer to Figure 5).Figure 5. Global Mobile Traffic Growth by Device Type46% CAGR2017-202290807060Exabytesper Month50403020100201720182019Smartphones inc. Phablets (88%, 93%)Nonsmartphones (1.3%, 0.3%)PCs (4.3%, 1.6%)202020212022M2M (1.8%, 2.2%)Tablets (4.6%, 2.9%)Other Portable Devices (0.0%, 0.0%)Note: Figures in parentheses refer to 2017, 2022 device share.Source: Cisco VNI Mobile, 2019.Throughout the forecast period, we see that the device mix is getting smarter with an increasing number of deviceswith higher computing resources, and network connection capabilities that create a growing demand for morecapable and intelligent networks. We define smart devices and connections as those having advanced computingand multimedia capabilities with a minimum of 3G connectivity. The share of smart devices and connections as apercentage of the total will increase from 53 percent in 2017 to nearly three-fourths, at 73 percent, by 2022, growingtwo-fold during the forecast period (Figure 6). 2019 Cisco and/or its affiliates. All rights reserved.
White paperCisco publicFigure 6. Global Growth of Smart Mobile Devices and Connections7% CAGR2017-2022141227%10Billions rt Devices and ConnectionsNon-smart Devices and ConnectionsNote: Percentages refer to device and connections share.Source: Cisco VNI Mobile, 2019Low-Power Wide-Area (LPWA) connections are included in our analysis. This wireless network connectivity is meantspecifically for M2M modules that require low bandwidth and wide geographic coverage. Because these moduleshave very low bandwidth requirements and tolerate high latencies, we do not include them in the smart devicesand connections category. For some regions, such as North America where the growth of LPWA is expected tobe high, their inclusion in the mix would skew the percentage for smart devices and connections, so for regionalcomparison we have taken them out of the mix. Figure 7 provides a comparable global smart-to-nonsmart devicesand connections split, excluding LPWA.Figure 7. Global Growth of Smart Mobile Devices and Connections (Excluding LPWA)5% CAGR2017-20221215%108Billions ofDevices646%85%42054%201720182019Smart Devices and ConnectionsNon-smart Devices and ConnectionsNote: Percentages refer to device and connections share.Source: Cisco VNI Mobile, 2019 2019 Cisco and/or its affiliates. All rights reserved.202020212022
White paperCisco publicWhen we exclude LPWA M2M connections from the mix, the global percentage share of smart devices andconnections is higher, at 85 percent by 2022.Although this device mix conversion is a global phenomenon, some regions are ahead. By the end of 2022, NorthAmerica will have 99 percent of its installed base converted to smart devices and connections, followed by WesternEurope and Central and Eastern Europe with 95 percent smart devices and connections (Table 1).Table 1. Regional Share of Smart Devices and Connections (Percent of the Regional Total)Region20172022North America87%99%Western Europe73%95%Central and Eastern Europe63%93%Asia Pacific54%82%Latin America53%86%Middle East and Africa27%77%Source: Cisco VNI Mobile, 2019Figure 8 shows the impact of the growth of mobile smart devices and connections on global traffic. Globally, smarttraffic is going to grow from 92 percent of the total global mobile traffic to 99 percent by 2022. This percentage issignificantly higher than the ratio of smart devices and connections (73 percent by 2022), because on average asmart device generates much higher traffic than a nonsmart device. Globally, in 2017, a smart device generated 10times more traffic than a nonsmart device, and by 2022 a smart device will generate 15 times more traffic.Figure 8. Effect of Smart Mobile Devices and Connections Growth on Traffic46% CAGR2017-2022901%807060Exabytesper Month504099%30201008%92%20172018Smart TrafficNon-smart TrafficNote: Percentages refer to traffic share.Source: Cisco VNI Mobile, 2019 2019 Cisco and/or its affiliates. All rights reserved.2019202020212022
White paperCisco publicIPv6With the exponential proliferation of multiple smart devices becoming a reality, the need for each device having itsown specific, unique address that it uses to communicate with other devices and the Internet and to define its locationis becoming a necessity. IPv4 addresses, the current protocol devices use to communicate on the Internet, havealmost exhausted the world over with just a few remaining at the African Internet Registry (AFRINIC). In addition tosolving the IPv4 address depletion problem by providing more than enough addresses, the transition to the newer,better IPv6 protocol offers additional advantages where every device will have a globally routable public IP addresson the Internet. Hence there is not just a need, but far more a necessity, to move to IPv6 with its 340 undecillionaddresses that will make smart devices and the IoT a reality.The transition to IPv6, which helps connect and manage the proliferation of newer-generation devices that arecontributing to mobile network usage and data traffic growth, is well underway. Continuing the Cisco VNI focus onIPv6, the Cisco VNI 2017–2022 Mobile Data Traffic Forecast provides an update on IPv6-capable mobile devices andconnections and the potential for IPv6 mobile data traffic.Focusing on the high-growth mobile-device segments of smartphones and tablets, the forecast projects that globally94 percent of smartphones and tablets (6.6 billion) will be IPv6-capable by 2022 (up from 71 percent, or 3.2 billionsmartphones and tablets in 2017; refer to Figure 9). This estimation is based on OS support of IPv6 (primarily Androidand iOS) and the accelerated move to higher-speed mobile networks (3.5G or higher) capable of enabling IPv6. (Thisforecast is intended as a projection of the number of IPv6-capable mobile devices, not mobile devices with an IPv6connection actively configured by the Internet Service Provider [ISP].)Figure 9. Global IPv6-Capable Smartphones and Tablets15% CAGR2017-20226.676.05.464.75Number 2022Source: Cisco VNI Mobile, 2019For all mobile devices and connections, the forecasts project that, globally, 76 percent (9.4 billion) will be IPv6capable by 2022, up from 47 percent (4 billion) in 2017 (refer to Figure 10). M2M emerges as a key segment ofgrowth for IPv6-capable devices, reaching 2.3 billion by 2022, a growth at 31 percent CAGR during the forecastperiod. With its capability to vastly scale IP addresses and manage complex networks, IPv6 is critical in supporting theIoT of today and in the future.Regionally, Asia Pacific will lead throughout the forecast period with the highest number of IPv6-capable devicesand connections, reaching 4.7 billion by 2022. Middle East and Africa will have the highest growth rates during theforecast period, at 24 percent CAGR. (Refer to Table 8 in Appendix C for more regional detail.) 2019 Cisco and/or its affiliates. All rights reserved.
White paperCisco publicFigure 10. Global IPv6-Capable Mobile Devices18% CAGR2017-2022109.498.387.17Number 020212022Source: Cisco VNI Mobile, 2019Considering the significant potential for mobile-device IPv6 connectivity, the Cisco VNI Mobile Forecast providesestimation for IPv6 network traffic based on a graduated percentage of IPv6-capable devices becoming activelyconnected to an IPv6 network. Looking to 2022, if approximately 60 percent of IPv6-capable devices are connectedto an IPv6 network, the forecast estimates that, globally, IPv6 traffic will amount to 44.1 exabytes per month or 57percent of total mobile data traffic, a 26-fold growth from 2017 to 2022 (Figure 11).Figure 11. Projected IPv6 Mobile Data Traffic Forecast 2017–202292% CAGR2017-2022504544.14035Exabytesper Month3025.4252015.9151050Source: Cisco VNI Mobile, 2019 2019 Cisco and/or its affiliates. All rights reserved.9.41.720174.420182019202020212022
White paperCisco publicSecurity is the top concern in every enterprise’s mind today and it is all the more important for IPv6 as compared to itspredecessor (IPv4) given its vast addressable range.IPSec is the most widely used protocol suite for security in any communication network and even in present daycan be easily added to any IPv4 network. On the other hand, IPv6 includes native support for IPSec, which by itselfmay not be a big advantage, however when considered in combination with other capabilities, notably IPv6’s selfdiscovery capabilities and peer-to-peer nature, IPv6’s inherent support of IPSec plays an important role in creatingnetworks that are both simple to set up and secure.IPv6 with its vast addressable space makes any device supporting it more accessible at a global scale thus makingthe protocol more desirable for applications such as remote monitoring and support all the way from IT infrastructureto automobiles and appliances. Such capabilities also allow manufacturers to increase the life expectancy andfunctionalities of their products while decreasing the service costs.IPv6 is also expected to give rise to entirely new applications that would either be difficult or impossible to deploy withIPv4. The multicast capabilities of IPv6, allowing one-to-many communications, may give rise to everything from newforms of games to social network applications.Inherent support for IPSec within IPv6 makes it very easy to bring such new applications and benefits of IPv6 to life,something that may have been difficult or even impossible with IPv4.However, given that IPv6 is still a network layer protocol it cannot prevent advanced security breaches on OSI layersthat sit over the network layer.For example: Application layer attacks: Attacks performed at the application layer (OSI Layer 7) such as buffer overflow, virusesand malicious codes, web application attacks, and so on. Brute -force password guessing attacks on authentication modules. Unauthorized devices introduced into the network. Denial of service attacks. Attacks using social networking techniques such as email spamming, phishing, etc.For additional views on the latest IPv6 deployment trends, visit the Cisco site. The Cisco 6Lab analysis includescurrent statistics by country on IPv6 prefix deployment and IPv6 web-content availability, and estimations of IPv6users. With the convergence of IPv6 device capability, content availability, and significant network deployment, thediscussion of IPv6 has shifted focus from “what if” and “how soon will” to the “realization of the potential” that IPv6has for service providers and end users alike.Trend 2: Defining Cell Network Advances—2G, 3G, 4G and 5GProjectionsMobile devices and connections are not only getting smarter in their computing capabilities but are also evolving fromlower-generation network connectivity (2G) to higher-generation network connectivity (3G, 3.5G, 4G or LTE and nowalso 5G). This is the second year, that we are projecting the growth of devices and connections with 5G connectivitybased on some initial trial deployments (limited in scope) and larger-scale commercial efforts that are planned inthe future for various locations around the world. Combining device capabilities with faster, higher bandwidth andmore intelligent networks will facilitate broad experimentation and adoption of advanced multimedia applications thatcontribute to increased mobile and Wi-Fi traffic. 2019 Cisco and/or its affiliates. All rights reserved.
White paperCisco publicThe explosion of mobile applications and the expanded reach of mobile connectivity to a growing number of endusers has prompted the need for optimized bandwidth management and new network monetization models to sustaina maturing mobile industry. In a highly competitive mobile market, we have seen the growth of global 4G deploymentsas well as early-stage 5G implementations. Service providers globally are busy rolling out 4G networks to helpthem meet the growing end-user demand for more bandwidth, higher security, and faster connectivity on the move(Appendix B). Many providers have also started field trials for 5G and are gearing towards rolling out 5G deploymentstowards the middle of the forecast period to capture new market opportunities (and to establish competitivedifferentiation in some cases).Although, 4G surpassed all other connection types and will be the predominant mobile network connectivitythroughout the forecast period, by 2022, 5G impact will start to emerge. By 2022, 4G connections will be 54.3% oftotal mobile connections, compared to 34.7% in 2017 (Figure 12). The global mobile 4G connections will grow from 3billion in 2017 to 6.7 billion by 2022 at a CAGR of 18 percent. 5G connections will appear on the scene in 2019 andwill grow several thousand percent from under half a million in 2019 to over 400 million by 2022. Until last year, the5G connectivity could be accurately described as nascent. But this year, 5G warrants its own category and analysis(for the first time in this study).The relative share of 3G- and 3.5G-capable devices and connections surpassed 2G-capable devices andconnections in 2018. There were 30% 3G connections in 2017 compared to about 34% 2G connections, but by theend of the forecast period, there will be 20% 3G connections and 2G will only have 8% of connections. By 2022, therewill be 3.4% devices and connections with 5G capability.Figure 12. Global Mobile Devices and Connections by Network Type86Billions of 4Devices orConnections20201720182G (33.8%, 8.5%)4G (34.7%, 54.3%)LPWA (1.5%, 14.0)20192020202120223G (30.0%, 19.8%)5G (0.0%, 3.4%)Note: Figures in parentheses refer to 2017, 2022 device and connection share by network type.Source: Cisco VNI Mobile, 2019We also include Low-Power Wide-Area (LPWA) connections in our analysis. This type of ultranarrowband wirelessnetwork connectivity is meant specifically for M2M modules that require low bandwidth and wide geographiccoverage. It provides high coverage with low power consumption, module, and connectivity costs, thereby creatingnew M2M use cases for Mobile Network Operators (MNOs) that cellular networks alone could not have addressed.Examples include utility meters in residential basements, gas or water meters that do not have power connection,street lights, and pet or personal asset trackers. The share of LPWA connections (all M2M) will grow from about 2percent in 2017 to 14 percent by 2022, from 130 million in 2017 to 1.8 billion by 2022. 2019 Cisco and/or its affiliates. All rights reserved.
White paperCisco publicThe network evolution toward more advanced networks is happening both across the end-user device segmentand within the M2M connections category. This transition from 2G to 3G or 4G and now 5G deployment is a globaltrend. In fact, by 2022, about 60 percent of the mobile devices and connections in Western
The Cisco Visual Networking Index (VNI) Global Mobile Data Traffic Forecast Update is part of the comprehensive Cisco VNI Forecast, an ongoing initiative to track and forecast the impact of visual networking applications on global networks. This report presents some of the major