Transcription
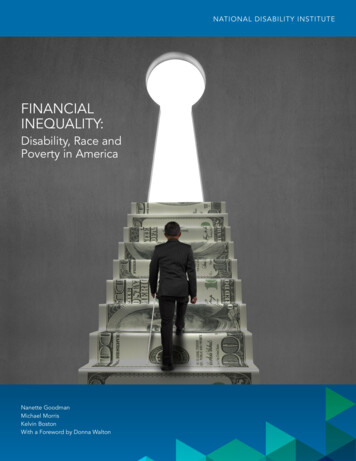
NATIONAL DISABILITY INSTITUTEFINANCIALINEQUALITY:Disability, Race andPoverty in AmericaNanette GoodmanMichael MorrisKelvin BostonWith a Foreword by Donna Walton1
TABLE OF CONTENTSFOREWORD4DISABILITY AND RACE51. Overview52. Methodology63. Prevalence of Disability94. Educational Attainment105. Poverty Rate126. Employment137. Banking Status158. Health Insurance and Medical Debt169. Food Security1710. Findings1812. Recommendations2313. Conclusion24BIOS253
FINANCIAL INEQUALITY:Disability, Race and Poverty in AmericaFOREWORDby Donna WaltonAuthor of Shattered Dreams, Broken Piecess a Board member of National Disability Institute, I am very pleased that this publication raises awarenessof an important issue that is little known to the general public—the impact of race and disability onfinancial instability.About two and a half decades ago, Eddie Glenn called attention to the disparate treatment of African Americanwomen with disabilities, suggesting that a triple jeopardy syndrome put them at a further disadvantage becausethey were victims of race, gender and disability bias in our society. Her research explored what it meant to be anAfrican American and live with a disability. Unfortunately, as evidenced in this current publication, people of colorand people with disabilities still face barriers to education and employment that limit their earning potential today.Until now, however, one would have been hard-pressed to find data illuminating these economic disparities.As an African American woman living with a disability, I have experienced the impact of race and disability on myown employment stability and have also witnessed its impact on other women of color with disabilities. The impactof the triple jeopardy syndrome cannot be overstated, as an African American woman with a disability can nevercan be quite sure if her race, gender or disability is hurting her chances for advancement. Is her chance to get a jobshe is qualified for jeopardized because she is black? Is she the recipient of inferior service at a bank because she isfemale? Does she receive insufficient financial planning opportunities because she has a disability?My experiences—being denied employment and facing financial planners who make false assumptions aboutmy income status and earning potential because of my disability, for instance—prompt my suspicions that triplejeopardy may still be working against me today. Suffice it to say that the discrimination experienced by AfricanAmerican women with disabilities has lingering effects on their financial stability.This publication explicates the unique dynamic of disability, race and poverty and underscores the necessity toincrease awareness about the intersection of race and poverty on the challenges people of color with disabilitiesface. Without a doubt, we must continue to have serious conversations about race and disability, as well asencourage our social service systems to approach disability and poverty from an integrative paradigmatic modelthat prevents people of color with disabilities from remaining below the bottom rung of the economic ladder.Nurturing a respectful and positive attitude and raising a higher consciousness toward people of color withdisabilities would serve as a major bridge across insensitive and ignorant waters. The river of society’s culturalresistance toward people with disabilities should flow into an ocean of awareness and policies that calm the watersfor those who struggle upstream to financial stability.Donna R. Walton, EdD44Glenn, E. (1992). African American Women with Disabilities: An Overview. Unpublished manuscript, Howard University Research and Training Center, Washington, DC.
DISABILITY AND RACE1. OverviewDisability and race both have important impacts on well-being, and though the relationship between the two factorshas not been well explored, indications are that the relationship between the two has a significant influence onpeople’s lives. African Americans are not only more likely to have a disability, but it appears that the impact of thatdisability on their lives may be greater than it is on their white counterparts.It is well known that both people of color and people with disabilities face barriers to education and employmentthat limit their earning potential. Less known is that African Americans are also more likely to have a disability.Fourteen percent of working-age African Americans have a disability compared with 11 percent of Non-HispanicWhites and eight percent of Latinos (Figure 2). In fact, African Americans are more likely than Non-Hispanic Whitesto have a disability in every age group. The relationship between race and disability, however, is complex. Forexample, Latinos have a lower rate of disability than most other racial groups, which increases faster with age(Figure 3).Having a disability creates extra costs for people and can limit their economic opportunities.2 This can be especiallydifficult for people of color who already have poorer outcomes in education, income and employment, and who alsoare less likely to be fully banked and more likely to use predatory financial services (Figures 4, 5, 6, 9, 10, 11).While disability and poverty have an interactive effect, our social service system treats them separately. For example,disability benefits (including health coverage) are often hinged on proving one is incapable of work, but anti-povertyprograms often have a work requirement.3 Thus, people with disabilities attempting to avoid poverty often facedifficult choices. Is it preferable to leave the labor market and qualify for disability benefits or work at whatever levelpossible and receive wages and perhaps qualify for food stamps or the Earned Income Tax Credit (EITC)?Race and disability are not completely separate sources of disadvantage that parallel each other. Race and disabilityare overlapping identities that are both related to systemic inequality.4It is often said that disability is both a cause and consequence of poverty and poverty and disability reinforce eachother, contributing to increased vulnerability and exclusion.5 Various factors and influences affect the relationshipbetween race, poverty and disability. For example:Poverty causes disability: Children living in poverty are more likely to have asthma, chronic illness, environmentaltrauma such as lead poisoning, learning problems and low birth weight that lead to disabilities. People in morephysically demanding jobs are also more likely to suffer workplace illnesses and injuries.62She, P. & Livermore, G.A. (2007) Material Hardship, Poverty, and Disability among Working-Age Adults. Social Science Quarterly. (88)4:970-989Pokempner, Jennifer and Roberts, Dorothy E., “Poverty, Welfare Reform, and the Meaning of Disability” (2001). Faculty Scholarship. Paper 1361. http://scholarship.law.upenn.edu/faculty scholarship/136134Ibid5DFID. (2000). Disability, poverty and development. London: DFID.Woolf, SH, Aron, L., Laudan, Dubay, L. Simon, S.S., Zimmerman, E. Luk, K.X. (2015) How Are Income and Wealth Linked to Health and Longevity? -Linked-to-Health-and-Longevity.pdf65
FINANCIAL INEQUALITY:Disability, Race and Poverty in AmericaPeople in poverty are less able to treat disabling conditions and to mitigate their impact: Limited accessto high quality medical care and early intervention may mean that a condition goes untreated longer and haspotentially more severe long-term effects.7Disability causes poverty: Disability adversely affects employment possibilities and earnings.8 It also can imposeadditional costs on families, such as medical bills, transportation, modifications to their home and personalassistants.9Race is linked to poverty and disability in America. African Americans as a group continue to have lowerincomes10 than whites and poorer health status than whites.11The lived experience of disability varies, both among people with disabilities and among racial and ethnic groups.Disability occurs on a continuum and at different ages. For example, an individual born with a disability may have avery different experience in social and economic inclusion than one who acquires the disability later in life after theyhave been educated or gained experience in the workforce. Individuals of color with disabilities may face negativestereotypes for either of their minority statuses (color or disability), or they may find they do not fully affiliate withracial/ethnic groups because of disability and may not fully affiliate with disability identity because of color.122. Methodologya.Data SourcesThis report draws on data from the following large nationally representative surveys: 015 American Community Survey, an ongoing nationally representative survey of conducted by the U.S.2Census Bureau that includes a broad range of demographic, economic and housing information. he Current Population Survey, a monthly survey conducted by the U.S. Census Bureau for the BureauTof Labor Statistics (BLS) that focuses on the labor force. In June 2015, the survey included an “Unbanked/Underbanked Supplement.” The December 2015 Current Population Survey included questions on food security. ational Health Interview Survey 2015, conducted by the National Center for Health Statistics, with a focusNon health, influences on health and health outcomes.As shown in Figure 1, all four surveys include sizable samples of adults with and without disabilities.7Pokempner, 2001United States Senate Committee on Health, Education, Labor & Pensions (2014), Fulfilling the Promise: Overcoming Persistent Barriers to Economic Self-Sufficiencyfor People with Disabilities. Majority Committee Staff Report. Pearce, D.M (2011). Disability and Self-Sufficiency: Estimating the Extra Costs of Disability Required to Achieve a Self-Sufficiency Standard of Living. y2011Disability.pdf910DeNavas-Walt, C & Proctor, B.D. (2015). Income and Poverty in the United States: 2014 Current Population Reports, U.S. Census Bureau. Report #P60-252 publications/2015/demo/p60-252.pdf11CDC Health Disparities & Inequalities Report – United States, 2013, Morbidity & Mortality Weekly Report (MMWR) Supplement, November 22, 2013, Vol.62, Supplement No. 3, pg.1-187McDonald, K., Keys, C.B., & Balcazar, F.E. (2007) Disability, race/ethnicity and gender: themes of cultural oppression, acts of individual resistance. Am J CommunityPsychol. 39:145–161.126
Figure 1TopicsNumber ofworking-agerespondentsNumber of workingage respondentswith disabilities1,724,584231,468American Community Survey, 2015Prevalence, educationalattainment, poverty rate,employment statusUnbanked/UnderbankedSupplement to Current PopulationSurvey, June 2015Underbanked and useof Alternative FinancialServices21,8043,360Food Security Supplement tothe Current Population Survey,December 2015Food security34,8723,868National Health InterviewSurvey, 2015Medical care and cost56,6187,255b.Definition of DisabilityDisability is a complex concept with different definitions used in a variety of contexts. The Americans withDisabilities Act (ADA) defines disability as “a physical or mental impairment that substantially limits one or moremajor life activities” or “being regarded as having such an impairment.”Eligibility for certain disability-related programs have more restrictive definitions. For example, the definition usedto determine eligibility for the two primary disability income support programs, Social Security Disability Insurance(SSDI) and Supplemental Security Income (SSI), define a person with a disability as one “who, because of a physicalor mental impairment expected to last at least one year or to result in death, are unable to return to any of theirpast jobs or to do any work that exists in the national economy at a level in which they could do substantial gainfulactivity.” This paper focuses on disability as measured by several of the large nationally representative surveys.In the American Community Survey and the Current Population Survey, respondents are considered to have adisability if they respond “yes” to any of the following six types of functional limitations: Are you deaf or do you have serious difficulty hearing? Are you blind or do you have serious difficulty seeing, even when wearing glasses? ecause of a physical, mental, or emotional problem, do you have difficulty remembering, concentrating, orBmaking decisions? Do you have difficulty walking or climbing stairs? Do you have difficulty bathing or dressing? ecause of a physical, mental, or emotional problem, do you have difficulty doing errands alone such asBvisiting a doctor’s office or shopping?In the National Health Interview Survey, respondents are considered to have a disability if they respond “yes” to anyof the following questions:1312Division of Health Interview Statistics National Center for Health Statistics. NHIS Survey Description. http://www.cdc.gov/nchs/data/nhis/srvydesc.pdf7
ecause of a physical, mental, or emotional problem do you need the help of other persons with personalBcare needs, such as eating, bathing, dressing, or getting around inside this home? ecause of a physical, mental, or emotional problem, do you need the help of other persons in handlingBroutine needs? Does a physical, mental, or emotional problem now keep you from working at a job or business? re you limited in the kind or amount of work you can do because of a physical, mental or emotionalAproblem? ecause of a health problem, [fill: do you/does anyone in the family] have difficulty walking without usingBany special equipment? re you limited in any way because of difficulty remembering or because you experience periods ofAconfusion? Are you limited in any way in any activities because of physical, mental or emotional problems?c.AnalysisThe data and tables for this report were developed by the staff of National Disability Institute (NDI) using STATAStatistical Software to analyze Public Use Microdata Samples (PUMS). PUMS are large computer files made up ofindividual level information for each person in the sample. Prior to making the data available to the public, theagencies that administer the surveys remove all information that could be used to identify an individual respondentto protect confidentiality. NDI used STATA statistical software to create custom tables that are not included in thepre-tabulated products available from the U.S. Census Bureau.The data describes the status of people with disabilities and the disparities that exist among Non-Hispanic Whitesand people of color. It does not attribute causes to these inequalities. The racial difference may be the result ofrace or it may be the result of other characteristics. For example, a lower employment rate may be the result of anumber of factors, in addition to racial discrimination, including level of education or the economic characteristicsof a community.8
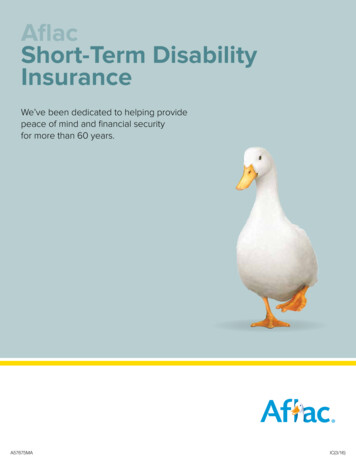
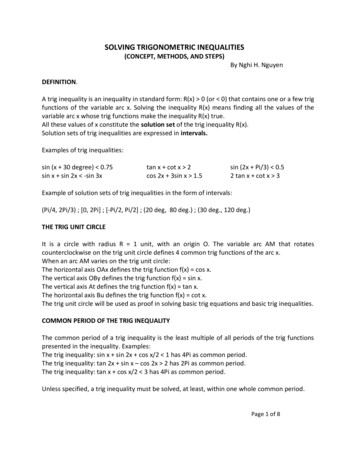
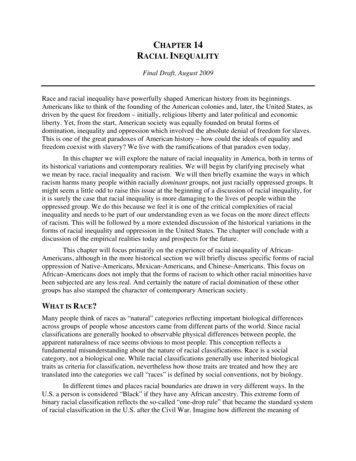
3.Prevalence of DisabilityOne in nine working-age adults (18-65) have a disability that may put them at risk of exclusion from the economicmainstream (Figure 2).This rate varies dramatically by race and ethnicity. African Americans are the most likely to have a disability (14percent) followed by Non-Hispanic Whites (11 percent), Latinos (8 percent) and Asians (5 percent) (Figure 2). Thisdisparity results from a complex interaction of socioeconomic and demographic characteristics.Figure 2: Prevalence of Disability by ricanAmericanHispanic/LatinoAsianTotalSource: American Community Survey, 2015The likelihood of having a disability increases with age. Six percent of young adults age 18-20 have a disability,compared with 22 percent of adults near retirement age (61-65) (Figure 3). Chronic medical conditions such asdiabetes, high blood pressure, back pain, anxiety or depression can lead to functional limitations over time. Inaddition, the cumulative effects of inadequate nutrition and health care, stressful or unsafe working conditions andother risk factors increase the risk of disability over the lifespan.The disparity by race widens with age. At age 18-20, African Americans are slightly more likely to have a disabilitythan Non-Hispanic Whites (7 percent compared to 6 percent), but among those 61-65, the disparity grows to 50percent (30 percent compared to 20 percent) (Figure 3).14%Younger Latinos have a lower rate of disability than Non-Hispanic Whites. At age 55, the rates are equivalent(15 percent) and older Latinos (61-65) are more likely to have a disability than Non-Hispanic Whites (23 percent11%compared to 20 percent).8%5%9
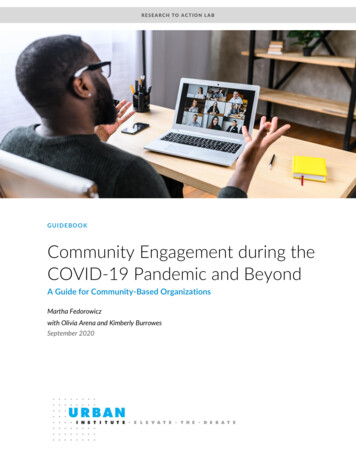
Figure 3: Disability Rate by Age and nic 1-3536-4041-4546-5051-5556-6061-65Source: American Community Survey, 2015AsianHispanic/LatinoAdults with disabilities tend to have lower levels of education than those without a disability. More than one in fiveadults with disabilities have less than a high school education (21 percent) compared to 11 percent of adults withno disability. Only 13 percent have a bachelor’s degree or more compared to 31 percent of adults with no disability(Figure 4).Asians and Non-Hispanic Whites are more likely to have college degrees than African Americans or Latinos, butthese two groups also have a higher disparity between adults with and without disabilities. Nevertheless, amongpeople with disabilities, Asians are the most likely to have a bachelor’s degree (26 percent) followed by Non-HispanicWhites (15 percent), Latinos (9 percent) and African Americans (9 percent) (Figure 5).Because educational attainment is such an important factor in employment and income, the lower level ofeducation among adults with disabilities, and especially among adults of color with disabilities, has a significantimpact on the ability of these individuals to be economically successful.10
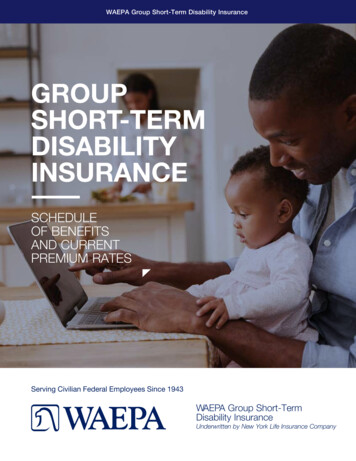
Figure 4: Educational Attainment by Race & Disability StatusLess than HighSchool GraduateHS or GEDSome Collegeor Associate’sBachelor’sor BeyondWith Disability16%36%33%15%No Disability6%25%34%35%With Disability25%36%31%9%No Disability11%31%38%20%With Disability36%30%25%9%No Disability27%29%29%15%With Disability27%21%25%26%No Disability10%15%23%52%With Disability21%35%31%13%No Disability11%26%33%31%Non-Hispanic WhiteBlack/African AmericanHispanic/LatinoAsianTotalSource: American Community Survey, 2015Figure 5: Bachelor’s or Postgraduate Degree by Race and Disability With DisabilityAsianTotalNo DisabilitySource: American Community Survey, 201511
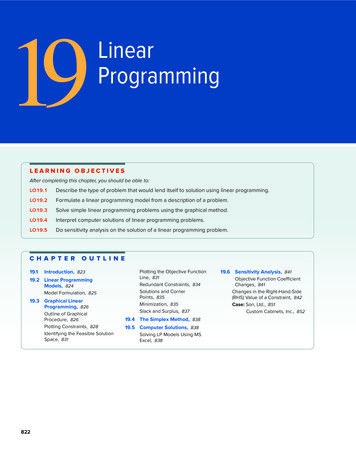
5.Poverty RateThe poverty rate for adults with disabilities is more than twice the rate of adults with no disability (27 percentcompared with 12 percent) (Figure 6). The relationship between disability and poverty is complicated. People withdisabilities are more likely to become impoverished and people living in poverty are more likely to have or acquirea disability. Disability causes poverty because people with disabilities may be excluded from the workforce, havelimited educational opportunities or face institutional barriers that restrict their earnings.The poverty rate varies by color for people with and without disabilities. Almost 40 percent of African Americanswith disabilities live in poverty, compared with 24 percent of Non-Hispanic Whites, 29 percent of Latinos and 19percent of Asians (Figure 6). People of color with disabilities seem to face double marginalization, discrimination andstigma that lead to poor socioeconomic outcomes.The disparity in poverty between adults with and without disabilities is most significant among Non-Hispanic Whites,where adults with disabilities are two and a half times as likely to live in poverty as those without a disability (24percent compared with 9 percent) (Figure 6).Figure 6: Poverty Rate by Disability Status and ith DisabilityAsian12%TotalNo DisabilitySource: American Community Survey, 2015Poverty is highly correlated with educational attainment for adults with and without disabilities. Among adults withdisabilities, 40 percent of those with less than a high school education live in poverty compared with 14 percent ofthose with a bachelor’s degree and 10 percent of those with a postgraduate degree (Not shown in a chart).Even when adjusting for education level, African Americans with disabilities are more likely to be in poverty thanother disability groups. Thirty-nine percent of Non-Hispanic Whites with disabilities, who have less than a highschool degree, live in poverty compared with 51 percent of African Americans with disabilities who have the samelevel of education. This racial disparity persists among adults with disabilities with higher levels of education.Thirteen percent of Non-Hispanic Whites with a disability and a bachelor’s degree live in poverty compared with20 percent of African Americans, 16 percent of Latinos and 12 percent of Asians with the same level of education(Figure 7).12
Figure 7: Poverty Rate among Working-Age Adults with Disabilities by Education Level and Race60%50%40%30%20%10%0%Less thanHSHS or GEDSomeCollegeAssociatesNon-Hispanic WhiteAsianBlack/African : American Community Survey, 20156.EmploymentFewer than one in three working-age adults (33 percent) with disabilities are employed, compared to 75 percent ofadults without a disability (Figure 8).The employment status of working-age adults can be categorized into three classifications: Employed: Currently working. Unemployed: Not employed at the time of the survey, but actively looking for work. ot in the Labor Market: Not currently employed and not looking for work. This includes people who areNin school, have family responsibilities that keep them from working, have given up looking for work becausethey have previously been unable to a find a job or believe no job is available given their schooling, training,experience or other characteristics. People with disabilities who receive income support from Social SecurityDisability Insurance or Supplemental Security Income often do not participate in the labor market. In fact,eligibility for these programs is predicated on an “inability to do any substantial gainful activity by reason ofa medically determinable physical or mental impairment.”13
Figure 8: Poverty Rate among Working-Age Adults with Disabilities by Education Level and Race5%5%UnemployedUnemployed20%Not in LaborMarket33%62%EmployedNot in LaborMarket75%EmployedWith DisabilityNo DisabilityWorking-age people with disabilities are much less likely to be employed than people without disabilities in allracial and ethnic groups. Among people with disabilities, the employment rate is similar among Asians (39 percent),Non-Hispanic Whites (35 percent) and Latinos (35 percent). The gap between people with and without disabilitiesis similar in all racial groups, but the disability gap, combined with a racial gap, leaves African Americans withdisabilities with the lowest employment rate (25 percent) (Figure 9).Figure 9: Employment to Population Ratio by Disability Status and tinoWith DisabilityAsianNo DisabilitySource: American Community Survey, 201514Total
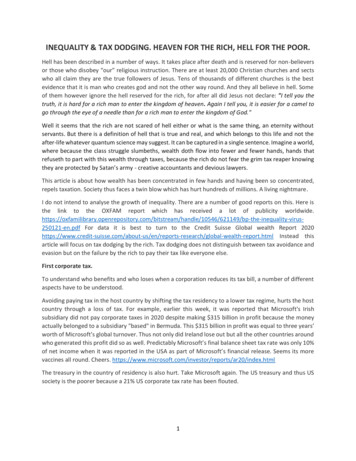
7.Banking StatusBeing banked is a critical component of financial inclusion. However, 48 percent of households with working ageadults with a disability were unbanked or underbanked in 2015, compared to 28 percent of households in the sameage group without a disability (Figure 10).The racial disparity is striking. Two-thirds (67 percent) of African American families with a disability were unbankedor underbanked, compared with 40 percent of Non-Hispanic White households, 54 percent of Latinos and 40percent of Asians (Figure 10).14Households are considered “unbanked” if no one in the household has a checking or savings account and“underbanked” if they have a checking or savings account, but used alternative financial services in the last 12months (e.g., non-bank money order, non-banking check cashing services, non-bank remittances, payday loans,rent-to-own services, pawn shops, refund anticipation loans or auto title loans).Figure 10: Unbanked or Underbanked Working-Age Households by Disability Status and tinoWith DisabilityAsianTotalNo DisabilitySource: Survey of Unbanked and Underbanked, Current Population Survey June Supplement, 2015Households with a disability are almost twice as likely than those without a disability to use alternative, oftenpredatory, lending services such as payday lenders, pawn shops, rent-to-own, tax refund anticipation loans or autotitle loans (15 percent compared with 8 percent). These services often trap the household in a cycle of high interestloans that make it difficult for them to maintain economic stability (Figure 11).The disparity between households with and without disabilities in their use of alternative financial services is mostsignificant among Non-Hispanic White households where 14 percent of households with a disability used suchservices, compared with only six percent of households without a disability.Among households with a disability, African Americans were most likely to use alternative services (15 percent)followed by Latinos (13 percent).Disability Status of Household is determined by Householder. See Federal Deposit Insurance Corporation, (2016) FDIC National Survey of Unbanked and Underbanked Households. ehold/documents/2015 FDIC Unbanked HH Survey Report.pdf1415
Figure 11: Use of Alternative Financial Credit Services in the Last 12 months, by Disability Statusand Race of Household WhiteBlack/AfricanAmericanHispanic/LatinoWith DisabilityAsianTotalNo DisabilitySource: Survey of Unbanked and Underbanked, Current Population Survey June Supplement, 20158.Health Insurance and Medical DebtAdults with disabilities are less likely to lack health Insurance than those without disabilities because they are muchmore likely to be covered by Medicare or Medicaid.15 Nevertheless, they are more than twice as likely to havedifficulty paying their medical bills. These bills may be the result of out-of-pocket expenses for co-payments anddeductibles or uncovered services (Figure 12).One-third of adults with disabilities had difficulty paying medical bills in the past 12 months, compared with 14percent of adults without a disability. While there are large racial differences in the percentage of people withoutdisabilities who have trouble paying bills, among people with disabilities, 33 percent each of Non-Hispanic Whites,African Americans and Latinos had difficulty meeting these financial obligations (Figure 12).One-sixth of adults with disabilities needed, but did not get, medical care in the last 12 months because of the cost.African Americans were the most likely to face this cost barrier (17 percent), followed by Non-Hispanic Whites withdisabilities (16 percent), Latinos (15 percent) and Asians (14 percent) (Figure 13).Houtenville, AJ, Brucker, DL., Lauer, EA. (2016). Annual Compendium of Disability, Statistics: 2015. Durham, NH: University of New Hampshire, Institute on isability-status-2014.1516
Figure 12: Difficulty Paying Medical Bills in the Past 12 Months, by Disability and h DisabilityAsianTotalNo DisabilitySource: National Health Interview Survey, 2015Figure 13: Adults Who Did Not Get Medical Care because of Cost in the Last 12 months, by Disability Status and teBlack/AfricanAmericanHispanic/LatinoWith DisabilityAsian5%TotalNo DisabilitySource: National Health Interview Survey, 20159.Food SecurityAlthough many people with disabilities use federal and state programs designed to provide assistance in meetingbasic needs, they often fall into one of two groups: ow food security—Households reduced the quality, variety and desirability of their diets, but the quantityLof food intake and normal eating patterns were not substantially disrupted. ery low food security—At times during the year, eating patterns of one or more household membersVwere disrupted and food intake reduced because the household lacked money and other resources forfood.Working-age adults with disabilities are four times more likely to live with low or very low food security than adultswithout disabilities (Figure 14).17
Food insecurity, in addition to being more likely in households affected by disabilities, may be even moreproblematic for those households since these conditions may be exacerbated by insufficient food or a low-qualitydiet resulting from food insecurity.16The prevalence of food insecurity among people with disabilities varies by race and ethnicity. African Americansand Latinos with disabilities were most likely to be food insecure in the past 30 days (26 and 27 percent) followed byNon-Hispanic Whites (24 percent) (Figure 14).Figure 14: Adults with Disabilities Living in F
Less known is that African Americans are also more likely to have a disability. Fourteen percent of working-age African Americans have a disability compared with 11 percent of Non-Hispanic Whites and eight percent of Latinos (Figure 2). In fact, African Americans are more likely than Non-Hispanic Whites