Transcription
Fact Sheet No. 40February 2017UIS/FS/2017/ED/40-RevEducation and DisabilityThe UNESCO Institutefor Statistics (UIS) is thestatistical office ofUNESCO and is the UNdepository for globalstatistics in the fields ofeducation, science andtechnology, culture andcommunication.The notion of equity is at the heart of the Sustainable Development Goals,including SDG 4 on education. Analysis of disparities linked to disability haslong been a challenge due to a scarcity of reliable and comparable data. Toaddress this problem, the Washington Group on Disability Statistics hasdeveloped questions for household surveys that allow the collection andanalysis of internationally comparable data on persons with disabilities. Thisfact sheet presents attendance rates and completion rates disaggregated bydisability status based on data from Demographic and Health Surveys thathttp://uis.unesco.org@UNESCOstatapplied the questions recommended by the Washington Group. The findingsof the analysis by the UNESCO Institute for Statistics (UIS) confirm thatpersons with disabilities are more likely to be out of school or to leave schoolThis fact sheet wasproduced with thesupport of theDepartment forInternationalDevelopment (DFID)of the United Kingdom.before completing primary or secondary education. The fact sheet alsosummarises plans by the UIS for future data analysis and activities instandard setting to strengthen the evidence base for monitoring of SDG 4and the design of education policy.IntroductionIn 2000, countries committed to achieving the Millennium Development Goals(MDGs), a set of goals to reduce extreme poverty and exclusion. As not all goalswere achieved by the target year of 2015, the United Nations adopted a new set ofinternational goals to be achieved by 2030: the Sustainable Development Goals(SDGs). Compared to the MDGs, which were limited in addressing equity andequality, the SDGs encompass and strengthen the notion of equity and humanrights (Fehling et al., 2013). SDG 4 on education aims to "ensure inclusive andequitable quality education and promote lifelong learning opportunities for all".
2UIS Fact Sheet No. 40 February 2017Previously, persons with disabilities were not mentioned in any of the MDGs (UN, 2015c). This represents 1billion individuals with one or more physical, sensory, intellectual or mental health impairments (WHO, 2016).Their inclusion is crucial to the realisation of the international goals to ensure that no one is left behind. Fiveof the 17 SDGs include explicit references to persons with disabilities: education (SDG 4), employment (SDG8), inequality (SDG 10), sustainable cities and communities (SDG 11) and global partnership (SDG 17).Regarding the education goal, Target 4.5 specifically aims to "by 2030, eliminate gender disparities ineducation and ensure equal access to all levels of education and vocational training for the vulnerable,including persons with disabilities, indigenous peoples and children in vulnerable situations".Measurement of disabilityAn important challenge in producing internationally-comparable data on persons with disability is how theterm ‘disability’ is understood. There is no uniform definition, often confusion on what constitutes a disability,and methodologies used across countries are inconsistent when collecting this type of information (UN,2015a). The notion of disability is complex and can be understood in a variety of ways. Different definitionslead to diverging estimates of the number of individuals with a disability. Another issue is the varying qualityof the study design (Mont, 2007). Disability attributes could be measured with different methods and not becomparable. For example, disability could be measured through medical examinations, self-reporting (“Doyou have a disability?”) or questions about certain activities (“Do you have difficulty hearing?”). Often there isalso a stigma related to having a disability and its prevalence may therefore be under-reported. These factorsmake it difficult to determine the extent of exclusion and to reach affected individuals with proper policies,for example to provide access to schooling for all children with disabilities.To address the need for globally-comparable measures of disability, the Washington Group (WG) onDisability Statistics was established in 2001. The WG developed a set of questions for use in householdsurveys and censuses to identify persons with a disability based on the presence of difficulties in six corefunctional domains: seeing, hearing, walking, cognition, self-care and communication. During data collection,respondents answer on a four-category scale: no difficulty, some difficulty, a lot of difficulty, cannot do at all.According to the WG standard, a person is considered to have a disability if for at least one of the sixfunctional areas the answer is ”a lot of difficulty” or “cannot do at all”. This method was found to be easy toimplement for data collectors without medical expertise and to be translated in many languages, andimportantly, to maintain comparability of collected data. For these reasons, the short set on functioning bythe WG has been endorsed by the United Nations for the collection of data on disability characteristics in the2015 round of population censuses (UN, 2015b).The WG short set is suitable for persons aged five years and above but cannot capture certain developmentaland psychosocial disabilities among children. The WG and UNICEF therefore collaborated to develop a set ofquestions for child functioning that addresses aspects of child development not covered by the short set ofquestions (WG and UNICEF, 2014). The WG also developed an extended set of questions for more in-depth
UIS Fact Sheet No. 40 February 20173data collection on disability among adults. In addition to the six domains of the short set, the extended setcovers areas such as upper body functioning, pain, fatigue, and affect (anxiety and depression). 1Availability of survey dataThe Demographic and Health Surveys (DHS) program collects and disseminates data on population, health,nutrition and other topics in developing countries. Recent DHS surveys contain a module that allows thecollection of disability data based on the internationally-comparable short set of questions developed by theWG (USAID, 2016). Previously, information on disability was collected in a small number of DHS surveys butusing country-specific questions instead of the WG set.For this fact sheet, data from three comparable DHS datasets were available for analysis: Cambodia 2014,Maldives 2009 and Uganda 2011. All three use the short set of disability questions by the WG. In the nearfuture, additional DHS datasets are expected to be available for analysis: Haiti 2016, South Africa 2016,Timor-Leste 2016 and Uganda 2016. For comparison, this fact sheet also contains information from two DHSsurveys that did not use the WG set of questions: Colombia 2010 and Gambia 2013 (see Table 1).Future Multiple Indicator Cluster Surveys (MICS) by UNICEF will collect data on children with disabilities basedon the new set of questions on child functioning by the WG, but no survey results were available for analysisfor this fact sheet.Table 1. Availability and comparability of disability data in various Demographic andHealth SurveysCountrySurveyWG questionsDataset availableCambodiaDHS 2014YesYesMaldivesDHS 2009YesYesUgandaDHS 2011YesYesHaitiDHS 2016YesNoSouth AfricaDHS 2016YesNoTimor-LesteDHS 2016YesNoUgandaDHS 2016YesNoDHS 2009-2010NoYesDHS 2013NoYesColombiaGambiaMore information about the different sets of questions is available on the website of the WG, athttp://www.washingtongroup-disability.com1
UIS Fact Sheet No. 40 February 20174Comparison of prevalence: Washington Group vs. non-Washington GroupAccording to the World Health Organization (WHO), the global prevalence of some form of disability is in therealm of 15% (WHO, 2016). The WG questions make more rigorous comparisons across countries possible.Table 2 provides the comparable disability rates in Cambodia (2%), Maldives (10%) and Uganda (5%) amongindividuals aged 5 years and older. Also provided are the rates for two countries with limited comparability:5% in Colombia and 3% in Gambia.Table 2. Disability rates in Washington Group and non-Washington Group countriesCountries using WGNon-WG countriesquestions(various ages) (%)(age 5 years and older) nda20114.92009-20104.9All ages20133.07-69 yearsSource: Demographic and Health SurveysCambodia, Maldives and Uganda used the set of questions recommended by the WG. On the other hand,the two non-WG countries in Table 2 used country-specific questions that are not cross-country comparable.In Gambia, household members were screened whether they had difficulty seeing, hearing or using theirlegs. In Colombia, household members were asked whether they had difficulty in several functional areassimilar to the WG set but also whether they had mental, emotional, heart or respiratory problems.Table 3 compares the six core domains of functioning in the three countries that used the WG questions.Household members are classified as having a disability if the answer for any domain is “a lot of difficulty”or “cannot do at all”. In Cambodia and Uganda, difficulties walking are most prevalent (0.9% and 1.8%,respectively), whereas in the Maldives disability related to vision is most common (4.8%). Vision is also thesecond-most widespread disability in Uganda (1.7%) and third in Cambodia (0.7%).Table 3. Proportion of persons 5 years and above with a disability by functionaldomain, countries using Washington Group 80.5CountryNote: Disability “a lot of difficulty” or “cannot do at all”.Source: Demographic and Health Surveys
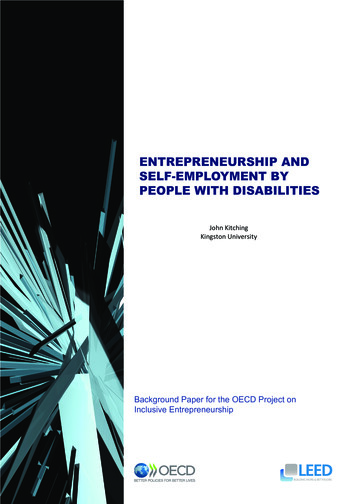
UIS Fact Sheet No. 40 February 20175School attendance by disability statusPrevious studies have shown that children with a disability have lower attendance rates in school than otherchildren in the same age group (WHO and World Bank, 2011), and the analysis of the DHS data confirms this.In this fact sheet, only results for groups with at least 25 unweighted observations are reported to minimiseerrors associated with small sample sizes. The out-of-school rates in Figure 1 indicate the proportion ofchildren of primary school age who are not attending primary or secondary school. In all three countries thatused the WG set of questions, out-of-school rates are higher for children with a disability. The most strikinggap is in Cambodia, with a 50 percentage point difference between the out-of-school rate of disabled andnon-disabled children (57% vs. 7%). In other words, 1 in 2 Cambodian children with a disability is not inschool, compared to 1 in 14 children without a disability. The difference is smaller in the Maldives andUganda, but the data are still proof of stark inequality: in these countries, the out-of-school rate of disabledchildren is more than twice that of non-disabled children.The primary out-of-school rate was also examined for countries using country-specific questions instead ofthe internationally-comparable set of WG questions. Although the data are of limited comparability becauseof different measurement methods, the same pattern can be observed in the non-WG countries: the out-ofschool rate of children with a disability is much higher than that of those without a disability (see Figure 2).Figure 1. Out-of-school rate of children of primary school age, countries usingWashington Group questions, by disability status (%)7060575040302320151110760Cambodia DHS 2014Maldives DHS 2009DisabilitySource: Demographic and Health SurveysNo disabilityUganda DHS 2011
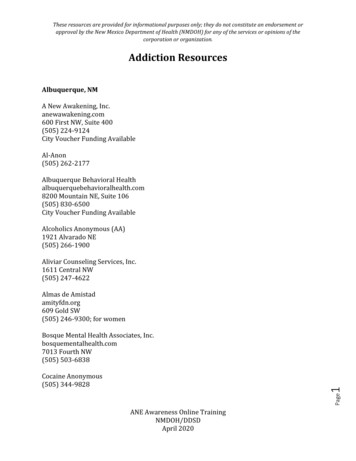
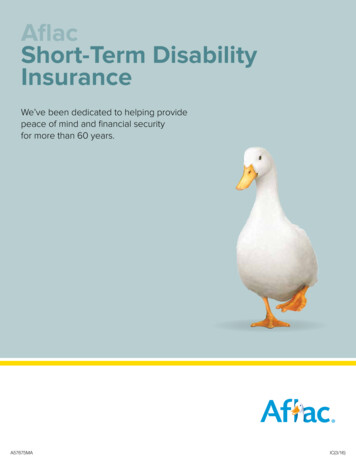
UIS Fact Sheet No. 40 February 20176Figure 2. Out-of-school rate of children of primary school age, countries not usingWashington Group questions, by disability status (%)4542403529302524201510950Colombia DHS 2009-10DisabilityGambia DHS 2013No disabilitySource: Demographic and Health SurveysThe same gap in out-of-school rates is noted among adolescents of lower secondary school age (see Figure3). In the Maldives and Uganda, adolescents with a disability are more likely to be out of school than thosewithout a disability. In the Maldives, the out-of-school rate of disabled adolescents is four times that of nondisabled adolescents, whereas in Uganda, it is double. In the sample from Cambodia, the number ofindividuals of lower secondary school age with a disability is too small (less than 25) and therefore no outof-school rate was calculated for this group.The lower secondary out-of-school rate was also examined for countries that used country-specific questionsinstead of the internationally comparable set of WG questions (see Figure 4). In Colombia, the out-of-schoolrate of adolescents with a disability is more than four times as high as the out-of-school rate of those withouta disability. In the data from the Gambia, the difference is negligible. However, as previously pointed out,disability was defined and measured differently in these surveys, thus making the results less comparable.
UIS Fact Sheet No. 40 February 20177Figure 3. Out-of-school rate of adolescents of lower secondary school age, countriesusing Washington Group questions, by disability status (%)35333026252017131510530Cambodia DHS 2014Maldives DHS 2009DisabilityUganda DHS 2011No disabilityNote: Cambodia: value for adolescents with a disability suppressed, less than 25 unweighted observations in sample.Source: Demographic and Health SurveysFigure 4. Out-of-school rate of adolescents of lower secondary school age, countriesnot using Washington Group questions, by disability status (%)40363534302520161510530Colombia DHS 2009-10DisabilitySource: Demographic and Health SurveysGambia DHS 2013No disability
UIS Fact Sheet No. 40 Feb
Fact Sheet No. 40 February 2017 UIS/FS/2017/ED/40-Rev Education and Disability The notion of equity is at the heart of the Sustainable Development Goals, including SDG 4 on education. Analysis of disparities linked to disability has long been a challenge due to a scarcity of reliable and comparable data. To address this problem, the Washington Group on Disability Statistics has developed .