Transcription
Advancing Opportunity,Prosperity, and GrowthW W W . H A M I LT O N P R O J E C T. O R GThe Changing Landscape of American Life ExpectancyBy Diane Whitmore Schanzenbach, Ryan Nunn, and Lauren BauerJUNE 2016IntroductionLife expectancy—the average remaining years an individual of a particular age can beexpected to live—is perhaps the most valuable indicator of social progress. In the past 100years Americans have enjoyed an overall gain of about 25 years in life expectancy at birth.Many of us take for granted the continuous improvement in life expectancy that much ofthe industrialized world has experienced over the past several centuries. These gains are theresult of deliberate individual and social efforts that must be reinforced through continuedprivate and public investments.Some recently documented trends in U.S. life expectancy are encouraging. Life expectancyat birth continues to increase, and mortality has generally declined; for some populationsmortality has fallen dramatically in recent years. Mortality for blacks, and particularly forblack men, has been decreasing in recent decades, with the mortality rate for black men age45–54 falling by about a third from 1999 to 2014. Mortality among children overall has fallen,and at the same time the inequality in children’s mortality by income level has declined.Despite our progress, some improvements have yet to reach more-vulnerable populations.Low-income workers have experienced stagnating or even falling life expectancy over thepast 30 years and mortality rates have increased for middle-aged whites by about 10 percentover 1999–2014.These trends demand that we continue to focus our attention on investing in the health andwell-being of all Americans. In acknowledging disparities in life expectancy trends, we shouldalso evaluate the fairness and effectiveness of our existing policies, including investments insocial insurance programs. Because it reflects the state of economic growth and the extentto which the entire population participates in that growth, life expectancy relates directlyto core concerns of The Hamilton Project. In this framing paper we consider a number ofpolicies that are relevant to life expectancy trends and suggest reforms aimed at extendinglife expectancy gains.The Hamilton Project Brookings
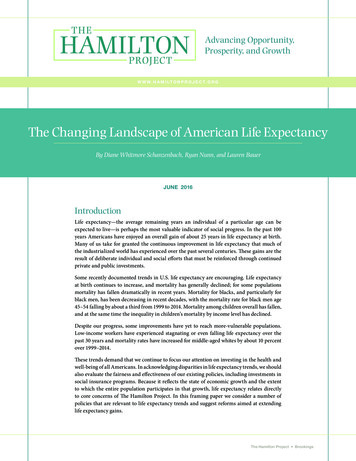
Large Gains in Life ExpectancyDuring the 20th century most of the industrialized world,including the United States, saw some of the greatest gains inlife expectancy ever recorded. This was a colossal achievementof medical science, public health, and economic progress.Figure 1 plots life expectancy at birth for American men andwomen from 1900 to 2010, with selected events shown onthe graph.1 At the turn of the 20th century, life expectancy atbirth was only 46 years for men and 48 years for women. Bymidcentury, life expectancy was around 66 years for men and71 years for women. In the most recent years, life expectancyhas increased to 76 years for men and 81 years for women.Much of the improvement over the past century came in theform of reduced infant mortality, which fell by more than 90percent (Centers for Disease Control and Prevention [CDC]1999). But increases in life expectancy at older ages were alsodramatic: 15-year-olds in 1900 could expect to live 46.8 moreyears, whereas their counterparts in 2000 could expect to live62.6 more years, an increase of almost 16 years. At the older endof the age distribution, 60-year-olds in 1900 and 2000 couldexpect to live 14.8 years and 21.6 more years, respectively.WHAT PRODUCED THE GAINS?The dramatic gains in life expectancy over time can beexplained by a combination of technology improvements(e.g., more-effective medical treatments and safer cars) andsocial factors (e.g., increasing real incomes, antipovertyprograms, and the reduction in cigarette smoking).One way to chronicle the progress in technology is by causes ofdeath, which the CDC analyzes. In 1900 a plurality of deathswas caused by infections. Pneumonia, influenza, tuberculosis,gastrointestinal infections, and diphtheria claimed 34 percent ofall those who died in that year (CDC n.d.b; Jones, Podolsky, andGreene 2012). By contrast, the only infections on this list thatcaused an appreciable number of deaths in 2010 were pneumoniaand influenza, and those diseases accounted for only 2 percentof deaths (Hoyert 2012). As the burden of infectious diseaserecedes, death more frequently occurs in old age and is mostcommonly associated with heart disease and cancer—thesetwo causes alone accounted for nearly half of deaths in 2010(Jones, Podolsky, and Greene 2012). Today, microbial resistanceto antibiotics is becoming more of a concern, a development wediscuss in the next section.The reduction in the prevalence of infection-related deathsis a story of technological innovation, chiefly concerningantibiotics and vaccines. Antibiotics reduced the incidence ofmany bacterial infections (Nichols 2004) and, importantly,made it possible to conduct more-ambitious surgeries (e.g.,excision of cancerous tissue) by preventing postsurgicalinfections. For viral infections like smallpox, measles, andpolio, vaccines provided a relatively inexpensive and powerfulsolution (UNICEF 1996).BOX 1.What Is Life Expectancy?Life expectancy is an estimate of the average remaining number of years that a person will live given their current age. In someinstances, as explained in the figure source notes, we show the current age plus the expected remaining years (i.e., the expectedage at death) rather than expected years remaining. Note that life expectancy is distinct from the mortality rate, which showsthe number of recorded deaths in a given period. The two measures will move in opposite directions after an event that affectslongevity; life expectancy will increase and mortality will decrease when smoking becomes less common, for instance.There are two ways of estimating life expectancy: cohort life tables and period life tables. Cohort life tables present the expectedmortality experience of a particular birth cohort, such as the one born in 1930, while period life tables present what wouldhappen to a hypothetical cohort if it experienced the mortality conditions of a given calendar year throughout its existence(Arias 2015). Period life tables are used to construct the estimates of life expectancy that are most commonly reported.Finally, it is important to recognize that both life expectancy and mortality are always calculated on a forward-looking basis,assuming that the individual has lived to a particular age. Life expectancy at birth is an estimate of the average years remainingfor a newborn, while life expectancy at age 75 is an estimate of the average years remaining for a 75-year-old. Suppose thatlife expectancy at birth is 80 years, while life expectancy at age 75 is 15 years. These estimates are entirely consistent with oneanother: someone who lives to 75 has already been fortunate in living that long, and has a substantially better chance of makingit to (say) 90 than the same person had at birth, when it was still uncertain whether the person would die at an early age.2The Changing Landscape of American Life Expectancy
FIGURE 1.Life expectancy at birth (years)U.S. Life Expectancy, 1900–201490Women80Men7060504030190019101920First continuouswater chlorination19301940FirstDiphtheriavaccine sulpha drugintroduced introducedInfluenza Penicillinpandemic discoveredof 191819501960Landmarksmoking report fromU.S. Surgeon GeneralPenicillin entersmass production19701980199020002010First antiretroviralfor HIV-1/AIDSintroducedMMR vaccinedeveloped andWar on DrugsdeclaredPasteurized milkordinanceSource: Arias 2015; Costa 2015.In addition, a host of public health actions improved healthand limited infectious disease: clean water, sanitation, andbehavioral changes all played important roles. For example,Cutler and Miller (2005) estimate that nearly half of the totalmortality reduction for major U.S. cities from 1900 to 1936can be attributed to the introduction of water filtration andchlorination. Ferrie and Troesken (2005) find similar resultsfor the city of Chicago and the introduction of pure water.Campaigns to improve individuals’ hygiene practices (e.g., handand food washing) may also have had an effect (Ewbank andPreston 1990). More recently, public health campaigns aimed atreducing smoking and encouraging seatbelt use have reducedmortality rates (Hornik 2002; Hu, Sung, and Keeler 1995).It is unsurprising that life expectancy gains continue to accrueto ever-younger cohorts: these individuals have benefited fromtechnological and economic progress for more of their lives.Better nutrition, higher-quality education, reduced violence,and medical innovations, among other improvements, increasewell-being and reduce the risk of death at every age. Theseimprovements accumulate over time, both mechanically(because young people benefit from a wider range ofimprovements than do older people) and physiologically (asyoung people age, they become healthier old people than theircounterparts in previous cohorts were). In recent decades,healthy life expectancy has increased, in large part due toimproving medical treatment (Chernew et al. 2016).Medical innovations were not the only source of gains in lifeexpectancy. Improvements in nutrition that came alongsiderising real incomes, and that were aided by antipovertyprograms such as the Food Stamp Program allowed manypeople to fight off diseases that would otherwise have resultedin death (Fogel 1994; Hoynes, Schanzenbach, and Almond2016). In figure 1 the most visible shock to life expectancyis associated with the 1918 influenza pandemic, known asthe Spanish flu. One possible explanation for the lack ofrecurrences of disease with such visible mortality effects isthe improved nutrition of the population at large, given thatmalnutrition is an important factor in the risk of dying frominfluenza (Katona and Katona-Apte 2008).The Hamilton Project Brookings3
FIGURE 2.Expected Age at Death for 40-Year-Olds, by Household Income 060708090100Income percentileSource: Chetty et al. 2016.Note: Sample pools individuals who turn 40 during the period 2001–14.years—15 years longer. Women live longer at every incomelevel than men. While the life expectancy gains associated withadditional income are smaller for women than for men, womenwith household incomes in the top 1 percent are nonethelessexpected to live a decade longer than women with householdincomes in the bottom 1 percent.INCOME IS A STRONG PREDICTOR OF LIFEEXPECTANCYPeople with higher incomes have longer life expectancies thando people who have lower incomes. Figure 2, drawn fromChetty et al. (2016), plots expected age at death for 40-yearolds with differing levels of income. Among both men andwomen, persons with higher incomes have longer remaininglife expectancies than those with lower incomes. For example,40-year-old men with incomes in the bottom 1 percent havean expected age at death of 72 years, while those with incomesin the top 1 percent have an expected age at death of 87The life-expectancy advantage for those with higher incomeshas increased over time. As shown in figure 3, high-incomeindividuals have seen strong gains in life expectancy over thepast several decades, while those with lower incomes havehad flat or declining life expectancies.2FIGURE 3.Expected Age at Death for Men and Women, by Income, 1980 and cond1980MiddleWomenFourth2010TopSource: National Academy of Sciences 2015.Note: Expected age at death is conditional on reaching age 50 (i.e., an age of 88.8 represents a life expectancy of 38.8 years at age 50). Income is measured as lifetime average nonzeroearnings reported to Social Security between ages 41 and 50.4The Changing Landscape of American Life Expectancy
BOX 2.Geographic Variation in Life ExpectancyRecent research has shown that life expectancy varies widely across geographic locations, with especially large differencesamong Americans at the bottom of the income distribution (Chetty et al. 2016). For example, the life expectancy of a manreporting income in the bottom quartile was five years shorter in a so-called commuting zone (a particular definition ofgeographic area) with the lowest longevity compared with that of a man reporting income in the bottom quartile in an areawith the highest longevity. Chetty et al. examined geographic factors that might be expected to affect the life expectancyof those with the lowest incomes: access to medical care, environmental factors, income inequality, and labor marketconditions. These factors were surprisingly uncorrelated with differences in life expectancy across areas, with the exceptionof smoking rates, which were correlated with geographic differences in life expectancy among those with incomes in thebottom quartile. In terms of geographic factors, Chetty et al. concluded, “Low-income individuals tend to live longest (andhave more healthful behaviors) in cities with highly educated populations, high incomes, and high levels of governmentexpenditures, such as New York, New York, and San Francisco, California” (Chetty et al., E15).Box figure 1 uses Chetty et al.’s (2016) data to show the expected age at death for men, by household income percentile, forfour geographic areas that contain major cities. Notably, those with low incomes in New York City fare much better thantheir counterparts in Detroit, while life expectancy for those at the top of the income distribution exhibits much less variationacross locations.This research suggests that there remains much we do not know about determinants of life expectancy for low-income menand women. Further research will help illuminate the local factors that affect life expectancy, as well as the place-basedstrategies that could help struggling populations.BOX FIGURE 1.Expected Age at Death among Men by Household Income Percentile in SelectedCommuting Zones8682New YorkSan Francisco78Washington, DC74Detroit700102030405060708090100Household income percentileSource: Chetty et al. 2016.Note: Sample pools men who turn 40 during the period 2001–14. Cities in the figure refer to commuting zones that includeadjacent counties as defined by commuting patterns, in addition to urban cores. (Commuting zones are similar to metropolitanstatistical areas, but may cover rural areas as well.)The Hamilton Project Brookings5
A DIVERGENCE IN LIFE EXPECTANCYMany drivers of improved mortality—for example, moreeffective medical treatments, safer cars, and smoking cessation—are first adopted by higher-income people, and later by thebroader population. In fact, variation in the use of technologyand behavioral changes helps explain some of the divergence inlife expectancy across income groups and age cohorts.The most quantitatively significant improvements in lifeexpectancy have generally been experienced by peoplethroughout the income distribution. Inexpensive medicalinnovations like vaccines and mass-produced antibiotics, as wellas public goods like clean water and sanitation, were eventuallyextended broadly. Other factors that affect life expectancy,such as smoking behavior, have yet to change for the entirepopulation. Figures 4A and 4B use data from the NationalSurvey on Drug Use and Health to show several importantpatterns in smoking from 2000 through 2013.3 First, amongmen, older cohorts had much higher rates of smoking than didyounger cohorts. Second, the decline in smoking among theolder cohorts occurred first among higher-income individualsbefore extending to those with lower incomes. In other words,high-income Americans reduced their smoking behavior morequickly than did low-income Americans. Perhaps surprisingly,lower-income women past age 50 actually increased their rate ofsmoking. Third, younger people at all income levels have beenreducing their smoking from 2000 to 2013. Because of the timelag between smoking and its effect on mortality, it takes decadesfor declines in smoking among young adults to become apparentin reduced mortality rates. The fact that higher-income groupsquit smoking earlier likely explains some of the divergence in lifeexpectancy by income. In the future, however, we should expectto see broader impacts of smoking cessation on mortality.As has been widely reported, Case and Deaton (2015) documentthat the decline in mortality rates among middle-aged whiteshas unexpectedly stalled. As shown in figure 5B, at the sametime that there was an increase in mortality rates amongmiddle-aged white non-Hispanics, there were sharp declinesin mortality rates among middle-aged blacks—from 800 tofewer than 600 deaths per 100,000. Middle-aged Hispanics alsoexperienced steady declines in mortality from 1999 to 2014. Theincrease in mortality among whites appears to have been drivenlargely by increases in mortality for those with little education,and appears to be associated with changing rates of drug andalcohol abuse as well as mental illness and suicide (Case andDeaton 2015). As shown in figure 5A, although lung cancerdeaths fell and diabetes deaths rose only slightly, deaths fromsuicide, alcohol, and drug-use rose sharply. In 2014 the rate ofsuicide among white Americans age 45–54 actually surpassedthe rate of mortality from lung cancer, reflecting both worseningsuicide rates and falling smoking rates.Suicide mortality is related to means—fatal suicide attempts arehighly correlated with having access to a firearm (Miller, Azrael,and Barber 2012). The majority of deaths from suicides—andhomicides—are from firearms (Grinshteyn and HemenwayBOX 3.What Is a Public Good?Most goods and services—and most activities that people engage in—are a matter of concern only for the people engaged in thetransaction. That is, virtually all the costs and benefits associated with the transaction are experienced by the buyer and sellerthemselves. For instance, when an electrician fixes some wiring in a house, the consumer and the professional experience thecosts and benefits: the payment, the utility from having a working light fixture, the opportunity cost of the time spent fixing thewiring, and so on.By contrast, there are goods and services that create significant costs or benefits for third parties: individuals who are not at allinvolved in the transaction. A classic example of a public good is vaccination. When one person is vaccinated, that person becomesmuch less likely to catch and pass on the disease to others. This constitutes a positive spillover—also known as an externality—ofthe transaction to third parties. Note that a public good can also have the reverse structure. If a transaction produces a negativespillover for a third party, then minimizing the number of such transactions is a public good. The classic example here is industrialpollution: producing energy from fossil fuels has costs and benefits to the consumer and energy producer, but it also has negativespillovers in the form of public and environmental health risks related to particulate matter and carbon emissions.With both types of public good, economists typically expect that the market will settle on the “wrong” quantity of transactions,viewed from a social perspective. Because they do not experience all the costs of air pollution, industries will pollute too much;similarly, too few people will pay the cost of vaccination, given that they do not receive all the social benefits conferred byvaccination. Public goods therefore offer an opportunity for government interventions to improve on a private market outcome,usually by imposing a tax or offering a subsidy that allows market participants to take account of the spillovers to third parties.6The Changing Landscape of American Life Expectancy
FIGURE 4A.FIGURE 4B.Men Who Have Ever Smoked by Age andIncomeWomen Who Have Ever Smoked by Age andIncome70%Share of populationLow income, age 50 60%Low income, age 26–49Low income, age 26–4950%Low income, age 50 High income, age 50 40%High income, age 26–49High income, age 50 High income, age 2006200820102012Source: National Survey on Drug Use and Health 1999–2014.Note: Smoking is defined as having ever smoked at least 100 cigarettes. Income bins are terciles of family income for the entire sample, and thesample is restricted to individuals age 26 and older.FIGURE 5A.FIGURE 5B.Mortality by Cause, White Non-HispanicsAge 45–54Mortality, Age 45–541000100035 35LungLungCancerCancerPoisoningPoisoning30 30Deaths per 100,000Deaths per 100,00025 2520 cide15 15DiabetesDiabetes10 10Deaths per 100,000Deaths per 100,000800 800BlackBlack600 600WhiteWhitenon-Hispanicnon-Hispanic400 400HispanicHispanic200 200505019991999200420042009200920142014Source: CDC 1999–2014.Note: Figure is adapted from Case and Deaton (2015) figure 2. Chronic liver diseasesinclude alcoholic liver diseases and cirrhosis. Poisonings include drug and alcoholpoisoning, both accidental and with undetermined intent.0019991999200420042009200920142014Source: Centers for Disease Control and Prevention1999–2014.Note: Mortality data are for all-cause mortality. Figure isadapted from Case and Deaton (2015) figure 1.The Hamilton Project Brookings7
2016). Research has found that firearm ownership and suiciderates are robustly correlated (Hemenway 2014) even afteraccounting for rates of antidepressant prescriptions (Opoliner etal. 2014). Firearms are lethal in other scenarios: more than 100children are accidentally killed with a firearm every year in theUnited States, most of them by other children (Hemenway andSolnick 2015). Means restriction policies—a variety of measuresthat include things like erecting suicide-prevention barrierson bridges and restricting access to firearms—are effective inreducing rates of preventable death (Mann et al. 2005; Yip et al.2012).Given that Americans with low incomes have seen stagnatingor declining life expectancy, it is worth investigating howthe link between income and substance use has changedover time. In figures 6A and 6B we again use data fromthe National Survey on Drug Use and Health, this time toexamine recent changes in the rate of drug and alcohol abuseby income group. Interestingly, heavy drinking has becomemore common at all income levels; by contrast, use of illegaldrugs, excluding marijuana, has become more commonfor those with low incomes, while high-income men haveexperienced smaller increases.The recent trends have caused many to speculate about apossible link between labor market changes and the factorsthat have depressed life expectancy for lower-income people.The stagnation in real wages at lower percentiles, andincreasing real wages at upper percentiles (Bivens et al. 2014)would seem to correspond to the observed divergence in lifeexpectancy. Concurrent with this increasing wage inequalityis an increasing pessimism about future economic conditions(Uslaner 2012). Perhaps the bleak economic outlook, real orperceived, for low-income and lesser-educated workers hasled to problems—related to mental health, alcohol abuse, anddrug abuse—that depress longevity.The trends in life expectancy do not entirely align with thishypothesis, however. Life expectancy for those with highincomes diverged from life expectancy for those with lowerincomes in both the male and female populations over the past35 years, yet the labor market fortunes of men and women haveevolved differently over that period. While men—aside frommen with at least a college degree—have suffered stagnant ordeclining incomes, women have been more likely to experiencelabor market gains. Household income was roughly constant forlow-income women from 1980 to 2010 while household incomedropped considerably for low-income men (Current PopulationSurvey March Supplement and THP calculations). If labormarket stagnation was an important driver of deteriorating lifeexpectancy among those with low incomes, we might expectto see men suffering more than women. Instead, as we see inFIGURE 6A.FIGURE 6B.Illegal Drug Use and Heavy Drinkingamong Men Age 26–49, by IncomeIllegal Drug Use and Heavy Drinkingamong Men Age 50 and Older, by Income24%24%12%12%12%12%LowLowincomeincome16%16%8% 8%IllegalIllegaldrugdruguse use(dashed(dashedline)line)12%12%6% 6%LowLowincomeincome8% 8%4% 4%HighHighincomeincome4% 4%2% 2%0% 0%0% 2011201120132013Heavy drinking (share of population)Heavy drinking (share of population)Heavy drinking (share of population)Heavy drinking (share of population)10%10%HighHighincomeincome10%10%8% 8%3.0%3.0%2.4%2.4%IllegalIllegaldrugdruguse use(dashed(dashedline)line)LowLowincomeincome6% 6%1.8%1.8%LowLowincomeincome4% 4%1.2%1.2%HighHighincomeincome2% 2%Note: Illegal drug use refers to the use of hallucinogens, cocaine, or inhalants on three or more days in the past year, the use of heroin in the past year, or theuse of prescription drugs—sedatives, tranquilizers, stimulants, or analgesics (i.e., pain killers)—on three or more days for nonmedical reasons in the pastyear. By definition, this excludes any use of marijuana. Heavy drinking is defined as drinking five or more drinks on the same occasion on three or more daysin the past 30 days. Income bins are inflation-adjusted terciles of family income for the entire sample. The sample is restricted to individuals age 26 and older.The Changing Landscape of American Life Expectancy0.6%0.6%0% 200920092011201120132013Source: National Survey of Drug Use and Health 1998–2014.8Illegal drug use (share of population)Illegal drug use (share of population)Illegal drug use (share of population)Illegal drug use (share of avydrinkingdrinking(solid(solidline)line)
figure 3, life expectancy for the bottom quintile of women fallsconsiderably more than the bottom quintile of men.Moreover, the labor market stagnation narrative is difficultto square with other aspects of mortality trends in recentdecades. Currie and Schwandt (2016) find that mortalityrates for black Americans have fallen dramatically, and thatmortality inequality among children has also fallen, all whileincome inequality has been increasing. Appendix figure 1reproduces some of Currie and Schwandt’s findings, showingthat increasing inequality in mortality and life expectancy isrestricted to the population age 50 and above. The authorsargue that investments in health care for pregnant womenand children, changing smoking behavior, and other factorsmay be important for understanding divergences in mortalityand life expectancy.In understanding the economic determinants of mortality, itis helpful to distinguish three types of mortality effects: (1)the effect of poverty amelioration, (2) the effect of incomestagnation, and (3) the effect of increasing income inequality.First, there is considerable evidence that poverty amelioration(at both the family and community levels) causally improveshealth and, by implication, life expectancy. For instance,nutrition assistance (Hoynes, Schanzenbach, and Almond2016), the Earned Income Tax Credit (Hoynes, Miller, andSimon 2015), and relocation to lower-poverty neighborhoods(Chetty, Hendren, and Katz 2016) all have been shown toimprove health. Other policies aimed at poverty reduction—the minimum wage, for example—may have similar impacts.The mortality effect of recent U.S. income stagnation formany workers is much less clear. While it is certain that highincome workers live longer than low-income workers, it isnot obvious that recent changes in income for those abovethe poverty level are having an effect on mortality. Finally,researchers have generally concluded that mortality is notimportantly affected by increasing income inequality (Deaton2003), though again, poverty itself is quite important.Protecting Life Expectancy Gains forEveryoneThe policies that can help ensure future life expectancy gainsfall into two categories: (1) those that expand participationin technological advances contributing to longer lifespans, and (2) those that address social factors relevant tolife expectancy. Often these factors go hand in hand. Forexample, one enduring problem in medicine—mentionedby Hippocrates around 400 BC (Hugtenburg et al. 2013)—isthat medication cannot help the patient who does not takeit (Ho et al. 2006; Bailey et al. 2010). Differential rates ofmedical adherence (e.g., by race) may be related to disparitiesin mortality (Wu et al. 2010). Evolving technologies, such asautomatic text messages to patients to remind them to taketheir medications (Granger and Bosworth 2011), provide anavenue for further progress.IMPROVING PARTICIPATION IN TECHNOLOGICALADVANCESInvestments in clean water infrastructure contributedimportantly to life expectancy improvements before andduring the 20th century. Opportunities exist to consolidateand extend these improvements. The recent crisis in Flint,Michigan—centering on toxic levels of lead in the drinkingwater—underscored the importance of this infrastructureand the continuing problems with delivering clean water tohouseholds (Simon and Sidner 2016). Research has exploredthe sometimes subtle yet damaging effects of lead exposurefor children, as well as the role that public policy has playedin both creating and resolving this problem (Troesken 2006).As with clean water infrastructure, the benefits of antibioticsand vaccines are now largely taken for granted. However,with falling rates of vaccination in some locations (Lee,Rosenthal, and Scheffler 2013) and increasing rates of drugresistant bacteria (Andersson 2003)—including the firstcolistin-resistant bacteria in the United States (McGann etal. 2016)—protecting the modern victory over infectiousdisease has becom
dramatic: 15-year-olds in 1900 could expect to live 46.8 more years, whereas their counterparts in 2000 could expect to live 62.6 more years, an increase of almost 16 years. At the older end of the age distribution, 60-year-olds in 1900 and 2000 could expect to live 14.8 years and 21.6 mo