Transcription
Johnson Rice 2017 Energy ConferenceSeptember 26-27, 2017NYSE: DNRwww.denbury.com NYSE: DNRwww.denbury.com1
Cautionary StatementsForward-Looking Statements: The data and/or statements contained in this presentation that are not historical facts are forward-looking statements, as that term is defined in Section 21E of the Securities Exchange Act of 1934, as amended,that involve a number of risks and uncertainties. Such forward-looking statements may be or may concern, among other things, financial forecasts, future hydrocarbon prices and timing and degree of any price recovery versus the length orseverity of the current commodity price downturn, current or future liquidity sources or their adequacy to support our anticipated future activities, our ability to further reduce our debt levels, possible future write-downs of oil and natural gasreserves, together with assumptions based on current and projected oil and gas prices and oilfield costs, current or future expectations or estimations of our cash flows, availability of capital, borrowing capacity, future interest rates, availabilityof advantageous commodity derivative contracts or the predicted cash flow benefits therefrom, forecasted capital expenditures, drilling activity or methods, including the timing and location thereof, closing of proposed asset sales or thetiming or proceeds thereof, estimated timing of commencement of carbon dioxide (CO2) flooding of particular fields or areas, likelihood of completion of to-be-constructed industrial plants and the initial date of capture of CO2 from suchplants, timing of CO2 injections and initial production responses in tertiary flooding projects, acquisition plans and proposals and dispositions, development activities, finding costs, anticipated future cost savings, capital budgets, interpretationor prediction of formation details, production rates and volumes or forecasts thereof, hydrocarbon reserve quantities and values, CO2 reserves and supply and their availability, potential reserves, barrels or percentages of recoverable originaloil in place, potential increases in regional or worldwide tariffs or other trade restrictions, the likelihood, timing and impact of increased interest rates, the impact of regulatory rulings or changes, anticipated outcomes of pending litigation,prospective legislation affecting the oil and gas industry, environmental regulations, mark-to-market values, competition, long-term forecasts of production, rates of return, estimated costs, changes in costs, future capital expenditures andoverall economics, worldwide economic conditions and other variables surrounding our estimated original oil in place, operations and future plans. Such forward-looking statements generally are accompanied by words such as “plan,”“estimate,” “expect,” “predict,” “forecast,” “to our knowledge,” “anticipate,” “projected,” “preliminary,” “should,” “assume,” “believe,” “may” or other words that convey, or are intended to convey, the uncertainty of future events oroutcomes. Such forward-looking information is based upon management’s current plans, expectations, estimates, and assumptions and is subject to a number of risks and uncertainties that could significantly and adversely affect current plans,anticipated actions, the timing of such actions and our financial condition and results of operations. As a consequence, actual results may differ materially from expectations, estimates or assumptions expressed in or implied by any forwardlooking statements made by us or on our behalf. Among the factors that could cause actual results to differ materially are fluctuations in worldwide oil prices or in U.S. oil prices and consequently in the prices received or demand for our oil andnatural gas; decisions as to production levels and/or pricing by OPEC in future periods; levels of future capital expenditures; effects of our indebtedness; success of our risk management techniques; inaccurate cost estimates; availability ofcredit in the commercial banking market, fluctuations in the prices of goods and services; the uncertainty of drilling results and reserve estimates; operating hazards and remediation costs; disruption of operations and damages from wellincidents, hurricanes, tropical storms, or forest fires; acquisition risks; requirements for capital or its availability; conditions in the worldwide financial, trade and credit markets; general economic conditions; competition; governmentregulations, including changes in tax or environmental laws or regulations; and unexpected delays, as well as the risks and uncertainties inherent in oil and gas drilling and production activities or that are otherwise discussed in this presentation,including, without limitation, the portions referenced above, and the uncertainties set forth from time to time in our other public reports, filings and public statements including, without limitation, the Company’s most recent Form 10-K.Statement Regarding Non-GAAP Financial Measures: This presentation also contains certain non-GAAP financial measures. Any non-GAAP measure included herein is accompanied by a reconciliation to the most directly comparable U.S. GAAPmeasure along with a statement on why the Company believes the measure is beneficial to investors, which statements are included at the end of this presentation.Note to U.S. Investors: Current SEC rules regarding oil and gas reserves information allow oil and gas companies to disclose in filings with the SEC not only proved reserves, but also probable and possible reserves that meet the SEC’s definitionsof such terms. We disclose only proved reserves in our filings with the SEC. Denbury’s proved reserves as of December 31, 2015 and December 31, 2016 were estimated by DeGolyer and MacNaughton, an independent petroleum engineeringfirm. In this presentation, we may make reference to probable and possible reserves, some of which have been estimated by our independent engineers and some of which have been estimated by Denbury’s internal staff of engineers. In thispresentation, we also may refer to estimates of original oil in place, resource or reserves “potential,” barrels recoverable, or other descriptions of volumes potentially recoverable, which in addition to reserves generally classifiable as probableand possible (2P and 3P reserves), include estimates of resources that do not rise to the standards for possible reserves, and which SEC guidelines strictly prohibit us from including in filings with the SEC. These estimates, as well as theestimates of probable and possible reserves, are by their nature more speculative than estimates of proved reserves and are subject to greater uncertainties, and accordingly the likelihood of recovering those reserves is subject to substantiallygreater risk.NYSE: DNRwww.denbury.com2
A Different Kind of Oil Company– Core focus: CO2 enhanced oil recovery (“CO2 EOR”)– Uniquely long-lived & lower-risk assets with extraordinary – CO2 supply and infrastructure provides our strategic advantage– “We bring old oil fields back to life!” Proved: 254 MMBOE (58% CO2 EOR, 97% Oil) Proved EOR Potential: 900 MMBOE Proved Reserves: 6.5 Tcf Plus significant quantities of industrial-sourced CO2Production2Q17 59,774 BOE/d (61% CO2 EOR, 97% Oil)CO2Pipelines 1,100 miles Nearly 2 decades of CO2 EOR Production Produced over 155 million gross barrels from CO2 EORReservesYE 2016CO2SupplyExperienceNYSE: DNRwww.denbury.comHeadquartersGulf CoastRegion3
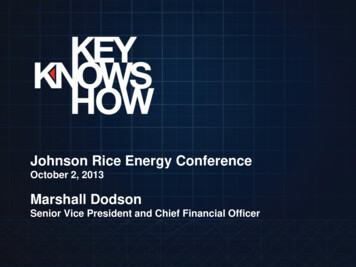
CO2 EOR ProcessCO2 Injection WellOil FormationCO2 moves through formation mixing with oil, expandingand moving it toward producing wellsNYSE: DNRCO2 EOR can produce about as much oil asprimary or secondary recovery(1)Recovery of Original Oil in Place(“OOIP”)Production WellCO2 PipelinePrimary 20%Secondary 18%(Waterfloods)CO2 EOR(Tertiary) 17%1) Based on OOIP at Denbury’s Little Creek Fieldwww.denbury.com4
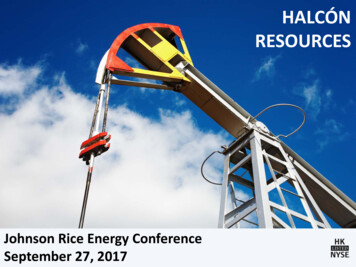
Significant Running Room with CO2 EORUp to 83 Billion Barrels of Technically Recoverable Oil – U.S Lower 48(1)(2)2.8 to 6.6Billion BarrelsMTNDRocky Mountain Region(2)33-83 Billion of TechnicallyRecoverable Oil(1,2)(amounts in billions of barrels)Permian9-21East & Central Texas6-15Mid-Continent6-13California3-7South East Gulf iston1-3Appalachia1-21)2)3)WYDenbury’s fields represent 10% of total potential(3)MSTXPlanned Denbury CO2 PipelinesDenbury owned oil fieldsLA3.7 to 9.1Existing or Proposed CO2Source Owned orContractedBillion BarrelsSource: 2013 DOE NETL Next Gen EOR.Total estimated recoveries on a gross basis utilizing CO2 EOR.Using approximate mid-points of ranges, based on a variety of recovery factors.NYSE: DNRExisting Denbury CO2 Pipelineswww.denbury.comGulf Coast Region(2)5
Gulf Coast RegionVast CO2 Supply and Distribution Capacity in Texas, Louisiana & MississippiReserves Summary(1)Tertiary E(2)22472Denbury Operated PipelinesDenbury Planned PipelinesCumulative Production15 – 50 MMBOE50 – 100 MMBOE 100 MMBOEDenbury Owned Fields – Current CO2 FloodsDenbury Owned Fields – Potential CO2 FloodsFields Owned by Others – CO2 EOR Candidates1)2)3)Proved tertiary and non-tertiary oil and natural gas reserves based uponyear-end 12/31/16 SEC pricing, plus 2 MMBbls of proved tertiaryreserves at West Yellow Creek, estimated as of 6/30/17. Potentialincludes probable and possible tertiary reserves estimated by theCompany as of 12/31/16 (with the exception of West Yellow Creek,estimated as of 3/31/17), using the mid-point of ranges, based upon avariety of recovery factors and long-term oil price assumptions, whichalso may include estimates of resources that do not rise to the standardsof possible reserves. See slide 2, “Cautionary Statements” for additionalinformation.Total reserves in this table represent total proved plus potential tertiaryreserves, using the mid-point of ranges, plus proved non-tertiaryreserves, but excluding additional potential related to non-tertiaryexploitation opportunities.Field reserves shown are estimated proved plus potential tertiaryreserves.NYSE: DNRALJackson DomeLADelhiHeidelberg(2)Houston Area(3) 100 - 200 MMBblsHastingsWebsterThompsonManvelWest Yellow Creek(3)5 -10 MMBblsTinsleyNon-Tertiary Reserves:ProvedTinsley(3)25 MMBblsDelhi(3)30 MMBOEs30 - 70 MMBbls40 - 75 MMBbls20 - 40 MMBbls8 - 12 MMBblsConroe(3)130 MMBblsMature Area(3)Martinville60 MMBblsBrookhavenCranfieldMallalieuOliveLittle CreekMcComb 90 MilesCost: 220MMLockhartCrossingSosoYellow CreekEucuttaCitronelleMSHeidelberg(3)30 MMBblsConroeGreen Pipeline 325 MilesWebsterThompsonManvelHastingsOyster Bayouwww.denbury.comOyster Bayou(3)20 MMBbls6
Rocky Mountain RegionControl of CO2 Sources & Pipeline Infrastructure Provides a Strategic AdvantageReserves Summary(1)Tertiary Reserves:Proved36Potential349Non-Tertiary Reserves:Proved84469Total MMBOE(2)Cedar Creek AnticlineArea(3)DGC Beulah260 - 290 MMBblsMONTANAMTNDNORTH DAKOTABell Creek(3)20 - 40 MMBblsPipelines & CO2 SourcesElk BasinDenbury PipelinesDenbury Planned PipelinesPipelines Owned by OthersExisting or Proposed CO2 Source - Owned or Contracted 110 MilesCost: 150MMGas Draw(3)10 MMBblsWYGreencore Pipeline232 MilesCumulative Production15 – 50 MMBOE50 – 100 MMBOE 100 MMBOE 250 MilesCost: 400MMDenbury Owned Fields – Current CO2 FloodsDenbury Owned Fields – Potential CO2 FloodsFields Owned by Others – CO2 EOR Candidates1) Proved tertiary and non-tertiary oil and natural gas reserves based upon yearend 12/31/16 SEC pricing, plus 17 MMBbls of proved tertiary reserves at SaltCreek, estimated as of 6/30/17. Potential includes probable and possibletertiary reserves estimated by the Company as of 12/31/16 (with the exceptionof Salt Creek, estimated as of 6/30/17), using the mid-point of ranges, basedupon a variety of recovery factors and long-term oil price assumptions, whichalso may include estimates of resources that do not rise to the standards ofpossible reserves. See slide 2, “Cautionary Statements” for additionalinformation.2) Total reserves in this table represent total proved plus potential tertiaryreserves, using the mid-point of ranges, plus proved non-tertiary reserves, butexcluding additional potential related to non-tertiary exploitationopportunities.3) Field reserves shown are estimated proved plus potential tertiary reserves.NYSE: DNRRileyRidgeLostCabin(COP)SDHartzog Draw(3)30 - 40 MMBblsSalt Creek(3)25 - 35 MMBblsShuteCreek(XOM)Grieve(3)5 MMBblswww.denbury.comNE7
Realigning for Profitability and SustainabilityFocus AreasMedium-Term ExpectationsREDUCE COST STRUCTUREUNLOCK FULL VALUE OFASSET BASE Expect cost reductions 50 million in 2018Cost reductions combined with unique asset base enhance profitability Continue to hold production flat or modestly grow with 250 – 300 millionof capitalContinued expansion of existing CO2 floodsProgress Cedar Creek Anticline Development (conventional and CO2)Target multiple exploitation opportunities IMPROVE BALANCE SHEETNYSE: DNR Maintain significant liquidity under bank line and work to extend maturitybeyond December 2019Pursue opportunities to improve balance sheet and liquidityNon-productive acreage sales targeted within the next 12 monthswww.denbury.com8
2017 Capital Budget & Production UpdateRecent 2017 Capital Budget UpdateREVISED DEVELOPMENT(in millions)PRODUCTION (BOE/D)(3)CAPITAL BUDGET(1) Reduced planned capital spending from 300 million to 250 million Significant revisions to capital spendinginclude: Deferred development projects atHeidelberg and Delhi fields ( 30million combined) Partially deferred exploitationactivities ( 10 million) Other minor revisions 55 10 135 50 No significant changes to planneddevelopment projects at Hastings, BellCreek, Tinsley, and Oyster Bayou fields 250 MM TotalTertiaryNon-TertiaryCO2 Sources & OtherCapitalized Items (2)Recent 2017 Production Guidance Update60,000 - 62,0002017E(Initial)2017E(Revised) 60,0002016Exit Rate Expect 2017 full-year production to be relativelyflat with 2016 exit rate, excluding acquiredproperties, on capital spending of 250 million Including acquired properties, raising guidance upto 60,000 BOE/d to 62,000 BOE/d Anticipate slight production growth for 2018based on current expectations of prices and otherassumptions1) 2017 estimated development capital budget presented excludes acquisitions and capitalized interest. 2017 capitalized interest currently estimated at 25- 35 million.2) Includes capitalized internal acquisition, exploration and development costs and pre-production tertiary startup costs.3) 2017 production guidance currently excludes any impact of shut-in production associated with Tropical Storm Harvey.NYSE: DNR58,000 - 62,000www.denbury.com9
Hastings Redevelopment ProjectIncreased production by 1,700 Bbls/d (gross) on capital spend of 26 MM8,000Gross Oil Production ell5,000CURRENTProductionWellsCO2CO24,0005/135/20 5/27 6/3 6/106/17 6/24 7/1 7/87/15 7/22 7/29 8/5May-17Jun-17Jul-17InjectionWellsRedevelopment Benefits Better sweep efficiency using top-down injection Dedicated producers drive higher overall flow rates More efficient CO2 useSimultaneous series – dedicated producer and injector per reservoir Balanced injection and withdrawal Higher processing rates and greater flood controlSimultaneous – multiple reservoirs per wellbore High quality reservoir dominates flowNYSE: DNRUp 1,700 Bbls/dwww.denbury.com10
Bell Creek Phases 5 & 6 DevelopmentPhases 5 & 6 have the best geological properties of the Bell Creek floodLarger EOR target than first four phases combinedIncreased pattern spacing improves capital efficiencyPhase 5 On schedule for September 2017 completion and under budget ( 16MM) Development costs 5/Bbl First production response expected by end of 2017 Anticipated IRR 50% @ 50/bbl oilTest site for phase 5Phase 6 Construction scheduled to begin in 2018 as a continuation of Phase 5developmentBell Creek DevelopmentBell CreekField PhasesExisting Development (phases 1-4)GeologicalPropertiesNYSE: DNRwww.denbury.com31Planned 2017 & 2018 DevelopmentFuture Development Potential792654811
Cedar Creek Anticline – Mission CanyonHigh Value Exploitation OpportunityHorizontal wells targetingupper portion of MissionCanyonMission CanyonInterlakeRed RiverNYSE: DNRwww.denbury.comCurrentproducingintervals Low-cost horizontal well developmentunlocks 6 MMBOE resource potential over9,000 acres within existing Cedar CreekAnticline units Target the upper portion of Mission Canyoninterval at 7,100 ft High quality reservoir does not requirehydraulic fracture stimulation Established production from vertical wellswith less than 1% OOIP recovered to date First well expected to spud in October 2017 Drill & complete costs 3MM IRR 50% @ 50/bbl oil12
Abundant CO2 Supply & No Significant Capital Required for Several YearsRocky Mountain CO2 SupplyGulf Coast CO2 SupplyJackson DomeLaBarge Area– Proved CO2 reserves as of 12/31/16: 5.3 Tcf(1)– Additional probable CO2 reserves as of 12/31/16: 1.2 Tcf– Currently producing at less than 60% of capacityIndustrial-Sourced CO2Current Sources– Air Products (hydrogen plant): 45 MMcf/d– PCS Nitrogen (ammonia products): 20 MMcf/dFuture Potential Sources– Mississippi Power (power plant)(2)– Lake Charles Methanol (methanol plant)(3)1)2)3)– Estimated field size: 750 square miles– Estimated recoverable CO2: 100 TcfShute Creek - ExxonMobil Operated Proved reserves as of 12/31/16: 1.2 Tcf Denbury has a 1/3 overriding royalty interest andcould receive up to 115 MMcf/d of CO2 by 2021 atcurrent plant capacityRiley Ridge – Denbury Operated Future potential source of CO2: 2.8 Tcf Gas processing facility shut-in since mid-2014 due tofacility issues and sulfur build-up in gas supply wells Evaluation of issues and corrective options ongoingLost Cabin – ConocoPhillips Operated– Denbury could receive up to 40 MMcf/d of CO2 atcurrent plant capacityReported on a gross (8/8th’s) basis.Future delivery of CO2 from this facility is uncertain pending further evaluation by Mississippi Power of the costs to fix and maintain the lignite coal gasification and CO2 capture portion of the facility.Planned but not currently under construction. Estimated CO2 capture date could be as early as 2021, with estimated potential CO2 volumes 200 MMcf/d.NYSE: DNRwww.denbury.com13
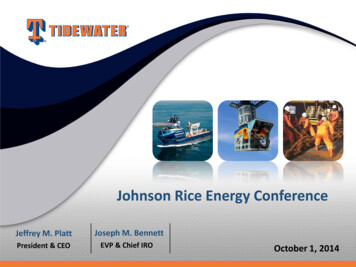
1,00097976280060067870563482%459Jackson Dome CO240045854557660876%200-18%1Q15Industrial-sourced CO22Q153Q1524%4Q151Q162Q163Q164Q161Q172Q17CO2 Costs per BOE 4.00 3.00 0.50 0.403.032.71 2.002.702.171.972.132.172.402.862.36 1.00 0.20 0.10 1Q15NYSE: DNR 0.302Q153Q154Q15(1) -1Q162Q161) CO2 costs in 4Q15 include workovers carried out at Jackson Dome of 3 million, or 0.46 per BOE.www.denbury.com3Q164Q161Q172Q1714CO2 Costs per Mcf of CO2Total Company Injected Volumes(MMcf/d)CO2 Utilization & Cost Summary
Debt & YTD Change in Bank Credit Facility in millions. Balances as of 6/30/2017Ample Liquidity& No Near-TermMaturitiesMaturity DateBorrowing Base 1,050UndrawnAvailabilityLC’s 498Drawn 49020172018Bank Credit Facility: 773 615 2159%2019Sr. Secured Bank Credit Facility 62220206.375%20212021Sr. Secured Second Lien Notes5.50%4.625%20222023 498 million of borrowingbase availabilityas of 6/30/17 No near-term covenantconcerns at current strippricesSr. Subordinated Notes 425 - 475 in millionsChange inBank CreditFacility12/31/16Bank FacilityEnding Balance1)Adjusted CashFlow tions ofOil and NaturalGas PropertiesRepayment ofNon-Bank DebtChanges inWorking Capital& OtherCash flow from operations before working capital changes (a non-GAAP measure). See press release attached as Exhibit 99.1 to the Form 8-K filed August 8, 2017 for additionalinformation, as well as slide 30 indicating why the Company believes this non-GAAP measure is useful for investors.NYSE: DNRwww.denbury.com6/30/17Bank FacilityEnding BalanceYE2017Bank FacilityEstimated EndingBalance15
Oil Hedge ProtectionDetail as of September 22, 2017Jul-17Aug-17Sep-174Q172018Volumes Hedged (Bbls/d)–3,75010,00012,00015,500Swap Price(1)– 49.20 49.73 49.76 50.13WTI NYMEXCollarsVolumes Hedged (Bbls/d)–––1,000–Floor/Ceiling Price(1)––– 40/ 70–WTI NYMEX3-Way CollarsVolumes Hedged (Bbls/d)14,50014,50014,50014,00015,000 30/ 40/ 69.09 30/ 40/ 69.09 30/ 40/ 69.092,0002,0002,0001,000– 31/ 41/ 69.25 31/ 41/ 69.25 31/ 41/ 69.25 31/ 41/ WTI NYMEXFixed-PriceSwapsArgus LLS3-Way CollarsSold Put Price/Floor/Ceiling Price(1)(2)Volumes Hedged (Bbls/d)Sold Put Price/Floor/Ceiling Price(1)(2)Total Volumes Hedged 31.07/ 41.07/ 65.79 36.50/ 46.50/ 53.881) Averages are volume weighted.2) If oil prices were to average less than the sold put price, receipts on settlement would be limited to the difference between the floor price and sold put price.NYSE: DNRwww.denbury.com16
Key TakeawaysLookingAheadOurAdvantagesNYSE: DNR Reduce cost structure Unlock full value of asset base Improve balance sheet Long-Term Visibility– Low decline, long-lived and low risk assets– Tremendous resource potential Capital Flexibility– Relatively low capital intensity– Adaptable to the oil price environment Competitive Advantages– Large inventory of oil fields– Strategic CO2 supply and over 1,100 miles of CO2 pipelineswww.denbury.com17
Appendix
CO2 EOR is a Proven ProcessSignificant CO2 Supply by RegionGulf Coast Region» Jackson Dome, MS (Denbury Resources)» Air Products (Denbury Resources)» PCS Nitrogen (Denbury Resources)» Mississippi Power (Denbury Resources)(2)» Petra Nova (Hilcorp)Permian Basin Region» Bravo Dome, NM (Kinder Morgan, Occidental)» McElmo Dome, CO (ExxonMobil, Kinder Morgan)» Sheep Mountain, CO (ExxonMobil, Occidental)Rocky Mountain Region» LaBarge, WY (ExxonMobil, Denbury Resources)» Lost Cabin, WY (ConocoPhillips)Canada» Dakota Gasification (Cenovus, Apache)NYSE: DNR300250MBbls/dSignificant CO2 EOR Operators by RegionGulf Coast Region» Denbury ResourcesPermian Basin Region» Occidental» Kinder MorganRocky Mountain Region» Denbury Resources» FDL» Devon» ChevronCanada» Cenovus» Apache200CO2 EOR Oil Production by Region(1)Gulf Coast/OtherMid-ContinentRocky MountainsPermian Basin1501005001986 1988 1990 1992 1994 1996 1998 2000 2002 2004 2006 2008 2010 2012 2014DGCLost CabinLaBargeMcElmo DomeSheep MountainBravo DomeMS Power(2)Jackson DomeNaturally Occurring CO2 SourceIndustrial-Sourced CO2www.denbury.comPCS NitrogenAir ProductsPetra Nova1)2)Source: Advanced Resources InternationalStartup and operation activities currently suspended19
Examples of Significant Development OpportunitiesRocky MountainGulf CoastHastings, TX Remaining development inthree major fault blocks Roughly 30% of total EORtarget to be developedDelhi, LA Two of six test sitesremaining for development Additional verticalconformance work inTuscaloosaDelhiHeidelberg, MS Realignment of ChristmasRed flood New developments ofChristmas Yellow andBrown reservoirsBell Creek, MT Four of nine phasesleft to be developed Vertical Conformanceprojects with originalphasesHartzog Draw, WY Multiple Shannonunconventional targetsHeidelbergBell CreekCHSU, ND Multi-lateral infillprojects Additional waterflooddevelopmentpatternsCedar HillsSouth UnitHastingsHartzog DrawNYSE: DNRwww.denbury.com20
Building Scale in Our Core Operating AreasSalt CreekRocky MountainRegionSalt CreekWYWest YellowCreekGulf CoastRegionNYSE: DNRProved reserves: 17 MMBblsProved potential reserves: 25-35 MMBblsCurrent production: slightly above 2,000 Bbls/dAcquisition cost: 71.5 million (before closingadjustments) Accretive to near-term credit metrics based on2018 estimated cash flow Minimal capital spend anticipated for 2017 &2018 MSWest Yellow Creek Proved reserves: 2 MMBblsProved potential reserves: 5 MMBblsFirst production: est. late 2017 or early 2018Acquisition cost: 16 millionEstimated 2017 capital: 10 millionContract for Denbury to sell CO2 to theoperator, providing additional cash flowwww.denbury.comCombined Proved reserve additionslargely replace Denbury’sfull-year 2017 production All-in F&D costs, includingacquisition costs, estimatedat 7/Bbl Estimated 2018 productionof 3,000 – 3,500 Bbls/d Initially funded by bankline; potential to offsetwith sale of non-productivesurface acreage in Houstonarea21
Senior Secured Bank Credit Facility InfoCommitments & borrowing base 1.05 billionScheduled redeterminationsSemi-annually – May 1st and November 1stMaturity dateDecember 9, 2019Permitted bond repurchasesUp to 225 million of bond repurchases ( 148 million remaining as of 6/30/17)Junior lien debtAllows for the incurrence of up to 1 billion of junior lien debt (subject to customaryrequirements) ( 385 million remaining as of 6/30/17)Anti-hoarding provisionsIf 250 million borrowed, unrestricted cash held in accounts is limited to 225 millionPricing gridUtilization BasedX 90% 75% X 90% 50% X 75% 25% X 50%X 25%Libor margin (bps)350325300275250ABR margin (bps)250225200175150Undrawn pricing (bps)50505050502018Financial Performance CovenantsSenior secured debt(1) to EBITDAX (max)1)2017Q1Q2Q33.0xQ420192.5xEBITDAX to interest charges (min)1.25xCurrent ratio (min)1.0xBased solely on bank debt.NYSE: DNRwww.denbury.com22
Production by AreaAverage Daily Production 5,0004,9245,1284,7304,996Oyster 11Bell 37,19937,34638,54837,07036,709Gulf Coast 706,466Cedar Creek 215,06715,124Other Rockies 261,475Total non-tertiary 5022,86323,065Total continuing 9,774Mature area(1)Salt Creek(2)Total tertiary production2016 property divestituresTotal production1Q162Q163Q161) NYSE:MatureDNRarea includes Brookhaven, Cranfield, Eucutta, Little Creek, Lockhart Crossing, Mallalieu, Martinville,McComb, and Soso fields.www.denbury.com4Q1620161Q172Q1723
NYMEX Oil Differential SummaryCrude Oil Differentials per barrel201420151Q162Q163Q164Q1620161Q172Q17Tertiary Oil FieldsGulf Coast RegionRocky Mountain RegionNYSE: DNR 2.11 0.60 (1.95) (0.98) (0.82) (0.81) (1.35) (1.58) 1.74)(1.75)Gulf Coast .89)(0.42)0.59Cedar Creek )(2.08)(1.93)Other Rockies 8.63)(3.41)(3.20)Denbury Totals (2.21) (1.55) (3.02) (2.18) (1.57) (1.22) (2.29) (1.64) (1.16)www.denbury.com24
Analysis of Total Operating CostsTotal Operating Costs /BOE2014CO2 Costs20151Q162Q163Q164Q1620161Q172Q17 3.79 2.66 1.97 2.13 2.17 2.40 2.16 2.86 2.36Power & Fuel5.935.595.265.025.395.535.295.936.04Labor & s & 0.921.051.050.880.971.231.09 24.10 19.81 16.23 17.04 18.23 18.98 17.56 21.11 �0.59—0.15—— 23.84 19.37 16.23 17.04 18.82 18.98 17.71 21.11 20.46Total Normalized LOE(1)Special or Unusual Items(2)Thompson Field Repair Costs(3)Total LOE1)2)3)Oil PricingNYMEX Oil Price 92.95 48.85 33.73 45.56 45.02 49.25 43.41 51.95 48.32Realized Oil Price(4) 90.74 47.30 30.71 43.38 43.45 48.03 41.12 50.31 47.16NYSE: DNRwww.denbury.com4)Normalized LOE excludesspecial or unusual items andThompson Field repair costs(see footnote 2 and 3below), but includes 12MMof workover expenses atRiley Ridge during 2014.Special or unusual itemsconsist of Delhi remediationcharges, net of insurancereimbursements ( 7MM) in2014, and a reimbursementfor a retroactive utility rateadjustment ( 10MM) and aninsurance reimbursementfor previous well controlcosts ( 4MM), both in 2015.Represents repair costs toreturn Thompson Field toproduction followingweather-related flooding in2Q16 and 2Q15.Excludes derivativesettlements.25
Analysis of Tertiary Operating CostsTertiary Operating Costs /Bbl201420151Q162Q163Q164Q1620161Q172Q17 6.87 4.65 3.38 3.51 3.59 3.89 3.59 4.62 3.84Power & Fuel7.466.725.985.626.086.155.966.526.61Labor & s & 0.470.500.310.340.390.390.30 25.68 20.77 16.89 17.68 18.07 19.04 17.90 20.88 20.13(0.47)(0.90)——————— 25.21 19.87 16.89 17.68 18.07 19.04 17.90 20.88 20.13NYMEX Oil Price 92.95 48.85 33.73 45.56 45.02 49.25 43.41 51.95 48.32Realized Oil Price(3) 94.65 49.27 31.70 44.46 44.11 48.35 41.99 50.35 47.25CO2 CostsTotal Normalized LOE(1)Special or Unusual Items(2)Total LOE1)2)Oil PricingNYSE: DNRwww.denbury.com3)Normalized LOEexcludes special orunusual items. See (2)below.Special or unusualitems consist of Delhiremediation charges,net of insurancereimbursements( 7MM) in 2014, and areimbursement for aretroactive utility rateadjustment ( 10MM)and an insurancereimbursement forprevious well controlcosts ( 4MM), both in2015.Excludes derivativesettlements.26
Cash Operating Costs 42.81 39.19 37.48FY 20164.087
Johnson Rice 2017 Energy Conference September 26-27, 2017. NYSE: DNR www.denbury.com 2 Cautionary Statements Forward-Looking Statements: The data and/or statements contained in this presentation that are not historical facts are forward-looking statements, as that term is defined in Section 21E of the Securities Exchange Act of 1934, as amended,