Transcription
FACES OF MEDICAID DATA BRIEFNovember 2017Examining Oral Health Care Utilizationand Expenditures for Low-Income AdultsB y Stacey Chazin and June Glover , * C e nt e r f o r He a l t h C a r e S t r a t e gi e sIN BRIEFAccess to oral health care for low-income adults is a persistent challenge in the United States. Poor oral health canlead to increased risk for long-term chronic conditions, lost workdays and reduced employability, and preventabledental-related hospital visits for adults enrolled in Medicaid. To better understand how adult Medicaid beneficiariesare using dental services, the Center for Health Care Strategies (CHCS), with support from the DentaQuestFoundation, analyzed 2011 dental service use and cost data for non-elderly Medicaid-enrolled adults by a number ofindividual-, community-, and state-level factors. Findings from this analysis can help federal and state policymakers,Medicaid agencies, public health departments, health and dental plans, providers, advocates, and other oral healthstakeholders identify opportunities to improve access to care and, ultimately, achieve sustainable oral healthimprovements for low-income adults.The analysis is part of CHCS’ Faces of Medicaid data series, which examines high-cost Medicaid populations toprovide stakeholders with important insights to inform program design, service delivery, and cost-effectiveness.FINDINGS The comprehensiveness of a state’s dental benefit package was a major predictor of dental service use andcosts. The highest levels of outpatient dental service, or preventive dental service use specifically, were in stateswith more comprehensive coverage. While the percentage of beneficiaries using emergency departments (ED) for dental needs was low, emergencyservices are costly, and in most cases, individuals’ dental-related needs could be addressed in communitysettings. Hispanic beneficiaries had the lowest utilization rates of any racial/ethnic group, but that disparitydeclined significantly when controlling for state dental benefits category, degree of urban influence, and dentalprovider-to-resident ratio. Beneficiaries with intellectual/developmental disabilities and those residing in nursing homes weremore likely to use dental services than the general Medicaid adult population. Older non-elderly adult Medicaid beneficiaries, ages 45-64, had higher mean dental costs than youngeradults, likely driven by their use of more expensive services. Communities with more dentists per resident had higher outpatient use and lower ED use for dentalservices among Medicaid-enrolled adults. Areas that were more urban saw lower dental service use in both outpatient settings and EDs whencompared to more rural areas.*June Glover is a former program officer at CHCS.Made possible through support from the DentaQuest Foundation.
EXAMINING ORAL HEALTH CARE UTILIZATION AND EXPENDITURES FOR LOW-INCOME ADULTSIntroductionAdequate oral health care coverage and access for low-income adults, including those enrolled inMedicaid, remain elusive in most states. Because the federal government classifies dental coverage foradults as an optional Medicaid benefit, it is often among the first benefits to be trimmed in tight fiscaltimes. As of November 2017, only 34 states covered services beyond medically necessary care in emergencycircumstances, and only 17 offered an extensive benefit (see Key Terms, page 3). 1 This presents a significantbarrier to oral health for low-income adults, who often cannot afford to pay out-of-pocket for services, andthus have no options for oral health care other than charity dental services, which are inconsistently available.When compared to those with higher incomes, low-income adults are 40 percent less likely to have had adental visit in the past 12 months and are two-and-a-half times as likely to have untreated tooth decay. 2Accordingly, they are affected disproportionately by oral health problems — elevating their risk for chronicconditions such as diabetes and heart disease; lost workdays and reduced employability; 3 and preventableuse of acute care. 4 These challenges have also led to an increase in dental-related hospital visits and overalluncompensated care over the past several years — costs that are ultimately paid for by taxpayers. 5The situation is even direr for older adults because: (a) oral health needs tend to increase with age;(b) there is no Medicare dental benefit except in the case of dental services needed for the treatment ofmedical conditions; and (c) optional Medicare Advantage benefits are often limited. Not surprisingly, roughlyone-quarter of the elderly have lost all of their teeth. 6As state Medicaid stakeholders explore how to meet the oral health needs of their adult population andconsider benefits expansion, they could benefit from a better understanding of the utilization andexpenditure patterns of adult beneficiaries, especially high-risk populations. This Center for Health CareStrategies (CHCS) analysis, made possible through support from the DentaQuest Foundation, is designed tohelp federal and state policymakers, Medicaid programs, health/dental plans, providers, advocates, and otheroral health stakeholders identify opportunities to improve oral health care access and outcomes. Using 2011Medicaid data from 44 states, the study examined dental service costs and utilization for adult beneficiaries,based on individual-, community-, and state-level factors. It is part of CHCS’ Faces of Medicaid data series,which examines high-cost Medicaid populations to provide stakeholders with important insights to informprogram design, service delivery, and cost-effectiveness.ACKNOWLEDGEMENTSThe Center for Health Care Strategies (CHCS) thanks Todd Gilmer, PhD, professor and chief, Division of Health Policy,Department of Family Medicine and Public Health, and Zhun Xu, PhD, programmer/analyst, Health Services ResearchCenter, both of the University of California, San Diego, for their analytical services and support.Thank you, as well, to the following individuals for advising CHCS on the study design and/or reviewingdrafts of this report: Melissa Allen, formerly of ACHIEVA/The Arc of Greater Pittsburgh; Mark Casey, North CarolinaDepartment of Health and Human Services, Division of Medical Assistance; Sara Finne, New Hampshire Department ofHealth and Human Services, Office of Medicaid Services; Paul Glassman, Pacific Center for Special Care, University of thePacific, Arthur A. Dugoni School of Dentistry; Robert Isman, formerly of the California Department of Health Care Services;Laurie Norris, formerly of the Centers for Medicare & Medicaid Services; Andrew Snyder, Centers for Medicare &Medicaid Services; and Cassandra Yarbrough, Health Policy Institute, American Dental Association.From the Center for Health Care Strategies, the authors also express appreciation to Alexandra Kruse andNancy Archibald for their subject-matter expertise in the needs of nursing home residents.FACES OF MEDICAID DATA BRIEF 2
EXAMINING ORAL HEALTH CARE UTILIZATION AND EXPENDITURES FOR LOW-INCOME ADULTSSTUDY DESIGNFindings from this study7 are based on analyses 8 of Medicaid Analytic eXtract (MAX) data from 2011, which include data forfee-for-service (FFS) and managed care claims from 44 states. 9 Demographic and eligibility information was derived fromthe MAX person summary files. Community characteristics 10 (region, degree of urban influence, high poverty) and healthresources (number of primary physicians per 1,000 residents, number of dentist per 1,000 residents, and number offederally qualified health centers per 1,000 residents) were extracted from the Area Health Resources Files (AHRF) 2015file 11 and linked to MAX data by state and county code. Information on state Medicaid adult dental coverage in 2011 —showing that 11 states had no coverage, 12 had emergency-only coverage, 15 had limited coverage, and 12 plus theDistrict of Columbia (D.C.) covered an extensive set of services — was gathered from published sources. 12,13(See Appendix for a full description of the methodology and study limitations.)KEY TERMS State dental benefits categories: For this study, states’ oral health care benefits were grouped by thecomprehensiveness of their oral health care benefits for Medicaid-enrolled adults in 2011. Categories included:» No coverage: No benefits are offered, including in emergency situations.» Emergency-only: Care is only covered for relief of pain under defined emergency situations.» Limited: Benefits cover fewer than 100 diagnostic, preventive, and minor restorative procedures recognized by theAmerican Dental Association (ADA). Per-person annual expenditures are capped at less than 1,000.» Extensive: A comprehensive mix of services is covered, including more than 100 diagnostic, preventive, and minor andmajor restorative procedures approved by the ADA. Per-person annual expenditure are capped at greater than orequal to 1,000. Ambulatory care-sensitive (ACS) dental needs: Dental needs for which appropriate ambulatory or outpatient careprevents or reduces the need for care in a hospital.Non-traumatic dental conditions (NTDC): A range of oral health needs that arise from common dental conditions, suchas tooth decay and periodontal disease, and ordinarily do not require care in an emergency department.Degrees of urban influence: Urban Influence Codes make up a classification scheme that distinguishes metropolitancounties by population size of their metro area, and non-metropolitan counties by the size of their largest city or townand by their proximity to metro areas. 14FACES OF MEDICAID DATA BRIEF 3
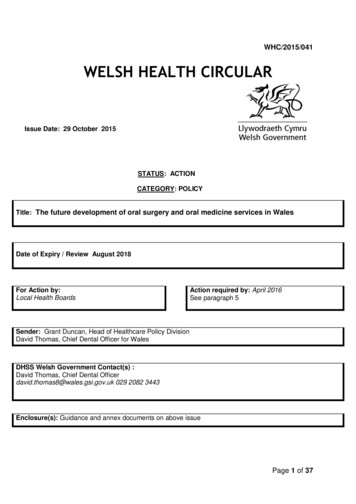
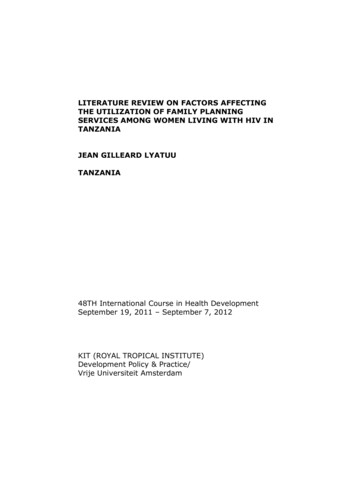
EXAMINING ORAL HEALTH CARE UTILIZATION AND EXPENDITURES FOR LOW-INCOME ADULTSFindingsThe comprehensiveness of a state’s dental benefit package was a major predictor ofoutpatient dental service use and costs. The highest average levels of outpatient, orpreventive dental service use specifically, were in states with more comprehensive coverage.Overall, dental service use among adult Medicaid beneficiaries was low. Among the 16 million adult Medicaidbeneficiaries in the study’s general population, only about 2.6 million (16.1%) used any dental service in anoutpatient setting. This utilization rate varied greatly by state benefit coverage category.Thirty-nine states plus D.C. offered some Medicaid coverage of adult dental services in 2011 —emergency-only (12), limited (15), or extensive (13) — and more than half had offered the same benefitcoverage for 10 years or more (Exhibit 1). 15EXHIBIT 1: Medicaid Coverage of Adult Dental Services, MSTXHIARLARIOHINALCTWV VANJNCTNOKMAPAKYMONHDESCMDGADCFLAKNo coverageLimitedEmergency-onlyExtensiveFACES OF MEDICAID DATA BRIEF 4
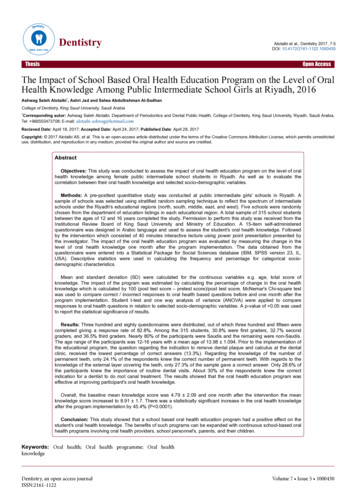
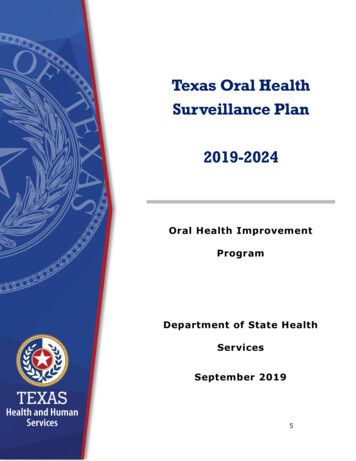
EXAMINING ORAL HEALTH CARE UTILIZATION AND EXPENDITURES FOR LOW-INCOME ADULTSService use was highest in states with limited or extensive dental benefits, an association found to besignificant. The study also used a predictive model to project the impact on utilization of a state’s potentialchange from no or emergency-only coverage, to a limited or extensive benefit. In states with no coverage, theprojected increase was from 2.7 percent to 18.3 percent; in states with an emergency-only benefit, expandingcoverage to limited or extensive was projected to change utilization from 8.1 percent to 20.7 percent(Exhibit 2).EXHIBIT 2: Comparing Actual Utilization to Predicted Values with a Change to Limited orExtensive Coverage, 2011Actual utilization in stateswith no coverage2.7%Projected utilization if a statechanges from no coverage tolimited or extensive coverageActual utilization in stateswith emergency-only coverageProjected utilization if a statechanges from emergency-onlyto limited or extensive coverage18.3%8.1%20.7%ActualProjectedIn tandem, actual utilization data showed that more extensive state coverage was associated with higher costs(i.e., Medicaid reimbursement). Expenditures per beneficiary for outpatient services were 9.20 in states withno coverage, 31.21 in emergency-only states, and much higher at 93.91 in limited and 95.25 in extensivestates. Of note, costs in extensive states exceeded those in limited states, but utilization was slightly lower inthe former.WHAT THE FINDINGS SUGGEST: Higher utilization of outpatient dental services in states with more thanan emergency-only benefit demonstrates the significant impact of coverage on access to care; however,continuing low rates of utilization suggest persistent barriers. These may include: (1) an inadequate providernetwork to meet demand; (2) logistical barriers to appointments, such as transportation and difficulty takingtime off from work; (3) low rates of oral health literacy; and (4) lack of knowledge about Medicaid dentalbenefits and how to access them. States and other oral health stakeholders should assess what specific factorsare affecting access to services in particular geographic areas or sub-populations, and explore interventions(e.g., a culturally sensitive oral health literacy campaign) to address them.While the potential to dramatically increase service use through benefit expansion is clear, states also need toconsider the financial costs and corresponding return on investment (ROI) that would follow. Such projectionscall for assumptions about use of specific services over time, acknowledging that costs may be higher in thefirst year (this study did not explore utilization and costs over time). Lower costs in subsequent years couldresult from a drop in utilization following pent-up demand among newly insured individuals; reductions incostlier treatments for advanced dental disease; 16 and/or reductions in risk for certain chronic illnesses such ascardiovascular disease. 17FACES OF MEDICAID DATA BRIEF 5
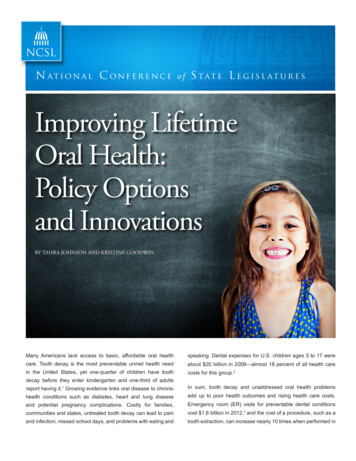
EXAMINING ORAL HEALTH CARE UTILIZATION AND EXPENDITURES FOR LOW-INCOME ADULTSWhile the percentage of beneficiaries using EDs for dental needs was low, most visits (87%)were related to ambulatory care-sensitive (ACS) conditions and thus could likely be divertedto community settings. A negligible percentage (0.02%) of those visiting the ED wasadmitted.Only about 200,000 Medicaid beneficiaries (1.4%) were seen in the ED for ACS dental services in 2011, withapproximately 3,200 (0.02%) of these individuals admitted subsequently for inpatient services. While theoverall percentage of Medicaid beneficiaries using EDs for dental needs was low, those seen in the ED had anaverage of nearly two visits, and those admitted through the ED for ACS dental conditions averaged1.22 inpatient stays. Total expenditures for ACS dental-related ED visits exceeded 21 million across all states.Consistent with other studies, 18 non-traumatic dental conditions (NTDC) accounted for the majority (71%) ofACS dental emergency visits: 53 percent were coded as unspecified disorders of teeth and supportingstructure, and 18 percent as dental caries (Exhibit 3). There was no association between ED use and statecoverage category.EXHIBIT 3: Dental-Related ED Visits by Service Type, 2011Service TypePercentageDental caries18.4%Unspecified disorder of teeth and supporting structure53.0%Periapical abscess without sinus18.5%Inflammatory conditions0.4%Cellulitis and abscess2.1%Other7.6%WHAT THE FINDINGS SUGGEST: Although utilization for dental-related services in the ED was relativelylow, the frequency and nature of these visits suggest an unmet need for preventive services and continuity ofcare in more cost-efficient outpatient settings. Lack of an association between state dental benefit coverageand dental utilization in the ED was surprising and warrants further investigation. It also underscores the needfor concerted efforts to improve access to outpatient dental care even in states with an extensive benefit.FACES OF MEDICAID DATA BRIEF 6
EXAMINING ORAL HEALTH CARE UTILIZATION AND EXPENDITURES FOR LOW-INCOME ADULTSHispanic beneficiaries had the lowest utilization rates of any racial/ethnic group (Exhibit 4),but that disparity declined significantly when controlling for state dental benefits category,degree of urban influence, and dental provider-to-resident ratio.There were small differences in actual dental service use by racial/ethnic group: Hispanics had the lowest rates— 13.5 percent compared to a range of 15.7 percent to 17.4 percent among other racial/ethnic groups.Notably, regression analyses showed that predicted racial disparities in utilization were significantly reducedwhen controlling for certain socioeconomic and community factors — such as community poverty level, statedental benefit coverage category, urban vs. rural setting, and geographic location — especially in Hispanicadults (Exhibit 4). In contrast to actual utilization findings, Hispanic beneficiaries have higher predictedlikelihood of dental service use.EXHIBIT 4: Impact of Controlling for Coverage and Community Factors by Races/Ethnicity, 20%6%7%14%9%5%7%15%4%WhiteBlackAmerican Indianor Alaskan NativeActual Services UseAsianHispanicControlling for Coverage CategoryOtherUnknownControlling for Community FactorsWHAT THE FINDINGS SUGGEST: Racial/ethnic disparities in oral health are well-established. 19 Thisstudy’s findings for Hispanic Medicaid beneficiaries add to existing evidence, illustrating the extent to whichlocation influences health. Half of all Hispanic beneficiaries resided in states with no coverage (47.3%) oremergency-only coverage (2.6%) — compared to white beneficiaries, who primarily resided in states withlimited (33.5%) or extensive (29.7%) coverage. Other racial groups were distributed similarly to whites, or evenoverrepresented in some instances, in states with limited or extensive Medicaid dental benefits.Because predicted utilization rates among Hispanics improved when controlling for communitycharacteristics, this study underscores the need for interventions that address the social determinants ofhealth. While such factors as community poverty level, state dental benefit coverage category, andgeographic location were included in the analysis, it did not account for individual behaviors and perceptionsaround oral health and its value. Collecting data on these variables would allow for a more comprehensiveexamination of the factors that contribute to low dental service use among certain populations and informdevelopment of place-based techniques, targeted strategies, and interventions.FACES OF MEDICAID DATA BRIEF 7
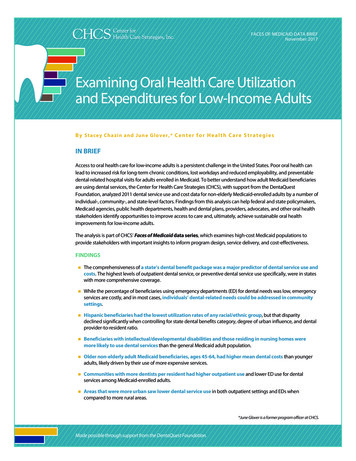
EXAMINING ORAL HEALTH CARE UTILIZATION AND EXPENDITURES FOR LOW-INCOME ADULTSNearly 29 percent of adults with intellectual/development disabilities (I/DD) used dentalservices, compared to only 16 percent of the overall adult Medicaid population — a findingto be reconciled with higher rates of dental disease observed in this sub-group.20Beneficiaries with I/DD had a much higher rate of dental service use than the general Medicaid population —28.9 percent compared to 16.1 percent. Their use of services rose with age — it was lowest for ages 21 to 34(26.4% vs. about 30% in the two older age brackets). Among the 18 chronic conditions studied, regressionanalyses showed I/DD to have the greatest influence, by far, on dental service use, at 13.1 percent. 21 Further,compared to the general adult Medicaid population, adults with I/DD using any service also were 43.3 percentmore likely to use preventive services (69.5% vs. 48.5%); half as likely to use oral and maxillofacial surgery(16.4% vs. 32.4%) (Exhibit 5); had mean dental costs per beneficiary that were 22 percent less ( 306 vs. 391);and were a little more than one-fourth as likely to use the ED for dental-related visits (0.4% vs. 1.4%).EXHIBIT 5: Utilization of Specific Services by Beneficiaries Using Any Dental Service:General Population vs. Adults with I/DD, 201192%94%General PopulationAdults with ive22%Adjunctive General8%3%16%MaxillofacialOral andMaxillofacialSurgeryWHAT THE FINDINGS SUGGEST: Relatively high rates of outpatient use and low rates of ED use amongadults with I/DD may result from: (1) living in group home settings, which can result in better overall caremanagement; (2) living with family caregivers who ensure that they receive oral health care; 22 (3) a largemajority taking medication that can be detrimental to teeth (e.g., causing chronic dry mouth), driving use oforal health care; 23 (4) most being entitled to long-term — some, lifetime — Medicaid enrollment by virtue ofdisability status, making them more likely to have a dental home; 24 and (5) many pediatric dentists continuingto treat them past age 20 given relationships with the beneficiary and his family. 25Their lower mean dental costs may be due to a much greater likelihood of preventive dental service use,presumably preventing costly dental disease, or providers’ reluctance to treat their complex care needs. 26While graduates of accredited dental schools must be competent in assessing the treatment needs ofindividuals with special needs, they are not required to be competent in treating them. 27Notably, our study’s findings may be seen as being at odds with others showing higher prevalence ofuntreated caries, periodontitis, and edentulism (toothlessness) in the population. 28 However, such studieshave focused on disease prevalence rather than service use, and have attributed worse outcomes to lowerobserved oral health care utilization; cognitive, physical, and behavioral limitations to performing daily oralcare and cooperating during visits; and use of medications. 29 Additional research is warranted to reconcilethese findings.FACES OF MEDICAID DATA BRIEF 8
EXAMINING ORAL HEALTH CARE UTILIZATION AND EXPENDITURES FOR LOW-INCOME ADULTSRoughly 25 percent of non-elderly Medicaid beneficiaries in nursing homes used dentalservices compared to only 16 percent of the general adult Medicaid population, but themean number of services used and mean expenditures among service utilizers in thosesettings were lower.About one-quarter of Medicaid beneficiaries residing in nursing homes used any dental service, compared toonly 16 percent of the general adult Medicaid population. Among service users in nursing homes, diagnosticswere the most common, followed by preventive care, and oral and maxillofacial surgery (Exhibit 6). Less than0.2 percent used implants, prosthodontics, endodontics, and/or orthodontics. Further, very few nursing homeresidents (0.14% vs. 1.36% of general adult Medicaid beneficiaries) sought oral health care in an ED.The mean dental cost per user in a nursing home was 26.8 percent less than the general Medicaid population— 286 vs. 391per service user. Similarly, cost per service used was 53 in nursing homes vs. 57 in thegeneral population. Differences in the mean number of services used trended similarly — 5.45 in nursinghomes, and 6.91 in the general population. In short, nursing home residents used fewer and less costly services.EXHIBIT 6: Utilization of Specific Services by Beneficiaries Using Any Dental Service:General Population vs. Adults in Nursing Homes, 2011General Population92%Adults in Nursing ive14%5%Adjunctive General8%3%Maxillofacial6%Oral andMaxillofacialSurgeryWHAT THE FINDINGS SUGGEST: There are a number of possible explanations for higher outpatientservice use among residents of nursing homes. Federal regulations require nursing facilities to provide, orobtain from an outside source, routine dental services (to the extent covered by the state plan) andemergency services. In addition, as services are offered directly to residents on-site, these beneficiaries do notface transportation or other logistical barriers to accessing outpatient services. Further, if an individual in anursing facility tells someone of oral pain or the staff notice changes in behaviors (eating less, for example),the facility is likely to connect the resident to care. As well, care coordinators may incorporate oral health intothe plan of care for each resident. Ultimately, because their oral health needs are being met on-site, nursinghome residents are less likely to have emergent dental needs that require a visit to the ED.As with the I/DD population, the juxtaposition of relatively high utilization rates with lower mean costs raisesthe need to explore why individuals in nursing homes are not receiving more expensive procedures. Similarly,the relative difficulty and appointment duration time for providing services to this population may deterproviders from delivering more complex services, 30,31 suggesting the need for specialized training and/orincentives for care delivery.FACES OF MEDICAID DATA BRIEF 9
EXAMINING ORAL HEALTH CARE UTILIZATION AND EXPENDITURES FOR LOW-INCOME ADULTSOlder non-elderly adults, ages 45-64, have higher mean dental costs per user, likely driven bytheir use of more expensive services.Medicaid beneficiaries, ages 45 to 64, using oral health care service users had the highest mean dental costsper user of any non-elderly age category — 430, compared to 378 for those 35 to 44, and 369 for ages 21to 34. However, meaningful differences in the percentage of beneficiaries using any dental service or in themean number of services used were not clear among the age groups. Costs per service used were 62 for theoldest group; 55 for ages 35 to 44; and 54 for ages 21 to 34 (Exhibit 7).Some trends were seen in use of specific service types by age of user. As age increased, use of diagnostic(ranging from 93.0% to 90.8%) and restorative (from 37.2% to 30.8%) services declined, and use of oral andmaxillofacial surgery services increased (from 2.5% to 15.7%).EXHIBIT 7: Trends in Dental Service Use and Costs by Age, 2011%# 21 to 3435 to 4445 to 64Trend withIncreasing Age16.5%16.7%15.3%None 6.96.97.0None Mean cost per service per user 53.65 54.77 61.63Rising Mean expenditures per user 369.48 378.00 428.57Rising Likelihood of outpatient service useMean number of services per userWHAT THE FINDINGS SUGGEST: Higher costs among older non-elderly adult Medicaid beneficiariesappear to be an area for further exploration. They could be due to changing clinical needs of adults as theyage, or to the culmination of years of unmet oral health needs that have escalated to require more complex,and therefore more expensive, care. Generational factors may also be at play: the younger half of the “babyboom” generation —which is in this study’s oldest age category — grew up in an era with little waterfluoridation and widespread use of amalgam restorations, which may be breaking down at this point in theirlives. 32Given the lack of a Medicare dental benefit, addressing oral health for those approaching that program’seligibility age is critical — particularly in states that lack an extensive Medicaid dental benefit. Multi-prongedprogrammatic and advocacy efforts, such as Oral Health America’s Wisdom Tooth Project — which includes aconsumer-focused web portal, legislative advocacy for a Medicare dental benefit, symposia for healthprofessionals, and a tailored health education curriculum for older adults 33 — could provide value inaddressing the population’s complex oral health needs.FACES OF MEDICAID DATA BRIEF 10
EXAMINING ORAL HEALTH CARE UTILIZATION AND EXPENDITURES FOR LOW-INCOME ADULTSCommunities with more dentists per resident have higher outpatient utilization and lowerED utilization for dental services among Medicaid-enrolled adults.When all other factors are controlled (through regression analyses), the predicted likelihood of dental serviceuse in an outpatient setting increases as the number of dentists per 1,000 residents rises, ranging from13.6 percent to 19.9 percent (Exhibit 8). Actual utilization ranged from 14.3 percent at the lowest ratio to22.3 percent at the highest. Similarly, the probability of dental ED use falls in communities with more dentistsper resident, with 73 percent less likelihood in areas with the highest ratios compared to those with thelowest.Predicted outpatient dental expenditures were correspondingly highest in communities with the bestprovider-to-resident ratio — 76 vs. 57 in communities with the worst ratio. Conversely, predictedexpenditures for ED and inpatient use declined as ratios climbed — ranging from 2.41 at the lowest, to 1.64at the highest.Probibility of Service UseEXHIBIT 8: Predicted Service Use in Various Settings, by Dentist-to-Resident Ratio, 201125%20%15%10%5%0%0 - 0.450.46 - 0.610.62 - 0.750.76 - 3.80Dentisits Per 1,000 ResidentsOutpatientEmergency RoomHospital InpatientWHAT THE FINDINGS SUGGEST: Having a particular number of dentists per resident in a region is not anabsolute measure of Medicaid provider network adequacy and does not ensure access to care. Networkadequacy is also influenced by such factors as how many Medicaid beneficiaries a provider is willing to see;the availability of weekend and evening appointments; and logistical accessibility of those providers in thenetwork. However, having a greater ratio of dentists to residents is an important building block to access, assuggested by these findings and other research revealing lower rates of dental visit completion in urban andrural areas with relatively low numbers of general dentists. 34,35Geographic pockets of particularly low dentist-to-resident ratios may help identify opportunities for:(1) targeted ED-diversion programs; (2) use of mid-level providers to deliver certain oral health services; 36(3) tele-dentistry; 37 and (4) other efforts to improve access. A similar approach might be used to explore ratiosof culturally aligned providers to residents to help ensure the use of preventive and lower cost services. Inareas where the number of providers from a particular ethnic group is low relative to the number of residentsin that group, provider recruitment efforts cou
Strategies (CHCS) analysis, made possible through support from the DentaQuest Foundation, is designed to help federal and state policymakers, Medicaid programs, health/dental plans, providers, advocates, and other oral health stakeholde rs identify opportunities to