Transcription
BOOKER REPORT 2012: PART EDemographic Differences inSentencingINTRODUCTIONIn 2010, the Commission published the resultsof an analysis of federal sentencing data, the 2010Booker Multivariate Analysis,1 which examinedwhether differences in the length of the sentenceimposed on offenders correlated with differences indemographic characteristics of those offenders. Theanalysis focused on three time periods: the PROTECTAct period, the Booker period, and the Gall period,which included data current through the end of fiscalyear 2009.2 The 2010 Booker Multivariate Analysisdetermined that demographic factors were associatedwith sentence length to a statistically significant extentduring some of the time periods under study. Amongother findings, the analysis showed that Black maleoffenders received longer sentences than similarlysituated White male offenders, and that the gapbetween sentence lengths for Black and White maleoffenders increased from the PROTECT Act periodthrough the Gall period.1See U.S. SENTENCING COMM’N, DEMOGRAPHICDIFFERENCES IN FEDERAL SENTENCING PRACTICES: ANUPDATE OF THE BOOKER REPORT’S MULTIVARIATEREGRESSION ANALYSIS (2010) [hereinafter 2010 BookerMultivariate Analysis].2The PROTECT Act period was from May 1, 2003, thedate of the enactment of the PROTECT Act, through June,24, 2004, the date of the Supreme Court’s decision inBlakely v. Washington; the Booker period was from January12, 2005, the date of the Supreme Court’s decision inUnited States v. Booker, through December 10, 2007, thedate of the Supreme Court’s decisions in Kimbrough v.United States and Gall v. United States; and the Gall periodwas from December 11, 2007 through September 30, 2009.See id. at A-1.In its 2010 report, the Commission also notedthat results from the analysis must be taken withcaution. Multivariate regression analysis is a toolcommonly used by social scientists, as well as in avariety of legal contexts, to examine the relationshipbetween multiple factors, 3 and it has its limitations.For example, one or more key factors which couldaffect the analysis may have been omitted from themethodologies used because a particular factor isunknown, or because data about it is not readilyavailable in the Commission’s datasets. For example,judges may consider potentially relevant factorsavailable to them in a presentence report, such as anoffender’s violent criminal conduct or longemployment history. However, the Commission doesnot routinely extract that information from thesentencing documents it receives. Such factors,therefore, are not included in the Commission’sdatafile, and therefore are not controlled for in thisanalysis.Moreover, while the Commission’s analysisdemonstrated that some differences in sentencesimposed on certain groups of offenders wereassociated with specific demographic characteristics,the Commission noted that these differences may havebeen attributable to one or more of a number of factorsthat, while correlated with the demographiccharacteristics, are not caused by them. For example,judges make decisions when sentencing offendersbased on many legitimate considerations that are notor cannot be measured.Because multivariateregression analysis cannot control for all relevantfactors, the results should be interpreted with cautionand should not be taken to suggest race or genderdiscrimination on the part of judges. Multivariateanalysis cannot explain why the observed differencesin sentencing outcomes exist, but can only show thatthey exist. The analysis also measures the relative sizeof those differences and determines the time periods inwhich they were observed.In September 2011, the Commission updatedits analysis by adding 2010 data to the Gall period, andby including additional Koon period data thatpreviously had not been part of the analysis.4 That3See Michael O. Finkelstein and Bruce Levin, Statistics forLawyers 350 (2d ed. 2001) [hereinafter Finkelstein].4For the purposes of the multivariate analysis, the Koonperiod runs from October 1, 1998 through April 30, 2003.1
BOOKER REPORT 2012: PART Eanalysis was included in the 2011 testimony ofCommission Chair Patti Saris before the HouseSubcommittee on Crime, Terrorism, and HomelandSecurity.5 For this report, the Commission updated theanalysis presented in the Chair’s congressionaltestimony by adding 2011 data to the Gall period. Inaddition, the Commission reviewed public commentfollowing release of its earlier analysis, includingconcerns that different statistical methodologies wouldresult in different outcomes with respect todemographic differences in sentencing.TheCommission performed additional analyses to addressthese concerns, and the results are presented in thischapter. The Commission also expanded its analysisto examine sentences relative to the guideline range;specific offense types, including drug trafficking,fraud, and firearms; and changes in sentence length foroffenders of particular race and gender pairings.SUMMARY OF FINDINGS FROM THECOMMISSION’S MULTIVARIATE ANALYSISConsistent with previous results theCommission found that sentence length is associatedwith some demographic factors.Sentences ofsimilarly situated Black male offenders were 19.5percent longer than those of similarly situated Whitemale offenders during the Gall period. The gapbetween sentence length for Black male offenders andWhite male offenders was statistically significantduring all four periods, but was smallest during thePROTECT Act period (5.5%) and largest during theGall period (19.5%). With respect to race as a specificdemographic factor, alternative models replicated theCommission’s results, showing the same pattern of anincreasing gap in sentence length between White andBlack male offenders.Additional Commission analyses regardingspecific offense types and sentence relative to theThis is a different definition of the Koon time period thanused elsewhere in this report. See Part C – Methodology.5See Prepared Testimony of Judge Patti B. Saris, Chair,United States Sentencing Commission, before theSubcommittee on Crime, Terrorism, and Homeland SecurityCommittee on the Judiciary, United States House ofRepresentatives (Oct. 12, 2011), available athttp://www.ussc.gov/Legislative and Public Affairs/Congressional Testimony and Reports/Testimony/20111012 Saris Testimony.pdf.guideline range may help specify which factors may ormay not contribute to the demographic differencesnoted above. With respect to the sentence relative tothe guideline range, the Commission conductedadditional multivariate analyses of within range,government sponsored below range, and nongovernment sponsored below range sentences. Theanalysis showed that there were statistically significantdifferences in sentence length during all four periodsbetween Black and White male offenders sentencedwithin the range.With respect to offenders who receivedsubstantial assistance below range sentences, Blackmale offenders received longer sentences than Whitemale offenders during the Koon period only. OtherRace male offenders who received substantialassistance below range sentences received longersentences than White male offenders during theBooker period only.Comparing Black male offenders to Whitemale offenders who received a non-governmentsponsored below range sentence (the analysis did notinclude the Koon period), the differences in sentencelength between the two groups were statisticallysignificant only in the Booker period, when Blackmale offenders who received a non-governmentsponsored below range sentence received sentences12.3 percent longer than White male offenders whoreceived a non-government sponsored below rangesentence.Differences in sentence length betweenHispanic male offenders and White male offenderswho received a non-government sponsored belowrange sentence were statistically significant in the Gallperiod.There were no statistically significantdifferences between the sentences imposed on OtherRace male offenders and White male offenders whoreceived a non-government sponsored below rangesentence. White and Black female offenders whoreceived a non-government sponsored below rangesentence received shorter sentences than White maleoffenders who received a non-government sponsoredbelow range sentence during the Gall period. Hispanicand Other Race female offenders who received a nongovernment sponsored below range sentence receivedshorter sentences than White male offenders whoreceived a non-government sponsored below rangesentence during both the Booker and Gall periods.Multivariate analysis of the odds of receivinga non-government sponsored below range sentencerevealed a statistically significant difference during thePROTECT Act, Booker, and Gall periods (the analysis2
BOOKER REPORT 2012: PART Edid not include the Koon period). During theseperiods, Black male offenders were more than 20percent less likely to receive a non-governmentsponsored below range sentence than White maleoffenders were. These differences may contribute tothe difference in sentence length between Black andWhite male offenders. Hispanic male offenders wereless likely than White male offenders to receive a nongovernment sponsored below range sentence during allthree periods, and this difference was highest (31.6%)during the Gall period.Results of the multivariate analysis of specificoffense types varied depending on the offense. Forexample, an analysis of fraud cases showed that duringthree out of four periods, there was no statisticallysignificant difference between sentence length ofWhite male and Black male offenders. The onlystatistically significant difference was seen in the Koonperiod. In contrast, analysis of firearms cases revealedstatistically significant differences between sentencelength of White and Black male offenders during theKoon, Booker, and Gall periods. There was nostatistically significant difference during thePROTECT Act period.In the multivariate analyses of all cases,female offenders of all races received shortersentences than White male offenders during all fourperiods. In every other analysis, including an analysisof offenders sentenced within the guideline range,offenders sentenced below the guideline rangepursuant to a substantial assistance departure or othergovernment sponsored departure, and offendersreceiving non-government sponsored below rangesentences, female offenders of some racial groupsreceived shorter sentences than White male offendersduring some of the periods studied. White andHispanic female offenders were more likely thanWhite male offenders to receive a non-governmentsponsored below range sentence during some of theperiods studied. In drug trafficking, fraud, andfirearms cases, female offenders of some racial groupsreceived shorter sentences than White male offendersduring some of the periods studied.Non-citizen offenders received longersentences than United States citizens during three outof the four periods studied. The difference was notpresent during the PROTECT Act period, but returnedduring the Booker and Gall periods at levels exceedingthose of the Koon period. Offenders with at least somecollege education received shorter sentences thanoffenders with no college education during all of theperiods studied.Finally, the Commission performed amultivariate analysis to determine whether sentencelength has changed across periods for each race/genderpairing, and if so, in what direction.For somerace/gender pairings, sentences were shorter during theGall period than they were in previous periods.Sentences for White male and female offenders andBlack male and female offenders were shorter duringthe Gall period than during the Booker period.Although White and Black offenders received shortersentences in the Gall period compared to the Bookerperiod, decreases in sentence length were larger forWhite male and female offenders than for Black maleand female offenders. Sentence length for Hispanicand Other Race male offenders also decreased in theGall period compared to the Booker period. Sentencelength for Hispanic and Other Race female offendersdid not change to a statistically significant extent.THE NEED FOR MULTIVARIATE REGRESSIONANALYSIS OF DEMOGRAPHIC DIFFERENCESIN SENTENCING PRACTICESWith respect to demographic differences insentencing outcomes, results from a simplistic pairingof demographic factors and sentencing outcomes canbe misleading. Such an analysis may yield results thataccurately describe sentencing outcomes, butdifferences that may seem to correlate withdemographic factors may actually be attributable tonon-demographic factors, such as the offense ofconviction or whether the offender was subject to astatutory mandatory minimum penalty. For example, asimplistic pairing of race and gender with sentencelength shows that sentences of Black male offenderswere twice as long as those of White male offenders.Such a simplistic analysis compares Black maleoffenders to White male offenders without accountingfor any differences in seriousness of offense, guidelineminimum, or any other non-demographic factor.Nonetheless, commentators have used publiclyavailable data to draw certain conclusions about trendsin federal sentencing and the contribution of variousfactors to those trends. For example, at its February2012 hearing on post-Booker federal sentencing, theCommission received public comment stating that thegap between sentences for Black and White offendershas narrowed as a result of judges’ increased3
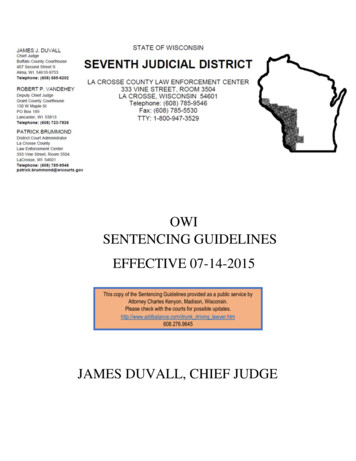
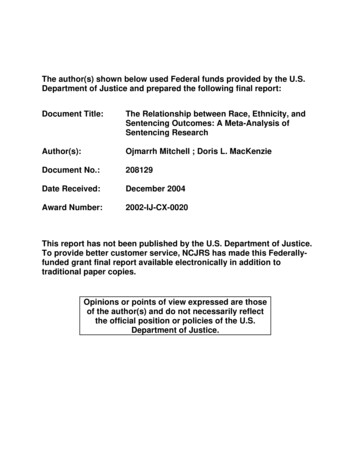
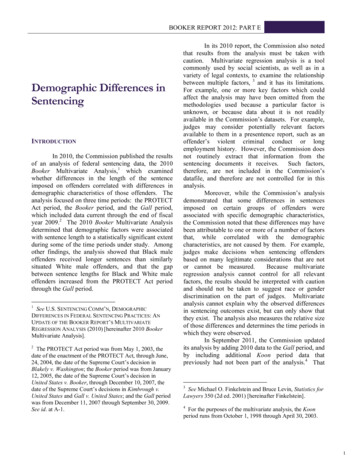
BOOKER REPORT 2012: PART Ediscretion in an advisory guidelineregime.6 While the statement that thegap between sentence length for Blackand White offenders is narrowing is true,attributing the change to increasedjudicial discretion is a conclusion thatcannot be drawn from an analysis thatfails to control for relevant factors. Forinstance, the narrowing gap betweenBlack and White offender sentencelength is due in part to reductions inpenalties for crack cocaine offenses inwhich Black offenders constitute thelarge majority of offenders. Figures E-1and E-2 below both show that averageguideline minimum and averagesentences for Black male offenders wereshorter during the Gall period thanduring the Booker period. At the sametime, average guideline minimum forWhite male offenders increased during each period.The average sentence for White male offendersincreased during the Koon, PROTECT Act, andBooker periods, but decreased during the Gall period.The Commission’s multivariate analysisdetermined that, when legally relevant factors arecontrolled for, the gap in sentence length betweenBlack male and White male offenders increasedduring the Gall period compared to the Booker period.Furthermore, with respect to the role of judicialdiscretion in determining sentence length, theCommission’s study concluded that when judges havethe discretion to impose a non-government sponsoredbelow range sentence, Black offenders were less likelyto receive such a reduction than White offendersduring the three periods studied (PROTECT Act,Booker, and Gall). These results should be taken withcaution however, because a multivariate analysis haslimitations, such as omitting one or more key factorsbecause a factor is unknown or because data about it is6U.S. Sent’g Comm’n Public Hearing on FederalSentencing Options After Booker, Washington, DC (Feb.16, 2012) (Statement of Raymond Moore, Federal PublicDefender, Districts of Colorado and Wyoming, writtenstatement at 18); U.S. Sent’g Comm’n Public Hearing onFederal Sentencing Options After Booker, Washington,D.C. (Feb. 16, 2012) (Statement of Lisa Wayne, President,National Association of Criminal Defense Lawyers, writtenstatement at 10). It is not clear what methodology thecommentators used to reach these conclusion, and theCommission did not attempt to replicate it.Figure E-1not readily available in the Commission’s datasets.Furthermore, judges make sentencing decisions basedon many legitimate considerations that are not orcannot be measured.To further illustrate the differences between asimplistic analysis and a multivariate analysis, theCommission conducted a simplistic analysiscomparing sentencing outcomes among eightrace/gender pairings – White males/females, Blackmales/females, Hispanic males/females, and OtherRace males/females – during the four periodsdiscussed throughout the sentencing data chapters.This section presents some results from this analysis insummary form.8As seen in Figures E-1 and E-2, a simplisticanalysis that does not account for relevant factors,such as offense type, suggests that race and gender arecorrelated with sentence length. The simplisticanalysis shows that Black male offenders receivedsentences that were roughly 40 months longer than thesentences White male offenders received. Femaleoffenders of all races received sentences that wereapproximately half the length of sentences received bytheir male counterparts in the same racial group.Figure E-1 depicts the average guidelineminimum during the four periods for each race/genderpairing. Although the average guideline minimums8Additional figures depicting the results of the simplisticanalyses discussed in this paragraph and the followingparagraph are in the Appendix.4
BOOKER REPORT 2012: PART Efluctuated for some race/gender pairingsover the time periods, Black maleoffenders consistently faced the highestguideline minimums.Of all maleoffenders in the analysis, Hispanic maleoffenders faced the lowest guidelineminimums, except during the Koonperiod, when the guideline minimumsfor Hispanic male offenders were equalto those of Other Race male offenders.Female offenders of all racesconsistently faced shorter guidelineminimums than their male counterpartsof the same race.Figure E-2 depicts the averagesentence of confinement for eachrace/gender pairing during the fourperiods9. Black male offenders receivedthe longest average sentence ofconfinement during each period: theaverage sentence of confinement for Black maleoffenders was 83 months during the Koon period, 90months during the Booker period, and 86 months inthe Gall period. In comparison, the average sentenceof confinement for White male offenders was 42months during the Koon period, 54 months during theBooker period, and 53 months during the Gall period.The average sentence of confinement for femaleoffenders was consistently lower than the averagesentence of confinement for male offenders of thesame race.In non-government sponsored below rangesentences, the simplistic analysis indicated that Whiteoffenders and Other Race male offenders consistentlyreceived greater reductions below the guidelineminimum than Black or Hispanic male offenders.Female offenders received greater reductions thantheir male counterparts of the same race.The simplistic analysis suggested a correlationbetween demographic factors and sentencingoutcomes. However because a simplistic analysis doesnot control for other relevant factors, such as offensetype, it compares offenders who may have nothing incommon. For example, in the simplistic analysis, aBlack male offender facing a guideline minimum of 46months will often receive a higher sentence than aWhite male offender facing a guideline minimum of9The average sentence of confinement includes prisonsentences and alternatives to imprisonment. Probationarysentences are averaged in with a value of zero months.Figure E-221 months. The difference in sentencing outcomesmay be attributable in great part to the guidelineminimum, which is determined by the type of offenseand the criminal history category of the offender, andnot attributable to the race of the offender. For thisreason, conclusions about whether and to what extentdemographic factors actually contribute to theoutcomes observed cannot be made from thissimplistic analysis alone, and multiple regressionanalysis is necessary to explore the factors that maycontribute to these outcomes.MULTIVARIATE ANALYSIS OF DEMOGRAPHICDIFFERENCES IN SENTENCINGFor this report, the Commission conducted a series ofmultivariate regression analyses to further explore theapparent relationship between demographic factorssuch as race and gender and sentencing outcomes.The multivariate analyses were aimed at determiningwhether demographic differences in sentencingoutcomes were statistically significant, and whetherthose findings changed during the Koon, PROTECTAct, Booker, and Gall periods.Multivariate regression analysis usually beginswith a decision to examine an observed phenomenonor outcome. In this instance, the outcome observed isthe difference in sentence length between offenders.The researcher will then develop a hypothesis as to themany possible factors that might produce thatoutcome. In this instance, such relevant factors as type5
BOOKER REPORT 2012: PART Eof offense, guideline minimum, and whether theoffender was subject to a mandatory minimum penaltymay contribute to differences in sentence length. Thehypothesis is then tested through the use ofmultivariate regression analysis as data about theoutcome and many possible factors affecting thatoutcome are brought together.The goal ofmultivariate regression analysis is to determinewhether there is an association between the factorsbeing studied, and if so, to measure the extent to whicheach factor contributes to the observed outcome.Researchers refer to the outcome (in this instance,sentence length) as the “dependent variable.” Thefactors that might affect (and therefore might explain)that outcome are referred to as the “independentvariables” or the “explanatory variables.” 10Multivariate regression analysis often does notcontrol for all relevant factors because sufficient datais not always readily available. For example, somefactors that may be relevant to sentencing outcomesinclude whether the offender’s history included violentcriminal conduct, the offender’s family ties, and theoffender’s employment history.11 Data is not readily10For a more detailed explanation of multivariateregression analysis, the methodology behind it, and its usesand limitations, see 2010 Booker Multivariate Analysis,supra note 1, at 4-10. See also Federal Judicial Center,Reference Manual on Scientific Evidence 143, 181-83 (2ded. 2000) [hereinafter FJC Reference Manual] (chapterstitled “Reference Guide on Statistics,” by David H. Kaye,M.A., J.D., and David A. Freedman, Ph.D., and “ReferenceGuide on Multiple Regression,” by Daniel L. Rubinfeld,Ph.D.); Neil J. Salkind, Statistics for People Who (ThinkThey) Hate Statistics 324 (2d ed. 2007).available for those factors because the Commissiondoes not routinely extract that information from thedocuments it receives. Therefore the analysis cannotcontrol for them.12 For this reason, caution should beexercised in drawing conclusions based onmultivariate regression analysis.The principal benefit of multivariateregression analysis is that it controls for the effect ofeach factor in the analysis by comparing offenderswho are similar to one another in relevant ways. Forexample, controlling for the presumptive sentence(guideline minimum) and offense type means thatBlack male offenders convicted of firearms offensesand who faced a guideline minimum of 46 months ofimprisonment are compared to White male offendersconvicted of firearms offenses who faced a guidelineminimum of 46 months of imprisonment.Bycontrolling for such factors and comparing similarlysituated offenders to each other, multivariateregression analysis seeks to answer the question: iftwo offenders are similar in certain ways, what otherfactors might be associated with those two offendersreceiving different sentences?In addition,multivariate regression analysis measures the extent ofthe difference in outcomes.The Commission’s findings are set forthbelow in six parts. The first part describes themethodology used to conduct the various multivariateregression analyses. The second part provides asummary of findings for the analyses. The third partsets forth the results of its multivariate analysis for allcases updated to include fiscal year 2011 data. Thefourth part presents the findings of new multivariate11See generally United States Sentencing Commission,United States Sentencing Commission Guidelines Manual(2012) [hereinafter USSG] at Chapter 4. As noted in the2006 Booker Report, “The presence of violentcriminal history may lead the court to sentence higher in theprescribed range. The Commission’s datafile does not haveinformation on the type of criminal history behavior. In2002, the Commission created a datafile which took a 25percent random sample of cases sentenced in Fiscal Year2000. This datafile looked more closely at [an] offender’scriminal conduct, including detailed information on the typeof criminal history the offender had. Using this data (theIntensive Study Sample 2000, or ISS2000), it was foundthat 24.4 percent of white offenders had violent criminalhistory events, as did 43.7 percent of black offenders, 18.9percent of Hispanic offenders, and 23.7 percent of ‘other’offenders.” 2006 Booker Report, supra note 14, Part A, at105 n.317.12In addition, the Commission also does not have readyaccess to data related to prosecutorial decision making,which some commentators contend may contribute todemographic differences in sentencing. For furtherdiscussion of demographic differences in prosecutorialdecision making, see VERA Institute of Justice, Do Raceand Ethnicity Matter in Prosecution?: A Review ofEmpirical Studies, available athttp://www.vera.org/download?file n.pdf June 2012(reviewing 34 studies analyzing the role of race andethnicity in prosecutorial decision making).6
BOOKER REPORT 2012: PART Eand logistic regression13 analyses addressing sentencesrelative to the guideline range. The fifth part presentsthe findings of a new multivariate analysis addressingthree specific offense types: drug trafficking, fraud,and firearms. The sixth part presents the findings of anew multivariate analysis addressing changes insentence length by race/gender pairing during the fourtime periods. Type of offense committed (violent, sexual,pornography, drug trafficking, white collar,immigration, or other);16 Whether a statutory mandatory minimumpunishment was applied at sentencing;17 Whether the court determined that a sentenceoutside the applicable sentencing guideline rangewas warranted;18 Detention status (whether the offender had beenreleased on bail prior to sentencing); Whether the offender pleaded guilty; Race of the offender paired with the gender of theoffender; Citizenship of the offender (whether the offenderwas a United States citizen); Educational level of the offender; andMETHODOLOGYThe dependent variable used in each of theanalyses was an offender’s total sentence length, 4Probationary sentences withoutconditions of confinement are included as sentences ofzero months. The independent variables were: The presumptive sentence, which is the bottom ofthe applicable sentencing guideline range thatapplies in a case (i.e., the minimum sentence, inmonths, to which the offender was subject underthe sentencing guidelines, taking into account allguideline, statutory, and mandatory minimumprovisions);1513In this instance, an analysis of the odds of receiving anon-government sponsored below range sentence. See infranote 33 [defining odds ratio analysis].14Some have suggested that a period of alternativeconfinement should not be included in the offender’s totalsentence length. This analysis includes periods of alternativeconfinement (home detention or community confinement)because the main independent variable is the presumptivesentence. In zones A, B, and C of the Sentencing Table(USSG §5A), the presumptive sentence can be satisfied by aperiod of alternative confinement. The inclusion ofalternative sentences reduces the likelihood of introducingerror in the statistical analysis due to the relationship of thepresumptive sentence and overall confinement.15In some cases, a mandatory minimum provision limitsthe guideline range. For example, in a drug trafficking casein which a ten year mandatory minimum applies, theguideline minimum cannot be less than 120 months unlessthe offender qualifies for relief from the mandatoryminimum. See USSG §5G1.1(b) (“Where a statutorilyrequired minimum sentence is greater than the maximum ofthe applicable guideline range, the statutorily requiredminimum sentence shall be the guideline sentence.”). Formore information on how the guidelines incorporatemandatory minimum penalty provisions, see Chapter 3 ofthe Commission’s Report to Congress: MandatoryMinimum Penalties in the Federal Criminal Justice System,October 2011.16The offense types (or categories) used in this analysis arebroad in order to ensure a sufficient number of cases. Theseriousness of the several crimes varies within the offensetype categories as does the demographic characteristics ofthe offenders convicted of those crimes. Certain crimeswithin an offense type are punished more severely thanothers (e.g., those crimes involving injury not accounted forunder the sentencing guidelines) and offenders of aparticular demographic group may be disproportionatelyconvicted of those crimes. If so, the offense type variablesused in this analysis may not fully account for the effect onthe sentence length imposed that is attributable to certaincrimes.17This variable refers to whether the offender remainedsubject to a mandatory minimum penalty at sentencing, orwhether the offender obtained relief from the mandatoryminimum penalty and therefore was not subject to amandatory minimum penalty at sentencing (or was neversubject to a mandatory minimum penalty because no suchpenalty applied to the charged offense).18This variable refers to whether the court imposed asentence above or below the guideline range.7
BOOKER REPORT 2012: PART E Age of the offender.The multivariate analyses pair race and g
12.3 percent longer than White male offenders who received a non-government sponsored below range sentence. Differences in sentence length between Hispanic male offenders and White male offenders who received a non-government sponsored below range sentence were statistically significant in