Transcription
If you have issues viewing or accessingthis file contact us at cial Disparities in theCriminal Justice SystemJoan PetersiliaJune 1983jared for\Jational Institute of Corrections,)epartment of Justice12711'1U.S. Department !Jf JusticeNational Institute of Justice; ; o o : i on Origin ting it. Points of view or opinions stat d.been re roduced exactly as received from thein this document are those of the authors and do. not nec ssan yrepresent the official position or policies of the National Institute ofJustice.Permission to reproduce this copyrighted material in microficlle on!}, has been granted by The Kand Corporatlon. M(to the National Criminal Justice Reference Service (NCJRS) .Further reproduction outside of the NCJRS system requires permission of the copyright owner.
PREFACEOver the last three decades, social science researchers have repeatedly addressed the possibility of racial discrimination in thecriminal justice system, but it remains an open question. Because ofproblems with data and methodology, no study has established definitively that the system does or does not discriminate against racialminorities.This two-year study approached the issue by comparing the treatment of white and minority offenders at key decision points in thesystem, from arrest through release from custody, and by investigating possible racial differences in criminal behavior that might influence that treatment. It attempted to overcome the material andmethodological limitations of earlier research in two ways: By using both official records and information from a largesample of prison inmat.('s nhollt nspl'C"t.s of t hl'ir hackground By using multiple regression techniques when possible toanalyze the resulting data, techniques that allow the analystto control for other factors besides race that might affect thesystem's handling of minority offenders.and t:riminal behaviur, andThe study was supported by the National Institute of Corrections,Bureau of Prisons, U.S. Department of Justice. The report should beof interest to criminal justice researchers who are investigating thesystem's operations, and to policymakers who are looking for mechanisms that will ensure equal treatment for offenders. regardless ofrace. Because the study deals with a complex and sensitive issue, thereport describes the data, methodology, and findings in considerable,technical detail. To accommodate readers who are more concernedwith policy than with research, , he report includes a short ExecutiveSummary of the study's conclusivns and policy implications.iii
EXECUTIVE SUMMARYI. INTRODUCTION AND SUMMARYCritics of the criminal justice system view the arrest and imprisonment rates for blacks and other minorities as evidence of racial discrimination. Although the laws governing the system contain noracial bias, these critics claim that where the system allows discretionto criminal justice officials in handling offenders, discrimination can,and often does, enter in. They argue that blacks, for example, whomake up 12 percent of the national population, could not possiblycommit 48 percent of the crime-but that is exactly what their arrestand imprisonment rates imply. Defenders of the system argue thatthe statistics do not lie, and that the system does not discriminate butsimply reacts to the prevalence of crime in the black community.Statistics on street crime lend support to this argument. An astonishing 51 percent of black males living in large cities are arrested atleast once for an index crime during their lives, compared with only14 percent of white males. 1 Fully 18 percent of black males serve time,either as juveniles or adults, compared with 3 percent of white maleslGreenfeld, 1981). Blacks are also disproportionately victimized bycrime: Murder is the leading cause of death for young black males,and is also high for young black females.Crime, then, is a fact of life in the ghetto. Blacks and other minorities must deal with crime and the criminal justice system much morethan whites. Moreover, as crime rates continue to rise, the nation'sovercrowded prisons find their economic nd operational problemscompounded by racial problems. In many prisons, racial gangsmaneuver for dominance and victimize racial minorities-and whitesare often a minority. These conditions have given rise to the questionof racial discrimination; to address it., our study pursued three objectives:To discover whether there is any evidence that the criminaljustice system systematically treats minorities differentlyfrom whites;(2) If then' is such evidencp, t.o S{'{' whpt.h{'1' t.hat. t.n'at.nwnt.represents discrimination or is simply a reaction to theamount of crime committed by minorities: and(1)iBlumstein and Graddy, 1981. Index offenses are murder, rape, robbery, assault,burglary, larceny/theft, auto theft, and arson.v
vi(3) To discuss the policy implications for correcting any bias.METHODOLOGY AND DATASocial science researchers have been addressing the question of discrimination in the system for more than thirty years, but have failedto reach consensus on almost every point. Studies have offered evidence both for and against racial bias in arrest rates, prosecution, conviction, sentencing, corrections, and parole. There are many reasonsfor these contradictions. Some studies have data bases too small topermit any generalization. Others have failed to control for enough(or any) of the other factors that might account for apparent racialdiscrimination. Most studies have looked at only one or two levels ofthe system. And no studies have examined criminals' pre-arrest contact with the system-a point at which many believe the greatest racial differences in treatment exist.We attempted to overcome those shortcomings by using data fromofficial rec9rds and prisoner self-reports, by examining the evidencefor discrimination throughout the criminal justice system, and by controlling for the major variables that might create the appearance ofdiscrimination. Whenever the data were sufficient to do so, we usedmultiple regression analyses of system decisions and criminal behavior to control for the most obvious vari.ables. I:n the comparisons, then,the offenders were somewhat "interchangeable" except for race.The study data came from two sources: the California OffenderBased Transaction Statistics (GBTS) for 1980, and the Rand InmateSurvey RIS). The OBTS is a computerized inIormation system maintained by the California Bureau of Criminal Statistics that tracks theprocessing of offenders from arrest to sentencing. The RIS consists ofdata obtained from self-reports of approximately 1400 male prison inmates in California, Michigan, and Texas.MAJOR FINDINGSWe found some racial differences in both criminal behavior and thetreatment of offenders in the states involved. (See Table S.1.)Racial Differences in Case ProcessingAlthough the case processing system generally treated offenderssimilarly, we found racial differences at two key points: Minority sus-
viiTable S.lSUMMARY OF STUDY FINDINGSEvidence ofaRacial DifferencesElement StudiedOffender BehaviorPreference for different crime types. . .Volume of crime committed . . . .Crime motivation.Type of weapon preferred and extent of its use . :.Victim injury . .Seed for drug and alcohol treatment. . .Seed for vocational training and education . .Assessments of prison program effects . , . ,. 0 0 0A rest---probability of suffering arrest . . . .lihether arrested on warrant or probable cause'" .Probability of having case forwarded to prosecutor* and Sa cingcasp. if; ofric:i.1 I Iy fi Inn'" . , . r '2 ut:ion\,'iI"tl'IPr0 Typ" of chnrg.'" fi It,d':' .()Heasons for nonprosecution* . '" .I.'hether the case is settled by plea bargaining* .Probability of conviction* .,. . . . .Type of crime convicted of* .Typ" of snntnnen impospn'" . ' . ,. 0Lf·II t.hof':"PIILf'II(;"iwplJ!'Ipd. ,.CorrectionsType of programs participated in . . . . .Reasons for not participating in programs. . .Probability of having a work assignment . .Length of sentence served . . . . . . . . . . .Extent and type of prison infractions . .SOCRCES:il(\0 000 The OBTS for starred (*) items; the RIS for all others. IlOIH'; suggtl:.;t,iVCl trend; SUIt.iSLic:.J\ly slgllifi(;ant.pects were more likely than whites to be released after arrest; however, after a felony conviction, minority offenders were more likelythan whites to be given longer sentences and to be put in prison insLl'udor jui I.Racial Differences in Post-Sentencing TreatmentIn considering participation in treatment and work programs andthe reasons inmates gave for not participating, we found no statis-
viiitically significant differences that implied discrimination againstminorities in corrections. However, in looking at length of sentenceserved, we found significant racial differences in California and Texas, but none in Michigan. These findings held even when we controlled for other major factors that might affect release decisions. InCalifornia prisons, blacks and Hispanics serve longer sentences thanwhites-largely, however, because of racial differences in court-imposed sentences. In Texas, minorities also serve longer sentencesappreciably longer than their court-imposed minimum terms. InMichigan the reverse is true. There, blacks enter prison with longersentences than whites, but serve roughly the same time.Racial Similarities in Crime Commission Rates andProbability of ArrestThe high post-arrest release rates for minorities do not indicate thatpolice overarrest minorities in proportion to the kind and amount ofcrime they actually commit. We found that annualized crime commission rates were much the same among white and minority criminals.Moreover, there are no consistent, statistically significant, racial differences in the probability of arrest, given that an offender has committed a crime.Racial Differences in Offender BehaviorThere are some evident racial differences in criminal motivation,weapons use, and prison behavior, but most are not statistically significant. Blacks rated economic distress higher than other motivations, but not significantly more so than other groups. Whites ratedhedonistic motives for crime significantly higher than blacks or Hispanics. In weapons use, there were only two significant findings. Hispanics were much more likely than the other groups to use knives,and black burglars were less likely to be armed. Racial differenceswere strongest in prison behavior. In Texas, blacks had a higher rateof infractions; in California, whites did.CONCLUSIONSThese findings raise some important questions and identify somepatterns that, together with other research, suggest tentative conclusions.
IXDisparities in Release RatesBecause we found that minorities do not have a higher probabilityof arrest, the release rates might be explained by evidentiary problems. Prior research indicates that prosecutors do have greater pr blems making minority cases "stick" because victims often have difficulty identifying minority suspects. Moreover, minority victims andwitnesses often refuse or fail to cooperate after an arrest is made.Some racial differences in release rates may also result from the'factthat police more often arrest white suspects than minority suspects"on warrant." Since the evidentiary criteria for issuing warrants approximate those for filing charges, it seems reasonable that fewerwhites than minorities would be released without charges.Disparities in Sentencing and Time ServedControlling for the other major factors that might influence sentencing and time served, we found that minorities receive harshersentences and serve longer in prison-other things being equal. However, racial differences in plea bargaining and jury trials may explainsome of the difference in length and type of sentence. Plea bargainingresolves a higher percentage of felony cases involving white defendants, whereas jury trials resolve a higher percentage of cases involving minorities. Although plea bargaining ensures conviction, it alsovirtually guarantees a reduced charge or a lighter sentence, or both;conviction by a jury usually results in more severe sentencing.Differences in sentencing and time served may also reflect thekinds of information that judges and parole boards use to make theirdecisions. Research has found that in 80 percent of cases, judges follow the sentencing recommendation made in the probation officer'spre-sentence investigation report (PSR). Moreover, in many states,the PSR becomes the heart of the parole board's case-summary file.These reports are usually very comprehensive "portraits" of offenders,containing personal and socioeconomic information, as well as anydetails the probation officer can get on their criminal habits and attitudes. This information can be, and evidently is, assessed for indicators of recidivism-that is, traits related to the probability that areleased offender will return to crime. Blacks and Hispanics may havemore such traits than whites (e.g., past unemployment).The relation between court-imposed sentence and length of timeserved supports these conjectures. Minorities received longer minimum sentences than whites in all three states. However, that sen-
xtence had varying effects on time finally served. In California, racial .differences in sentence served corresponded roughly to the differencesin court-imposed sentences. In Texas, time served was appreciablylonger for minorities than for whites-and appreciably longer thanthe court-imposed sentence. In Michigan, the reversl!l was true: There,blacks received longer court-imposed sentences than whites, butserved roughly the same time.California has a determinate sentencing policy, which explains therelation of sentence imposed to sentence served there. But the contrast between Texas and Michigan can perhaps be explained by parolepractices. Texas has a highly individualized process that incorporatesthe full range of an inmate's criminal history and personal and socioeconomic characteristics. In contrast, Michigan has adopted a riskassessment formula for parole decisions that relies primarily on indicators of personal culpability such as juvenile record, violence ofconviction crime, and prison behavior. This practice evidently avoidsracial disparities in time served-and may overcome the racial dispar··ity in court-imposed sentences.Nevertheless, overcoming racial disparities in time served is not thEldefinitive objective of parole boards. Their primary responsibility is todecide whether releasing an inmate will endanger society. By ignoring socioeconomic and other extra.legal indicators of recidivism, theymay reduce racial disparities in parole decisions, but they may do soat the expense of putting probable recidivists back on the street.Indicators of RecidivismIf recidivism indicators are valid and explain racial disparities insentencing and time served, the system is not discriminating. It issimply reflecting the larger racial problems of society, and it can dolittle about the overrepresentation of minorities in prison. However,the RIS data and some other research contain suggestions that therecidivism indicators may not be so "racially neutral" after all.Minorities are overrepresented in the criminal popula'i;ion, relativeto their proportion of the national population. However, they do constitute roughly half the criminal population. Thus, within that population, their characteristics should have no more effect on empiricallyderived indicators of recidivism than the characteristics of whiterecidivists-unless minorities have higher crime commission rates.We have found, however, that minorities and whites have similarcrime commission rates, and other research has established thatwhites and minorities have approximately the same probability of
xirecidivism. It is apparent that some indicators of recidivism overlapwith race in ways that deserve investigation.IMPLICATIONS FOR FUTURE RESEARCH ANDPOLICYThese findings and conclusiom;su gt.'sLsonw irnporlanLt'l'Sl';(l'chneeds and policy initiatives. Among the research priorities are: 4&Documenting the reasons for post-arrest/pre-filing releaserates and controlling for race of the offender and type of arrest;Analyzing post-arrest problems with witnesses to discoverwhether and how the race of the suspect andiOr of the witnessaffects cooperation;Determining the relation of plea bargaining and jury trials torace, and why minority defendants are less likely to plea-bargain;.Establishing the reasons why minorities receive and servelonger sen. ences, paying particular attention to effects thatlength of court-imposed sentences, gang-related activities inprison, and prison infractions have on time served.Although these and other issues deserve research attention, we believe that understanding why recidivism indicators more often workagainst minoriti9s has a particularly high priority. The system ismoving to heavier reliance on these i-ndicators precisely to render sentencing and parole decisions more objective. Paradoxically, just theopposite may result if, as we suspect:some of these indicators overlapwith race in ways largely unrelated to recidivism.Definitive policy recommendations will not be possible until some ofthese research tasks are completed, but three interim policy initiati ves may be useful: Police and prosecutors should take into account the obstaclesto filing charges after minority arrests, particularly the problems with witnesses, and try to find ways of ensuring thatpre-arrest identifications will hold firm.Plea bargaining needs close monitoring, perhaps by a singledeputy, for indications that minority defendants are consistently offered less attractive bargains than whites.Until the quality and predictive weight of recidivism indicators can be tested, probation officers, judges, and paroleboards should give more weight to indicators of personal cul-
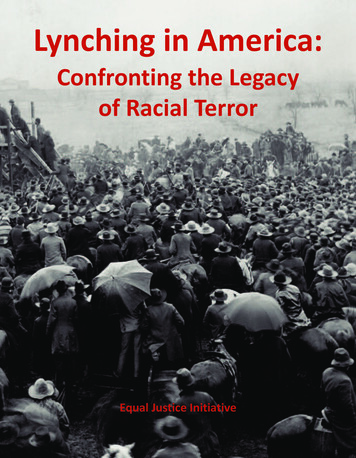
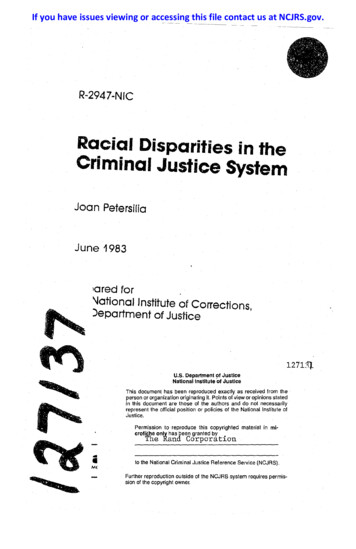
xiipability than to indicators based on group classifications,such as education and family status.Although this study shows that minorities are treated differently ata few points in the criminal justice system, it has not found evidencethat this results from widespread and consistent racial prejudice inthe system. Racial disparities seem to have developed because procedures were adopted without systematic attempts to find out whetherthey might affect different races differently. Consequently, future research and policy should be concerned with looking behind the scenesat the key actors in the system and their decisionmaking process,primarily at the kind of information they use, how valid it is, and·whether its use affects particular racial groups unfairly.II. BACKGROUND, DATA, AND METHODOLOGYBACKGROUNDThe criminal justice system allows policemen, prosecutors, judges,and parole boards a great deal of discretion in handling most criminalcases. The resulting statistics on minorities in prison have convincedmany people that this discretion leads to discrimination. Figure S.lprovides a provocative insight into this issue. Looking at the four topcrimes, we find little disparity between the percentage of blacks arrested and the percentage serving prison terms for the crime. Thesefigures suggest that between arrest and sentencing, at any rate, thecriminal justice system is simply reacting to the relative number ofblacks in the arrest population; however, these violent crimes allowagents of the system less discretion in handling or sentencing. Whenthe crime is murder, forcible rape, robbery, or aggravated assault, ajudge has less latitude in deciding about probation or sentence length,or whether the sentence will be served in jailor prison-no matterwhat color a man is.Disparity crops up when we move down to lesser crimes. The moststriking example is larceny: Blacks account for only 30 percent of thearrest poptllation, but for 51 percent ofthose serving time for larceny.Why the disparity? One explanation may be that judges can exercisemore discretion in dealing with offenders convicted of lesser crimes. Ifso, the numbers lend some credibility to the charge that discretionleads to discrimination.
xiii48%C 348%r57%;:": 144% -- -.r-MurderRapeRobberyAssaultBurglaryLarceny ItheftAuto theftForgery/fraudDrugsOtherTot;i vTc;l t -;;;i e -f- -,51%46·"f-----,Total property crimeAll felonies combined70 60 50 40 30 20 '00U. S. Arrestso'0 20 30 40 SO 60 70U.S. PrisonersFig. S.l-Black percentage of arrests and of prison populationSocial science researchers have repeatedly addressed this issue, butfor every study that finds discrimination, another refutes it. The reasons are various: limited data bases, inability to examine pre-arrestand post-sentencing experiences of offenders, and failure to control forother significant variables.METHODOLOGY AND STUDY DATAAs deRcribed in Sec. I under "Methodology and Dat.a," this st.udyhad the advantage of' two d :h datn I :lSI'S: (,Ill' OB'I'S (O/'li.'ndl'r-BaspdTransaction Statisties) in California for 1980, and correctional reeord:-;of prisoners who participated in the RIS (Rand Inmate Survey), whichwas als,o the source of the self-reports. This information allowed us toanalyze offender behavior and system decisionmaking from crimecommission through release from prison.The OBTS is a computerized information system maintained by theCalifornia Bureau of Criminal Statistics. It tracks offenders frompoint of entry into the criminal justice system to the point of sentencing (or presentencing release). The data cover dispositions that occurin a given year resulting from adult felony arrests made in that yearor previous years. Once an offender enters the system, a number ofsocial and legal variables are recorded: sex, race, age, prior record,criminal status, and the original arrest offense. The OBTS alsorecords the date of arrest and offense, conviction offense, date and
xivpoint of disposition, type of proceeding, type .of final sentence, andlength of prison sentence.With the OBTS data, the study could not only track racial differences in case disposition from arrest to sentencing, but could also con'. trol for factors such as type of crime and prior record. Both of thesefactors are essential in understandirig whether severity of sentence inaverage statistics indicates racial discrimination.The RIS consists of data obtained from a self-administered questionnaire completed by approximately 1380 male prison inmates in California, Michigan, and Texas in 1978. Together, these three stateshouse 22 percent of the national population of state prisons. In eachstate, the survey procedures produced a sample of inmates whosecharacteristics approximated the statewide intake of male p:dsoners.The self-reports elicited information about inmates' crimes, arrests,crimina:i motivations, drug and alcohol use, prior criminal record,prison experience, and the like.Because self-reports inevitably raise questions about the respondents' veracity, the survey was constructed to allow for both internaland external checks on validity. The questionnaire included pairs ofquestions, wipely separated, that asked for essentially the same information about crimes the respondents had committed and about othertopics. This made it possible to check for internal quality (inconsistency, omission, and confusion). Over 83 percent ofthe respondents filledout the questionnaire accurately, completely, and consistently. Theresponses were not anonymous, and the official records served notonly as part of the analysis but also as an external check on the validity of the self-reports. Although the external check revealed more inconsistencies than the internal check, 59 percent of the respondentshad an external error rate of less than 20 percent. However, for mostdisparities, the records were as questionable as the respondents'veracity. Records are often missing or incomplete, through no fault ofthe prisoners.The cross-checking capability also permitted comparisons betweeninmate characteristics and the quality of the self-reports. One mightsuspect that some types of people would be less truthful than others.However, an earlier Rand study using the same data found that, withminor exceptions, such individual characteristics as conviction crime,self-image, activity in fraud or "illegal cons," and sociodemographiccharacteristics, were unrelated to the quality and validity of the response. It also showed no racial differences in validity based on external checks. However, the self-reports of black respondents had lowerinternal quality );han whites' or Hispanics' reports, primarily becauseof inconsistency and confusion rather than omissions (Chaiken andChaiken, 1982).
xvThe RlS data perrniUed us Lo ('xarnirl(' r'i1l'ial din( n'ncl'l' in l'rin\('opposed to arrest ra Lcs--a nd t.ht· probai i liLy ofarrest. This information gave the study a considerable edge overmuch prior research because it provided a standard for assessingcharges that minorities are overarrested. [t also enabled us to examilw questions of discrimination in corrl'ct.iol1s and I(·ngt.h of sl'nl.('n("(·served, and or racial differences in crime motivution, weapon lise, undin-prison behavior.l:()mmi bi()n rute -asIII. MAJOR FIND IN GSAs Table 8.1 indicated, we found some racial differences in thecriminal justice system's handlin,f! of offenders, hut f('w statisticallysignificant racial differences in criminal behavior. However, strongtrends in some of the data raise important issues for policy and futureresearch.CASE PROCESSING: ARREST THROUGH SENTENCINGEach year, more than 1.5 million adults in the United States enterthe felony disposition process. This process. beginning with an arrestand ending with release or sentencing, i::; the heart of the eriminaljustice system. Although a great many people enter the process, veryfew remain at the end: About 30 percent are dismissed before thepreliminary hearing; less than half of those who go to court are convicted; and less thun [) percent of those convicted are sentt nc('d t.oprison (Greenwood, 1982l.Analysis of the OBTS DataAs for racial differences in the disposition process, the OBTS datarevealed an interesting pattern in California. As Table 8.2 shows, atthe front end of the process, the system seems to treat white offendersmore severely and minority offenders more "leniently"; at the backend, t1- e reverse is true.White suspects are somewhat more likely than minority suspects tobe arrested on warrant, and considerably less likely to be releasedwithout charges. Whites are also more likely than blacks or Hispanicsto have felony charges filed. However, a greater percentage of whites
Table 8.2RACIAL DIFFERENCES IN CASE PROCESSINGPercentageaat Each StageStageArresced "on warrant"Arresced "on view"Released without chargesFelony charges filedMisdemeanor charges filedFelony convictionsConvicted by plea bargainTried by jurySentenced to probationSentenced to 320851215894273537198711127aSOURCE: OBTS data for 1980.arrested on felony charges are subsequently charged with misdemeanors, while blacks and Hispanics are less likely to have theseriousness of their cases thus reduced.Once charged, offenders of all races have about the same chance ofbeing convicted of a felony, but white defendants are more likely thanminorities to be convicted by plea bargain . In contrast, minority defendants are more likely than whites to have their felony cases triedby jury. Although plea bargaining, by definition, ensures conviction,it also ensures a reduced charge or a lig'hter sentence, or both. Moreover, prior research indicates that defendants receive harsher sentences after conviction by juries. These differences may contribute tothe racial difference in sentencing. The study found that after a misdemeanor conviction, white defendants had a greater chance thanminority defendants of getting probation instead of jail. After a felonyconviction, minority defendants were somewhat more likely to getprison instead of jail sentences.These aggregate findings treat all felonies as if they were the same.If minority defendants had committed more serious felony offensesand had more serious prior records, we would expect their treatmentto be more severe. Actually, minorities in the 1980 OBTS did have
"""VIIrllO!"(' s('riOUH prior rC'('ordH; a gTl'al.l'r proport.101l of' Ilwlll had 1 1'1'1lcharged with violenL crime; and a greaLer number were on probaLionor parole. However, by controlling for these factors using multipleregression techniques, we determined that the racial differences inpm;l.-arrest and sentencing treatment still held. 1 Whitt, arn'sl./'es weremol'l' likC'ly t.hnn minorit.i( R 1.0 h(' officially chargl,d fidlowing nrrf'sl .HI:ll'k :lI"I"I'SI.I'I'S wI'n' 111\11'1.' likt'l.v to havl' 1.111'11" \':I \'S ·lIlsl\lIss\·1I hyeither police or prosecutor. After charges were filed. the convictionrates were similar across the races, but 4 percent more blackdefendants than whites or Hispanics were sentenced to prison.Analysis of Court-Imposed Sentence Using RIS DataAlthough the scope of our study and our data did not permit us toanalyze casE' processing in all three of the RIS states. it did allow us tocompare data on length of court-imposed sentences. And we preferredto use data that would yield findings on possible racial disparities inthree states rather than only one.
ishing 51 percent of black males living in large cities are arrested at least once for an index crime during their lives, compared with only 14 percent of white males.1 Fully 18 percent of black males s