Transcription
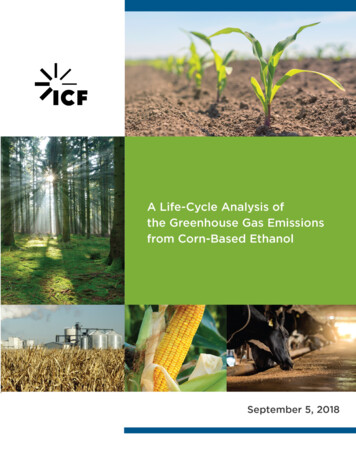
A Report from the Economic Research ServiceUnited StatesDepartmentof AgricultureAES-93June 2016www.ers.usda.govBrazil’s Corn Industry and theEffect on the Seasonal Pattern ofU.S. Corn ExportsEd Allen and Constanza ValdesAbstractThe extraordinary increase in Brazil’s corn production over the past decade—driven by rising global demand and the combined influence of changes inprice, technology, crop management practices, and area harvested—has madethe country the third largest global corn producer and the second largest cornexporter. Brazil has emerged as the largest U.S. competitor in the global cornmarket with second-crop corn, harvested late in the local marketing year, boostingexports from September to January, months traditionally dominated by NorthernHemisphere exporters. Continued competition from Brazilian corn might permanently alter the seasonal pattern of U.S. corn exports, highlighting the need toreassess export forecasting methods. A change in export seasonality could alterthe seasonality of U.S. corn prices, further weakening corn prices at harvest anderoding U.S. export market share.Keywords: United States, Brazil, corn, production, prices, shipments, seasonalityof exportsAcknowledgmentsApproved by USDA’sWorld AgriculturalOutlook BoardThe authors thank Mark Jekanowski, Suzanne Thornsbury, Andrew Muhammad,Mark Ash, Rip Landes, and Linwood Hoffman of USDA, Economic ResearchService, Richard O’Meara, Andrew Sowell, and Renee Schwartz of USDA, ForeignAgricultural Service, Jerry Norton and Michael Jewison of USDA, Office of theChief Economist, and Darrel Good of University of Illinois for their peer reviews,and Chris Dicken of ERS for cartographic output, and Dale Simms of ERS foreditorial assistance, and Lori Fields of ERS for design.
ContentsIntroduction. . . . . . . . . . . . . . . . . . . . . . . . . . . . . . . . . . . . . . . . . . . . . . . . . . . . . . . . . . . . . . . . . . . . 1Brazil’s Corn Industry. . . . . . . . . . . . . . . . . . . . . . . . . . . . . . . . . . . . . . . . . . . . . . . . . . . . . . . . . . . 2Brazil’s Corn Consumption . . . . . . . . . . . . . . . . . . . . . . . . . . . . . . . . . . . . . . . . . . . . . . . . . . . . . . 6Government Support Policies. . . . . . . . . . . . . . . . . . . . . . . . . . . . . . . . . . . . . . . . . . . . . . . . . . . . . 7Brazil’s Corn Exports. . . . . . . . . . . . . . . . . . . . . . . . . . . . . . . . . . . . . . . . . . . . . . . . . . . . . . . . . . 10U.S. and Brazilian Corn Export Competition . . . . . . . . . . . . . . . . . . . . . . . . . . . . . . . . . . . . . . . 12U.S. Corn and Soybean Export History and Seasonality. . . . . . . . . . . . . . . . . . . . . . . . . . . . . . . 13Conclusion. . . . . . . . . . . . . . . . . . . . . . . . . . . . . . . . . . . . . . . . . . . . . . . . . . . . . . . . . . . . . . . . . . . . 18References. . . . . . . . . . . . . . . . . . . . . . . . . . . . . . . . . . . . . . . . . . . . . . . . . . . . . . . . . . . . . . . . . . . . 19In accordance with Federal civil rights law and U.S. Department of Agriculture (USDA) civil rights regulations andpolicies, the USDA, its Agencies, offices, and employees, and institutions participating in or administering USDAprograms are prohibited from discriminating based on race, color, national origin, religion, sex, gender identity(including gender expression), sexual orientation, disability, age, marital status, family/parental status, income derivedfrom a public assistance program, political beliefs, or reprisal or retaliation for prior civil rights activity, in any programor activity conducted or funded by USDA (not all bases apply to all programs). Remedies and complaint filing deadlines vary by program or incident.Persons with disabilities who require alternative means of communication for program information(e.g., Braille, large print, audiotape, American Sign Language, etc.) should contact the responsible Agency or USDA'sTARGET Center at (202) 720-2600 (voice and TTY) or contact USDA through the Federal Relay Service at (800)877-8339. Additionally, program information may be made available in languages other than English.To file a program discrimination complaint, complete the USDA Program Discrimination Complaint Form, AD-3027,found online at How to File a Program Discrimination Complaint and at any USDA office or write a letter addressed toUSDA and provide in the letter all of the information requested in the form. To request a copy of the complaint form,call (866) 632-9992. Submit your completed form or letter to USDA by: (1) mail: U.S. Department of Agriculture,Office of the Assistant Secretary for Civil Rights, 1400 Independence Avenue, SW, Washington, D.C. 20250-9410;(2) fax: (202) 690-7442; or (3) email: program.intake@usda.gov.USDA is an equal opportunity provider, employer, and lender.iiBrazil’s Corn Industry and the Effect on the Seasonal Pattern of U.S. Corn Exports, AES-93Economic Research Service/USDA
IntroductionBrazil has been the world’s third largest global corn producer for decades and the second largestexporter of corn for 2 years (USDA/FASa). Following soybeans, corn is the second largest crop inthe country, with a 20-percent share of planted area, on 15.8 million hectares. Corn accounted for31 percent of Brazil’s non-perennial crop production, or 85 million metric tons (hereafter, “tons”)in 2014/15 (USDA/FASc, IBGE, 2015). With production expanding faster than domestic food andfeed demand, attractive export prices moved most of the increased production into larger exports.Over the past decade (2005/06 to 2014/15), Brazil’s corn export growth averaged 21 percent annually, representing a nearly seven-fold increase in exports since 2005. As a consequence, Brazilbecame the world’s largest corn exporter in 2012/13 (October-September)1 when severe droughtdamaged U.S. production (USDA/FASa). In USDA’s Agricultural Projections to 2025, Brazil isexpected to be the world’s second largest corn exporter over the next 10 years—behind the UnitedStates and ahead of Argentina and Ukraine (USDA/OCE/WAOB, 2016).Double-cropping in Brazil is extensive. In the country’s frontier region in Mato Grosso, first-cropsoybeans are typically followed by second-crop corn, both partly for export. In the traditionalgrowing region of São Paulo, common crop rotations are soybeans-corn and soybeans-cotton(Nassar et al., 2008). U.S. corn producers are wary of larger corn exports from Brazil and the implications for seasonal corn export patterns. Historically, Brazil’s corn export shipments were smalland occurred early in the trade year; since 2009, Brazil’s corn exports have grown and shiftedincreasingly into September-January after its second-crop corn is harvested. In addition, export shipments of Brazilian soybeans occupy most of the available port capacity from March through June,crowding out corn (USDA/FASb).This report describes the evolution of the Brazilian corn sector, the structural changes that haveoccurred in the last decade, and the factors behind Brazil’s expanding corn production includingattractive prices, changes in technology and farm management practices, and locational shifts inproduction. Corn area in Brazil has shifted from the traditional South-Southeast regions to the frontier Center-West, where second-crop corn production has grown rapidly.Second-crop corn (also known as the safrinha, or “little harvest” in Portuguese) was a fitting namein years past but the safrinha corn crop is now larger than the full-season corn crop in Brazil. As aresult, corn exports from Brazil are now greater in September-January than in the prior May-Julyperiod, and this pattern is expected to persist. This new seasonal pattern in Brazil means moreformidable competition in the U.S. corn export market. U.S. corn prices are normally lowest afterharvest and the increased export price competition could exacerbate the harvest-time low.1Internationalcorn trade year.1Brazil’s Corn Industry and the Effect on the Seasonal Pattern of U.S. Corn Exports, AES-93Economic Research Service/USDA
Brazil’s Corn IndustryCorn is Brazil’s most important cereal, followed by rice and wheat. Since 2000/01, Brazil’s cornproduction has doubled, reaching a record 85 million tons in 2014/15, equivalent to 8.4 percent ofglobal corn production (USDA/FASa). Brazil has several advantages in corn production, includingample land and a favorable climate with a long growing season in much of the country that enablestwo harvests per year. Technological advances in soil management and improvements in hybrid cornvarieties have also spurred expansion.Area harvested to corn in Brazil has risen from an average of less than 9 million hectares in the1960s to over 15.8 million hectares in 2015/16, growing an average of 1 percent per year over thepast 5 decades (USDA/FASc). Brazil’s vast land area encompasses many climates. Consequently,corn—mostly yellow dent grain type—is cultivated in all regions, though the timing of planting andharvesting differs between States and across regions (table 1).Table 1Brazil’s 1st and 2nd corn crop calendar by region and StateRegion/State11st crop planting2nd crop planting1st crop harvesting2nd crop -MayJune-JulyCenter-WestMato GrossoMato Grosso SulGoiasSouthParanaRio Grande do SulSoutheastMinas GeraisSao Brazil’s five regions are defined by State boundaries and similar characteristics for climate, topography, soil, and land use.Source: Companhia Nacional de Abastecimento, CONAB, 2015 (CONABa).2Brazil’s Corn Industry and the Effect on the Seasonal Pattern of U.S. Corn Exports, AES-93Economic Research Service/USDA
Corn in Brazil is produced in both tropical and subtropical environments; only 3 percent ofthe national corn area is irrigated and drought stress is frequent on half of the total corn area(IBGE, 2014). The structure of Brazilian agriculture began to change rapidly in the 1970s,prompted by industrialization and economic policies focusing on import substitution. Withinthis framework, self-sufficiency and the development of agriculture were seen as necessaryto ensure an ample food supply for a growing population (Brandão et al., 2006). Brazil alsosought in the 1970s to expand intensive agriculture systems into the country’s Center-WestCerrados.2 This frontier was a vast area of savannahs and grasslands occupying 197 millionhectares suitable for corn, soybean, and cotton production (USDA/FASb, figure 1). Onceregarded as an unproductive region, the adaptation of technologies for acidic and low-fertilitysoils supported the agricultural development of the Cerrados. Moreover, the soybean-corn rotation promotes higher phosphorus use efficiency, boosting yields.Figure 1Brazilian States and regionsBrazilian Statesand ce: Brazilian Institute of Geography and Statistics, 2006.2The Cerrados ecological zone, concentrated in the Center-West region, is characterized by soil, temperature, andrainfall patterns that, with the appropriate technology, are ideally suited to high-yielding second-crop corn productionsince 2011/12.3Brazil’s Corn Industry and the Effect on the Seasonal Pattern of U.S. Corn Exports, AES-93Economic Research Service/USDA
Brazil contains two distinct areas for the production of corn: the traditional Southern andSoutheastern agricultural producing regions, principally the States of Minas Gerais and Paraná; andthe Center-West agricultural frontier, principally the State of Mato Grosso where land is abundantand less expensive (USDA/FASb). In the Southern and Southeastern regions, the bulk of the firstcrop is planted in September and harvested in March and corn yields are typically higher, reflectingbetter seed varieties and highly capitalized farmers (USDA/FASb). First-crop corn is mostlydestined for the nearby domestic animal feed market, so planting flexibility is limited by localdemand for feed from swine and poultry producers (USDA/FASb).In Mato Grosso, second-crop corn is planted beginning in January after the first-season soybeanharvest (USDA/FASb). Mato Grosso is now the largest producer of second crop-corn and plantedarea has increased greatly as a result of technological improvements, including the use of lime toreduce acidity levels in the soil and the adoption of no-tillage systems. While the onset of the dryseason in the later stages of growth limits second-crop yield potential somewhat, double croppingspreads fixed costs over two crops, enhancing profitability.However, the most significant driver of corn cultivation in the Center-West region of Brazil,since the 1960s, has been EMBRAPA’s (Brazil’s Ministry of Agriculture Research Company)development of cultivars better suited to a tropical climate—high yielding corn hybrids andsoybean varieties that have complemented the correction of nutrient deficiencies in low-fertilityCerrados soils (USDA/FASb). These technological advances made it possible to cultivatemarginally suitable soils, resulting in a large expansion of Brazil’s agricultural frontier sincethe 1970s (Brandão et al., 2006). Regulations constrain planting soybeans after soybeans inorder to control diseases. Some other crops, including cotton, compete with corn to be doublecropped after soybeans, but corn is predominant.In Mato Grosso, the area planted to second-crop corn following soybeans quadrupled between2005 and 2015, and this safrinha crop increased from 22 percent of total corn production in2004/05 to more than 64 percent of production in 2014/15 (figure 2). Mato Grosso in 2014/15accounted for nearly 25 percent of Brazil’s corn production (table 2). The second-crop cornharvest largely serves the export market (USDA/FASb); corn production has outpaced domesticuse each year since 2005/06.4Brazil’s Corn Industry and the Effect on the Seasonal Pattern of U.S. Corn Exports, AES-93Economic Research Service/USDA
Figure 2Brazil’s corn production and exports, 2000/01-2014/151,000 tons (Corn production)1,000 tons (Corn azil first-crop 202000/010Brazil total exportsBrazil second-crop cornNote: Exports are on the October-September trade year.Source: USDA, Foreign Agricultural Service, PS&D Database (USDA/FASc), and Companhia Nacional deAbastecimiento (CONAB), 2015.Table 2Corn area, yields, and production by region and State, 2010/11-2014/15Area planted to cornMajor /15Hectares (1,000)Brazil %Tons/ha(1,000 tons)Averageannual 5.815,863Minas onal region1São 7642.3%3.42,773548537489472412-6.8%6.83,189Santa .6%5.420,763Mato Grosso do SulMato 1,2421,2161,2411,2637.8%6.58,9341Paraná,Rio Grande do Sul, Santa Catarina, Espíritu Santo, Minas Gerais, Rio de Janeiro, São Paulo, Alagoas, Bahia Ceará, Paraíba,Pernambuco, Rio Grande do Norte, and Sergipe.2Goiás,Mato Grosso do Sul, Mato Grosso, Maranhão, Piauí, Acre, Amazonas, Amapá, Pará, Rondônia, Roraima, and Tocantins.Source: Companhia Nacional de Abastecimento, 2015 (CONABa).5Brazil’s Corn Industry and the Effect on the Seasonal Pattern of U.S. Corn Exports, AES-93Economic Research Service/USDA
Brazil’s Corn ConsumptionBrazil is also one of the world’s largest consumers of corn, ranking fourth in 2013/14 andaccounting for 6 percent of world use. Use of corn has grown substantially over the last 15 years(2000/01-2014/15), supported mostly by feed use. Brazil is the world’s leading meat exporterand, with a large population and rising incomes, also has growing domestic demand for meat.Broiler meat production in 2015 was an estimated 13.1 million tons and swine meat 3.5 milliontons (USDA/FASc). Aquaculture use of corn as feed, though smaller, is a rapid growth market(USDA/FASb).Brazil’s feed and residual use of corn grew 5.3 percent per year from 2006/07 to 2010/11. Sincethen, growth has been slower due to high corn prices and a slowdown in meat exports. Residual use(including losses) has likely expanded with larger crops. Food, seed, and industrial (FSI) use of cornis much smaller than the feed/residual component, and grew an estimated 3.7 percent annually from2000 to 2015 (figure 3). Industrial use includes a wide variety of corn processing, with corn starch asignificant input for industrial manufacturing and food processing. Food use is significant, as corn isthe traditional grain consumed in much of Brazil, but per capita consumption is declining as higherincomes lead to substitution with protein-based and other preferred foods. Seed use increases withcorn area, but is very small compared to other uses.Figure 3Brazil’s corn production and use, 2000-151,000 tons90,000Feed and 765052004202003/0/043/02022001/0202000/010Source: USDA, Foreign Agricultural Service, PS&D Database (USDA/FASc).6Brazil’s Corn Industry and the Effect on the Seasonal Pattern of U.S. Corn Exports, AES-93Economic Research Service/USDA
Government Support PoliciesBrazil’s support for the corn sector has been similar to most other agricultural commodities,consisting of two major components: subsidized credit and price support (minimum guaranteedprices). Policies to provide subsidized credit for production and marketing, implemented in the1960s through the early 1990s, facilitated the development of commercial agriculture and expansioninto the Cerrados frontier. With economic reforms in the early 1990s, the Government decreasedsubsidized credit but created new programs linked to the support of guaranteed minimum prices forcorn (Brandão et al., 2006).Brazil’s system of minimum guaranteed prices for corn revolves around auctions of premiums,which are the difference between minimum guaranteed prices and market prices. The minimumguaranteed prices for the various regions of Brazil, and the portion of the crop that will beeligible for these programs, are announced annually in the Brazilian agricultural economic plan(MAPA, 2015). The leading price support program for corn in Brazil is the Premium EqualizerPaid to the Producer program (PEPRO-Prêmio Equalizador Pago ao Produtor), which paysfarmers directly when commodity prices fall below a predetermined price (CONAB, 2015b).Under PEPRO, all eligible crops must be either exported or shipped to designated regions inorder to receive the premiums.Under the PEPRO program, public auctions are organized by the national food supply agency—CONAB—to establish an auction price based on a minimum price and a premium for commercial buyers. The PEPRO program subsidizes transactions by paying a premium to commercialbuyers, which is the difference between the minimum price (received by producers) and themarket price (USDA/FASb). This mechanism allows the Government to manage the supply ofcorn in deficit regions and for export, but without buying the product directly (USDA/FASb).The system of minimum prices and government tenders to commercial buyers encourages cornfarmers to continue producing despite falling domestic market prices (figure 4). This programis registered with the WTO as an “amber box” measure and total notified amber box outlaysremain within permitted levels.Under the PEPRO program, the Government of Brazil held auctions to sell more than 21 milliontons of corn—produced in Mato Grosso, Bahia, Goiás, Mato Grosso do Sul, Minas Gerais, Paraná,and Tocantins—from 2006 to 2014. Most PEPRO payments have gone to second-crop cornproducers in Mato Grosso, with total payments costing more than 500 million (table 3).7Brazil’s Corn Industry and the Effect on the Seasonal Pattern of U.S. Corn Exports, AES-93Economic Research Service/USDA
Figure 4Brazil’s corn minimum price, market price, and PEPRO support, 2005-2014Real per 60 kg25201510Corn producer price in Mato Grosso5Minimum corn producer price in Mato GrossoCorn PEPRO premiumNote: PEPRO Prêmio Equalizador Pago ao Produtor.Source: USDA, Economic Research Service using data from Companhia Nacional de Abastecimento,CONAB, 2015 (CONABb).8Brazil’s Corn Industry and the Effect on the Seasonal Pattern of U.S. Corn Exports, AES-93Economic Research 21/1/20050
Table 3Brazil’s PEPRO Government support program for corn, 2006-2014Volume ofcorn auctions(tons)2006OctoberNovemberGovernment spending onPEPRO program( million)Premium( per 7Averagepremium, 28/ton2007MayJuneJulyAugustTotalNote: PEPRO Prêmio Equalizador Pago ao Produtor. The PEPRO program was not used in 2008, 2011, 2012, and 2015.Source: USDA, Economic Research Service using data from Companhia Nacional de Abastecimento, CONAB, 2015(CONABb).9Brazil’s Corn Industry and the Effect on the Seasonal Pattern of U.S. Corn Exports, AES-93Economic Research Service/USDA
Brazil’s Corn ExportsBrazil’s corn exports were small prior to 2000/01, when they jumped to 6.3 million tons. Theseasonal pattern of Brazil’s corn exports has shifted and grown more pronounced over the last 5years (figure 5), with a larger portion exported from August to January, months when harvestingbegins and supplies peak in the Northern Hemisphere.Soybean trade patterns influence corn trade. Because soybeans are more valuable per ton anddenser than corn, they are cheaper to transport. Their higher value also makes them more expensive to store, whether due to financing costs or opportunity costs associated with holding thecommodity. These factors tend to give soybeans priority access to logistical infrastructure; whentransportation and handling bottlenecks occur, most notably port congestion in Brazil, soybeansget priority. While bottlenecks are less binding in the United States, soybeans are still likely toget priority access to handling/transportation capacity during peak harvest, which occurs almostsimultaneously for both crops.Brazil tends to use most of the first-crop corn (harvested primarily during February-April) domestically because it is grown near the poultry and pork enterprises in the South. Since transport costs forsecond-crop corn are about the same between the interior/poultry areas in the South and the oceanports, second-crop corn has been more heavily exported than first-crop corn. The second-crop cornis also harvested primarily during June-August, just as the peak soybean export period ends, freeingup port capacity.Brazil exported 24.3 million tons and 24.9 million tons of corn during the 2011/12 and 2012/13(local March-February) marketing years, more than double any previous year as the droughtreduced 2012 U.S. harvest reduced world supplies and drove corn prices to record levels. Assecond-crop corn production expanded to meet this demand, the seasonal pattern of Braziliancorn exports also changed.Over the last 5 years, the seasonality of corn exports has grown more pronounced, with MarchJuly shipments relatively low (less than 5 percent of annual exports per month) and AugustJanuary exports brisk (with over 12 percent per month for August through January). For the latest5 years, March-July corn exports have been a smaller share of annual exports than in the previous10 years (figure 5).10Brazil’s Corn Industry and the Effect on the Seasonal Pattern of U.S. Corn Exports, AES-93Economic Research Service/USDA
Figure 5Brazil’s corn export seasonality, 2000/01-2013/14Monthly share of annual total (%)162000-2009, 10-year average142010-2014, 5-year ource: USDA, Economic Research Service using data from Global Trade Information Services, GTIS, 2015.11Brazil’s Corn Industry and the Effect on the Seasonal Pattern of U.S. Corn Exports, AES-93Economic Research Service/USDAFeb
U.S. and Brazilian Corn Export CompetitionBrazil’s share of world corn trade jumped from 12.2 percent in 2011/12 to 25.9 percent the followingyear. Brazil’s increased share may represent a permanent shift in the structure of the world cornmarket, and not just a short-term response to the U.S. drought in 2012. For the 2015/16 OctoberSeptember trade year, Brazil is projected to have record corn exports, exceeding the 2012/13 share.The 2015/16 situation is being driven largely by Brazil’s sharp currency depreciation, especially relative to the U.S. dollar. USDA’s Agricultural Projections to 2025 assume that Brazil will remain thesecond largest corn exporter through the next decade, with a small increase in export market sharefrom 2016/17 to 2024/25, though Brazil’s share of trade is expected below recent highs.Before 2011/12, Argentina was a much larger corn exporter than any other foreign competitor, butin 2011/12, responding to strong global demand and high prices, both Brazil and Ukraine expandedcorn exports. For the decade before December 2015, Argentina’s Government policy—especiallyexport quotas on corn—severely limited the growth in Argentina’s corn production and exports,allowing Brazil’s corn exports to overtake Argentina (figure 6).Argentina’s corn and soybean exports are traditionally strongest and prices most competitive shortlyafter harvest, which spans several months after February and, unlike Brazil, is counterseasonal toU.S. corn exports. The seasonality of Argentina’s corn exports has been influenced by the portion ofthe corn crop that is late-planted, the exchange rate and other economic incentives to move or holdcorn, and the timing of export quotas. The recent elimination of Argentina’s corn export quotas andexport taxes is expected to heighten competition in the global corn market at a time when Brazil,Argentina, and Ukraine all have weak currencies relative to the U.S. dollar. This further supportstheir ability to compete with U.S. corn on price. Modest growth in global corn trade is expected tofocus attention on shifting export market shares.Figure 6World corn exports, 1998/99-2014/15Million tons140United States120BrazilArgentinaUkraineRest of the 3/02022001/02000/0100209/1991998/990Source: USDA, Foreign Agricultural Service, PS&D Database (USDA/FASc).12Brazil’s Corn Industry and the Effect on the Seasonal Pattern of U.S. Corn Exports, AES-93Economic Research Service/USDA
U.S. Corn and Soybean Export History and SeasonalityU.S. corn exports may be affected in the longer term by the emergence of Brazil as a major competitor (figure 7). In addition to taking some market share from the United States, the expansion ofBrazil’s production and exportable surplus of corn appears to have changed the seasonal pattern ofU.S. monthly corn exports. The seasonal pattern of Brazil’s corn exports in recent years has begunto mirror the export pattern for Brazil’s soybeans.As competition from Brazil’s corn exports has become more intense, the seasonality of U.S. corntrade has also begun to mirror the seasonal pattern of U.S. soybean trade. Brazil’s soybean exportshave historically been concentrated in post-harvest months, especially April, May, June, and July(figure 8). Meanwhile, U.S. soybean exports have grown more pronounced in October, November,December, and January (figure 9). As the volume of South American exports has increased andthe U.S. share of world soybean trade has declined, U.S. shipments have become more concentrated in the early months of the U.S. marketing year. The trade patterns reflect a market-basedresponse to price by importers, caused by differing harvest-time lows in the Northern and SouthernHemispheres. A modest price difference is enough to get key buyers such as China to switchorigins. With most exports occurring in the first half of the local marketing year, fewer soybeanstocks need to be held into the second half, both in Brazil and the United States.As Brazil’s soybean harvest reaches ports beginning in February, port capacity is devoted more tosoybeans and less to corn, promoting larger March-June U.S. corn exports. At the end of February,March, and April 2014, U.S. outstanding sales of corn reached record levels for ea
Brazil’s Corn Industry and the Effect on the Seasonal Pattern of U.S. Corn Exports, AES-93 Economic Research Service/USDA Introduction Brazil has been the world’s third largest global corn producer for decades and the second largest exporter of corn for 2 years (USDA/FASa

