Transcription
(2022) 21:99Mpina et al. Malaria alaria JournalOpen AccessRESEARCHDiagnostic performance and comparisonof ultrasensitive and conventionalrapid diagnostic test, thick blood smearand quantitative PCR for detectionof low‑density Plasmodium falciparum infectionsduring a controlled human malaria infectionstudy in Equatorial GuineaMaxmillian Mpina1,2,3* , Thomas C. Stabler1,2, Tobias Schindler1,2, Jose Raso4,5, Anna Deal1,2,Ludmila Acuche Pupu4, Elizabeth Nyakarungu3,4, Maria del Carmen Ovono Davis4, Vicente Urbano4,5,Ali Mtoro3,4, Ali Hamad3,4, Maria Silvia A. Lopez4,5, Beltran Pasialo4,5, Marta Alene Owono Eyang4,5,Matilde Riloha Rivas5, Carlos Cortes Falla4, Guillermo A. García6, Juan Carlos Momo4,5, Raul Chuquiyauri4,7,Elizabeth Saverino7, L. W. Preston Church7, B. Kim lee Sim7, Bonifacio Manguire8, Marcel Tanner1,2,Carl Maas8, Salim Abdulla3, Peter F. Billingsley7, Stephen L. Hoffman7, Said Jongo3,4, Thomas L. Richie7† andClaudia A. Daubenberger1,2*†AbstractBackground: Progress towards malaria elimination has stagnated, partly because infections persisting at low parasitedensities comprise a large reservoir contributing to ongoing malaria transmission and are difficult to detect. This studycompared the performance of an ultrasensitive rapid diagnostic test (uRDT) designed to detect low density infectionsto a conventional RDT (cRDT), expert microscopy using Giemsa-stained thick blood smears (TBS), and quantitativepolymerase chain reaction (qPCR) during a controlled human malaria infection (CHMI) study conducted in malariaexposed adults (NCT03590340).Methods: Blood samples were collected from healthy Equatoguineans aged 18–35 years beginning on day 8 afterCHMI with 3.2 103 cryopreserved, infectious Plasmodium falciparum sporozoites (PfSPZ Challenge, strain NF54)administered by direct venous inoculation. qPCR (18s ribosomal DNA), uRDT (Alere Malaria Ag P.f.), cRDT [Carestart*Correspondence: mmpina@ihi.or.tz; claudia.daubenberger@swisstph.ch†Thomas L. Richie and Claudia A. Daubenberger contributed equally tothis work1Swiss Tropical and Public Health Institute, Basel, SwitzerlandFull list of author information is available at the end of the article The Author(s) 2022. Open Access This article is licensed under a Creative Commons Attribution 4.0 International License, whichpermits use, sharing, adaptation, distribution and reproduction in any medium or format, as long as you give appropriate credit to theoriginal author(s) and the source, provide a link to the Creative Commons licence, and indicate if changes were made. The images orother third party material in this article are included in the article’s Creative Commons licence, unless indicated otherwise in a credit lineto the material. If material is not included in the article’s Creative Commons licence and your intended use is not permitted by statutoryregulation or exceeds the permitted use, you will need to obtain permission directly from the copyright holder. To view a copy of thislicence, visit http:// creat iveco mmons. org/ licen ses/ by/4. 0/. The Creative Commons Public Domain Dedication waiver (http:// creat iveco mmons. org/ publi cdoma in/ zero/1. 0/) applies to the data made available in this article, unless otherwise stated in a credit line to the data.
Mpina et al. Malaria Journal(2022) 21:99Page 2 of 14Malaria Pf/PAN (PfHRP2/pLDH)], and TBS were performed daily until the volunteer became TBS positive and treatmentwas administered. qPCR was the reference for the presence of Plasmodium falciparum parasites.Results: 279 samples were collected from 24 participants; 123 were positive by qPCR. TBS detected 24/123 (19.5%sensitivity [95% CI 13.1–27.8%]), uRDT 21/123 (17.1% sensitivity [95% CI 11.1–25.1%]), cRDT 10/123 (8.1% sensitivity[95% CI 4.2–14.8%]); all were 100% specific and did not detect any positive samples not detected by qPCR. TBS anduRDT were more sensitive than cRDT (TBS vs. cRDT p 0.015; uRDT vs. cRDT p 0.053), detecting parasitaemias aslow as 3.7 parasites/µL (p/µL) (TBS and uRDT) compared to 5.6 p/µL (cRDT) based on TBS density measurements.TBS, uRDT and cRDT did not detect any of the 70/123 samples positive by qPCR below 5.86 p/µL, the qPCR densitycorresponding to 3.7 p/µL by TBS. The median prepatent periods in days (ranges) were 14.5 (10–20), 18.0 (15–28), 18.0(15–20) and 18.0 (16–24) for qPCR, TBS, uRDT and cRDT, respectively; qPCR detected parasitaemia significantly earlier(3.5 days) than the other tests.Conclusions: TBS and uRDT had similar sensitivities, both were more sensitive than cRDT, and neither matched qPCRfor detecting low density parasitaemia. uRDT could be considered an alternative to TBS in selected applications, suchas CHMI or field diagnosis, where qualitative, dichotomous results for malaria infection might be sufficient.Keywords: Malaria, Rapid diagnostic test, Controlled human malaria infection, Thick blood smear, Low parasitedensity infections, Malaria pre-exposureBackgroundOver the past decade, malaria treatment and vector control interventions have significantly decreased malariaburden worldwide. The global incidence rate of malariadecreased between 2010 and 2018 from 71 to 57 casesper 1000 people at risk [1]. However, during 2020, thefirst full year of the COVID-19 pandemic, the WorldHealth Organization (WHO) World Malaria Reportdocumented an increment of 14 million annual malariacases and 69,000 additional deaths compared to 2019,much of this attributable to COVID-19-related interruption of malaria control and medical services [2]. Asignificant challenge faced by malaria control and elimination projects is addressing transmission potential fromlow parasite density carriers with mild or no symptoms.Low parasite density carriers are estimated to accountfor 20–50% of human-to-mosquito transmission [3]. Itwould be beneficial to have a rapid test able to identifythese infections.Current widely deployed diagnostic tools such as conventional rapid diagnostic tests (cRDTs) are affordableand have user-friendly formats and function. In 2018,259 million cRDTs were distributed mainly in sub-Saharan Africa and utilized to examine suspected malariacases [1]. cRDTs test for the presence of histidine-richprotein 2 (PfHRP2), an antigen specific to Plasmodiumfalciparum, and many iterations of the test also includea pan-malaria antigen (PAN) common to all 4 majormalaria species such as lactate dehydrogenase (LDH).While cRDTs are affordable, provide quick and readableresults, and require little training to operate, they cannotdetect low-density infections, which can occur frequentlyin low transmission areas [3–5]. As a result, efforts areunderway to develop advanced malaria rapid diagnostictests that are more sensitive and effective at identifyinglow-density P. falciparum infections [6, 7].Laboratory-based techniques such as thick bloodsmear (TBS) and polymerase chain reaction (PCR) areconsidered to have greater sensitivity than cRDTs [8].Historically, TBS has been the gold standard for malariadiagnosis. When performed by expert microscopistsreading 0.5 µL of blood, detection may range typicallybetween 10 and 50 parasites per microlitre (p/µL), andunder carefully controlled CHMI and TBS preparationconditions, expert microscopists can quantify parasite densities at the theoretical lower limit of detectionfor this blood volume, 2 p/µL. In contrast, cRDTs havereported detection limits of 100–200 p/µL of blood infield studies [9–11]. TBS has the additional advantagesof diagnosing infections even in the presence of parasites carrying PfHRP2 deletions, a challenge that RDTmanufacturers are currently facing [12, 13], and allowing detection of all species of malaria parasite. In recentyears, the further development of the quantitative polymerase chain reaction (qPCR) method has enabled thedetection of low parasite densities that frequently goundetected by cRDTs and TBS [14, 15]. Utilizing qPCR,reservoirs of low parasite density cases can be identifiedand treated, which is an essential component for elimination in low transmission areas [8, 16–18]. The drawbackof both TBS and qPCR is the need for specialized laboratory equipment, materials and well-trained staff, whichare often in short supply in low income countries, making them unfeasible for use under field conditions on alarge scale [19, 20]. TBS can also lead to false negativeresults when performed by a non-competent microscopist, the parasitaemia is low or there are multiple-speciesco-infections [21, 22]. An ideal diagnostic tool would
Mpina et al. Malaria Journal(2022) 21:99combine the sensitivity of qPCR with the affordabilityand simplicity of the cRDT.An ultrasensitive RDT (uRDT; Alere Malaria Ag P.f.)has recently been developed and offered as a reliablediagnostic tool that can be used in clinical studies and infield operations [23–25]. Similar to conventional RTDs[cRDTs, such as Carestart Malaria Pf/PAN (PfHRP2/pLDH)] in form and function, the uRDT detects PfHRP2in P. falciparum, but at greater sensitivity, identifyingdensities as low as 0.1–1.0 p/µL in culture-derived samples [7, 23]. This more sensitive RDT, which has beendescribed as being capable of detecting low parasitedensity infections, could target these low-density infections for treatment [26]. If the sensitivity reported isconfirmed, it could also be used in clinical trials of antimalarial drugs or vaccines to document protection following CHMI or natural P. falciparum exposure [27–29].To date, limited literature exists systematically examining the performance of the uRDT in direct comparisonto cRDTs, TBS and qPCR in samples collected from individuals with low parasite density [30, 31]. Existing investigations have been conducted predominantly in the fieldwhere it is difficult to monitor factors such as timings ofinfectious mosquito bites and the waxing and waning ofparasite densities [24, 31–35].A new approach to conducting controlled humanmalaria infection (CHMI) using P. falciparum sporozoites (PfSPZ) has become available over the past five years,based on administering aseptic, purified, cryopreserved,infectious PfSPZ (Sanaria PfSPZ Challenge) [36]. Inthis model, PfSPZ are administered by syringe, replacingmosquito bite administration, and the study subjects arethen monitored in the standard way [37]. The advantagesare that CHMI can be performed by institutions without an insectary or without the need to import infectedmosquitoes, the dose of PfSPZ can be standardized, andCHMI can be administered at any time without coordinated mosquito infections. The use of cryopreservedinfectious PfSPZ is thus similar to the use of cryostabilates for induced blood stage malaria (IBSM), a controlled human infection model that bypasses the SPZ andliver stages and is similarly free of constraints [38]. CHMIusing PfSPZ Challenge is now being utilized extensivelyto evaluate efficacy of anti-malarial drugs and vaccinesin malaria-naive and malaria pre-exposed populations[39–45].CHMI using injectable PfSPZ provides an opportunityto assess malaria diagnostics under carefully controlledconditions in malaria exposed populations. The exactexposure time is known, the induced infections gradually increase in density, and the time of first detection andassociated prepatent period can be precisely determined.The aim of this study was to systematically evaluate andPage 3 of 14compare uRDT (Alere Malaria Ag P.f.) performanceagainst three other commonly used malaria diagnostic tools using whole blood samples collected daily frommalaria pre-exposed individuals undergoing CHMI.MethodsStudy siteThe Bioko Island Malaria Elimination Program (BIMEP)focuses on developing malaria vaccines and other interventions to decrease malaria-attributable morbidityand mortality on Bioko Island, Equatorial Guinea [46].BIMEP performs various activities on Bioko such as indepth epidemiological studies and clinical trials of themalaria vaccine candidates Sanaria PfSPZ Vaccine andPfSPZ-CVac [44, 47, 48] to collect data on safety and efficacy to support vaccine licensure. In 2018, the BIMEPconducted a regimen optimization trial of PfSPZ Vaccine (ClinicalTrials.gov ID: NCT03590340) at the BaneyResearch Facility that involved 104 healthy Equatoguinean adults male and female, aged 18–35 years [49].Study volunteers were recruited from Baney district andthe city of Malabo, and were enrolled after providinginformed consent. Homologous (the strain of P. falciparum in PfSPZ Challenge, PfNF54, was the same as in thevaccine) CHMI with 3.2 103 PfSPZ was administeredto 95 eligible individuals, 6 to 7 weeks after last vaccination and the observation period was conducted in a hotelat the La Paz Hospital beginning eight days after PfSPZChallenge injection.Malaria rapid diagnostic testsMalaria rapid diagnostic tests were performed with frozen venous whole blood samples anticoagulated withEDTA and stored at 80 C. Blood samples were allowedto thaw slowly and equilibrate to ambient temperaturefor at least 30 min before performing the RDT. The commercially available cRDT [Carestart malaria Pf/PAN(PfHRP2/pLDH) Ag Combo, ACCESSBIO, USA (Lot#MR18F63, expiration: 30th Nov, 2020)] and uRDT [theAlere Malaria Ag Pf, Standard Diagnostic Inc., Republicof Korea (Lot# 05LDE001A, expiration: 20th Feb, 2020)]were used throughout the study. Both tests have similar manufacturer instruction workflows, requiring 5 µLblood to be applied to the RDT, followed by addition ofthe assay buffer and incubation for 20 min. After incubation, diagnosis was determined by the appearance oflines in the test result window. A single control line wasconsidered malaria negative, a line for both control andtest were considered malaria positive, and no lines, neither control nor test, was considered an invalid test. Twoto three readers were involved in determining each RDTresult, the third added when there were discrepanciesbetween the first two readers. The samples were analysed
Mpina et al. Malaria Journal(2022) 21:99in batches of 10 by a first reader and the developed RDTswere then given to a second reader to confirm the reading of the first reader. Any discrepancy between first andsecond readers was resolved using a third reader within aperiod of 20 1 min. Results were recorded in the database as binary figures with zero representing negativesand one representing positives. Five fresh known malariapositive and five fresh known negative samples were usedfor quality control for the performance of the assay andfor training the technicians prior to conducting the study.Thick blood smear for quantification of PlasmodiumfalciparumTwo millilitres of fresh whole venous blood from studyparticipants were used for the preparation of TBS.The TBS was prepared by evenly spreading 10 µL offresh whole venous blood into a 1 cm 2 cm rectangle.The smears were air dried, stained for 45 min using 4%Giemsa stain and rinsed with buffered water, pH 7.2.The slides were dried and read using a light microscopewith a high-power field (immersion oil, 100 objective)of 0.18 mm diameter. 6 1 cm passes equivalent to 0.54µL of blood or 24 1 cm passes equivalent to 2.14 µL ofblood for symptomatic volunteers were read before a TBSwas declared positive or negative. The slides were read bytwo independent expert microscopists and any discrepancies were resolved by a third microscopist. For Giemsastaining quality control, known positive and negative thinblood smears were included at the beginning of the dayand analysed for both parasites and cell staining colourand quality according to a standard operating procedure.Only Giemsa stain that passed the quality control procedures was allowed to be used for the slide staining on thatday. Microscopes were maintained on a daily basis.Quantification of P. falciparum parasite densityby polymerase chain reaction (qPCR)DNA was extracted directly from 180 µL of freshly collected venous whole blood using Quick-DNA Miniprepkits (Zymo Research, Irvine, USA) and eluted with 50µL of elution buffer as recommended by manufacturer.DNA samples were kept at 20 C until analysis usingthe Bio-Rad CFX96 Real-Time PCR System (Bio-RadLaboratories, California, USA). The PlasQ assay previously described by Schindler et al. [50] was used forquantification of Plasmodium spp. and P. falciparumparasites in the venous blood sample. This multiplexassay targets two independent Plasmodium genesnamely the Pan-Plasmodium 18 S rDNA sequence(Pspp18S) and the P. falciparum-specific acidic terminal sequence of the var genes (PfvarATS). The humanRibonuclease P gene (HsRNaseP) was used as a DNAextraction and qPCR amplification control. All qPCRPage 4 of 14assays were run in duplicate and both non-templatecontrol (molecular grade nuclease-free water) and P.falciparum 3D7 DNA were included in each PCR runas negative and positive controls, respectively. For theparasite density estimation, a serial dilution was madeaccording to the 1st WHO International Standard forP. falciparum DNA Amplification Technique (NIBSCcode: 04/176) to establish a calibration curve with theparasite densities ranging between 0.01 and 10,000p/µL. The actual parasite density of the tested sample by qPCR was then estimated from the calibrationcurve’s y-intercept and slope. The lower limit of detection for this qPCR assay was 50 copies/mL. The sample was considered P. falciparum positive if each of thetwo replicates for both PfvarATS and 18 S RNA genetargets had quantitation cycles (Cq) 40 and Cq 28for qPCR amplification control (HsRNaseP). In caseof a discrepancy between duplicates, the assay wasrepeated, with at least two positive replicates out offour considered a positive result. The final results wereused for the qPCR-based estimate of parasite density.Controlled human malaria infection (CHMI)From October 2018 to March 2019, 95 healthy Equatoguinean adults underwent CHMI [49]. Prior to CHMI, afull 3-day course of artemether/lumefantrine treatmentwas given to all volunteers. Eligibility criteria for CHMIwere met if volunteers had received a complete regimenof PfSPZ Vaccine and were negative for malaria infection at the time of CHMI. During the ward observationperiod, volunteers were monitored daily for P. falciparumparasitaemia starting on day 8 to detect the parasite earlyand prevent the development of symptoms. Two millilitres of venous whole blood were collected in EDTA tubesdaily on days 8–20 post-infection and transported to thelaboratory in cooling boxes (4–8 C) within 30 min of collection. One mL blood was used for examining malariaparasites positivity and density by TBS and qPCR within4 h of collection and 1 mL was stored at 80 C for 8months before retrospectively analysing samples usinguRDT and cRDT. The standard artemether/lumefantrinetreatment was given to subjects once malaria parasiteswere detected by TBS or on day 28 post CHMI for volunteers who remained negative throughout the postCHMI follow-up period. Positive TBS results confirmedby qPCR were used as the end-point for initiating participant malaria treatment and termination of ward visits and further diagnostic sample collection. Volunteersdiagnosed as malaria positive by TBS during 28 days ofCHMI follow-up were considered eligible for participation in this malaria diagnostics study.
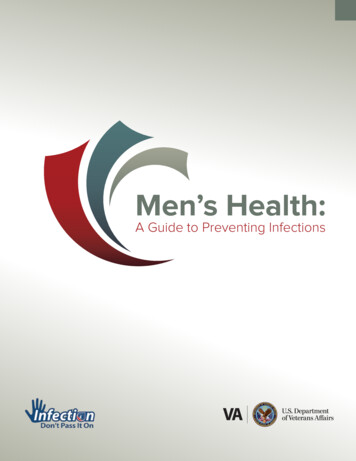
Mpina et al. Malaria Journal(2022) 21:99Sampling and statistical analysesThe aim of this study was to demonstrate differences inperformance sensitivity between TBS, cRDT, and uRDTmethods in detecting low density malaria infection, usingqPCR as the gold standard for sensitivity. To obtain sufficient samples, Epi Info 7 software was used to calculatethe sample size assuming the following parameters: minimum sensitivity of 90% for a reference method (qPCR)and 80% for cRDT, a 95% confidence and 90% power todetect a maximum sensitivity difference of 10%. cRDTwas used to determine sample size due to its wider application in the field [51]. This gave a minimum requiredsample size of 267 samples. Sensitivity of the various testswas compared using Fisher’s exact test.Participating individuals were to be observed from day8 after challenge until the day of first positivity by TBS.Tests were not performed on samples collected afterTBS diagnosis since volunteers were treated and positiveresults could still occur for RDTs and qPCR due to residual parasite material, which would confound results. Outof the eligible volunteers, a subset of 24 individuals wereto be randomly selected to meet sample size requirements while maintaining the distribution of parasitedensities observed using qPCR. Considering the low sensitivity of most cRDTs at 100 p/µL, a stratified randomsampling method was selected, whereby samples withparasite density 100 p/µL and 100 p/µL as detected byqPCR were put into two different strata. Using MicrosoftExcel (2016), simple random sampling was performedwithin each stratum to obtain a total of 24 individuals.To assess the distributions of the complete set, sampledand unsampled subsets were examined to ensure thatthey presented similar structure. Sampled individualsprovided a total of 279 observed individual sample timepoints.For this analysis, a multiplex qPCR targeting Pspp18Sand PfvarATS was designated as the reference for detection of infection against which TBS, uRDT and cRDTpositivity could be compared. A two-tailed Fishers exacttest was used to determine the significant differencesbetween the sensitivities of the various diagnostic tests.In this study, all samples were included in the sensitivityanalysis of diagnostics. Only positive samples by eitherTBS, uRDT and cRDT were included in the analyses ofthe overall geometric mean (geomean) of parasite densityof positive results and the geomean of parasite density attime of first detection (prepatent period). If a TBS, uRDTor cRDT test was negative, the respective sample pointwas deemed not applicable for the geomean parasite density and time to first detection analysis. TBS and qPCRboth provided density measurements but TBS was considered to be more reliable as it did not involve conversion from gene copy number using a reference standard.Page 5 of 14Results were recorded by trained and qualified laboratory staff on case report forms (CRFs) during the CHMIward observation period and later entered onto an Excelspreadsheet (Microsoft, Office 2019 Ver 16). All samples were assigned a sample specific number that waslinked to each volunteer ID. No personal informationwas recorded on laboratory CRFs and for the laboratorystaff the connection of each sample with the corresponding donor volunteer was not possible. Retrospective RDTresults were recorded on the same Excel spreadsheet. Thegeomean and geomean confidence intervals of parasitedensities were calculated using R 4.0.1. Sensitivity and95% confidence intervals for all diagnostic methods werecalculated in R 4.0.1 using the epiR package [52].ResultsOverviewA total of 48 volunteers were diagnosed positive formalaria by reference method (qPCR), qualifying them forinclusion in the malaria diagnostic comparison. Individuals had an average of 12 time points of observation-days(range 8 to 17), with each day-test-record representing anindependent observation since each was obtained from anewly collected whole blood sample. Out of the eligiblevolunteers, 24 (50%) individuals were randomly selectedwhile maintaining the distribution of parasite densitiesobserved using qPCR. The subset of selected samples wasevaluated against unselected samples by parasite densitydistribution and variance and the selected subset wasdetermined to be an appropriate representation (Additional file 1: Figs. S1–S3).A total of 279 samples were collected from the 24selected study participants; 123 and 156 samples werepositive and negative for P. falciparum infection byqPCR, respectively. All 156 samples negative for P. falciparum by qPCR were also negative by TBS, uRDT andcRDT demonstrating 100% specificity for these tests. Intotal, 24 of 123 positive samples were detected by TBS, 21by uRDT and 10 by cRDT, providing sensitivities of 19.5%(95% CI 13.1–27.8%), 17.1% (95% CI 11.1–25.1%), and8.1% (95% CI 4.2–14.8%), respectively. qPCR detectedmore positives than any of the other tests (p 0.001) andTBS and uRDT were both more sensitive than cRDT(TBS vs. cRDT, p 0.015 by Fishers Exact two-tailed;uRDT vs. cRDT, p 0.053). TBS detected 61.9% (13/21)of uRDT positive infections, while uRDT detected 54.2%(13/24) of TBS positive infections. The uRDT detected100% (10/10) of cRDT positive infections while TBSdetected 90% (9/10). The cRDT detected 47.6% (10/21) ofuRDT positive infections and 37.5% (9/24) of TBS positive infections. The summary of the findings are depictedin a Venn-diagram (Fig. 1).
Mpina et al. Malaria Journal(2022) 21:99Page 6 of 14Fig. 1 Similarities and discrepancies in detection of P. falciparumcases by different diagnostic methods. Venn-diagram showingdistribution of positive results according to the diagnostic test usedwith qPCR as the reference method. All samples were sorted by thickblood smear (TBS), ultrasensitive rapid diagnostic test (uRDT), andconventional rapid diagnostic test (cRDT). All cases were low parasitedensity P. falciparum infections that occurred during CHMIParasite density by qPCR was calculated using a standard curve generated using a WHO reference sample thatrelated copy number to density, and ranged from 0.14to 603.8 p/µL, with a geomean of 2.57 p/µL. Using thisscale TBS detected parasites in the range of 5.9–603.8 p/µL (geomean 97.6 p/µL) and uRDT detected parasites inthe range of 0.8–603.8 p/µL (geomean 103.4 p/µL), compared to cRDT, which detected parasites in the range of2.6–603.8 p/µL (geomean 149.4 p/µL) (Table 1).Parasite density by TBS ranged from 3.7 to 201.8 p/µL(geomean 12.81 p/µL). Using this scale, uRDT detectedparasites in the range of 3.7–201.8 p/µL (geomean 20.6 p/µL), compared to cRDT, which detected parasites in therange of 5.6–201.8 p/µL (geomean 30.2 p/µL) (Table 2).Examining just infections positive by both qPCR andTBS, the geomean ratio established from parasite densityof qPCR and TBS (qPCR/TBS) was 7.62 p/µL (Table 3).PCR detects gene copy number in a specimen and eachP. falciparum genome has at least 5–8 copies [53], andin addition qPCR can detect free DNA in a specimens.These variables make it difficult to calculate parasite density accurately using qPCR, even when using a standardcurve to convert copy numbers to density based on aWHO reference sample. TBS detects parasites, regardless of how many genes and nuclei are present, but ishindered by the possible loss of significant numbers ofparasites during processing [54]. All these factors weresuspected to have contributed to the higher densitiesfound using qPCR compared to TBS.Table 1 Overall geomean and sensitivity of TBS, uRDT, and cRDT compared to the qPCR methodDiagnostic testTBS ( )TBS ( )uRDT ( )uRDT ( )cRDT ( )cRDT ( )TotalPCR Pf ( )24992110210113123PCR Pf ( )0156015601561562552125810269279Total24Range of positivesamples (p/µL byqPCR)5.9–603.80.8–603.82.6–603.8Geomean of positivesamples (p/µL byqPCR)97.6103.4149.4Sensitivity (%)19.5% (13.1–27.8)17.1% (11.1–25.1)8.1% (4.2–14.8)Number of positive and negative samples, overall geomean and sensitivity of TBS, uRDT, and cRDT compared to the reference qPCR method. All cases were lowparasite density infections that occurred during CHMI. Parasite densities of positive samples by qPCR ranged from 0.14–603.84 p/µLTable 2 Overall geomean and sensitivity of uRDT and cRDT compared to the TBS methodDiagnostic testuRDT ( )uRDT ( )cRDT ( )cRDT ( )TotalTBS ( )131191524TBS ( )82471254255Total2125810269279Geomean of positive samples (p/µL by TBS)20.630.2Sensitivity (%)54.2% (33.2–73.8)37.5% (19.6–59.2)Overall geomean, sensitivity and number of positive and negative samples of uRDT, and cRDT compared to TBS. All cases occurred during CHMI. Parasite densities ofpositive samples by TBS ranged from 3.7 to 201.8 p/µL
Mpina et al. Malaria Journal(2022) 21:99Page 7 of 14Table 3 Overall geomean, ranges and the ratio of parasitedensity established from qPCR and TBSqPCR (Pf/µL)TBS (Pf/µL)Ratio 3.70–201.80][0.07–53.84]Comparison of geomean, ranges and the ratio of parasite density establishedfrom qPCR and TBS using paired samples in which both tests were positive. Allcases were low parasite density infections that occurred during CHMI. The Ratiowas determined by dividing the geomean of qPCR by geomean of TBS (qPCR/TBS). N 24Next, the diagnostic test sensitivities of TBS, uRDTand cRDT were stratified by ranges of parasite densityof qPCR (Table 4). None of the three diagnostic testsdetected P. falciparum infections below 1 p/µL as determined by qPCR. For TBS, the lowest parasite densitydetected as quantified by qPCR was 5.86 p/µL and asquantified by TBS was 3.7 p/µL. At parasite densities of1–50 p/µL, uRDT and TBS appeared roughly equallysensitive and both appeared more sensitive than cRDT.At parasite densities of 51–100 p/µL by qPCR, uRDTappeared more sensitive (71% [95% CI 29–96%]) compared to TBS and cRDT with, 29% (4–71%) and 29%(4–71%) sensitivity, respectively. However, numberswere small and differences in sensitivity amongst thetests across the density categories were not statisticallysignificant.Finally, the uRDT and cRDT diagnostic test sensitivities were stratified by ranges of parasite density measuredby TBS (Table 5). At parasite densities range between 1and 50 p/µL, uRDT had higher sensitivity compared tocRDT; 33% (95% CI 12–62) for 1–10 p/µL and 100% (95%CI 48–100) at 11–50 p/µL compared to 13% (95% CI2–40) for 1–10 p/µL and 80% (95% CI 28–99) at 11–50p/µL respectively. Above 50 p/µL, both uRDT and cRDThad the same sensitivity but again numbers were toosmall to allow a meaningful comparison.Finally, the range and distribution of parasite densitiesof samples d
An ultrasensitive RDT (uRDT; Alere Malaria Ag P.f.) has recently been developed and oered as a reliable diagnostic tool that can be used in clinical studies and in eld operations [23-25]. Similar to conventional RTDs [cRDTs, such as Carestart Malaria Pf/PAN (PfHRP2/ pLDH)] in form and function, the uRDT detects PfHRP2