Transcription
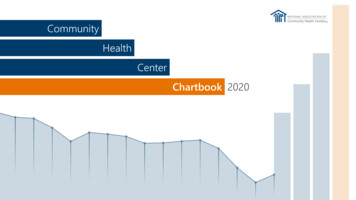
CommunityHealthCenterChartbook 2020
About Community Health CentersThe National Association of Community Health Centers (NACHC) is pleased to present the Community Health CenterChartbook, an overview of the Health Center Program and the communities they serve. Health centers began over fiftyyears ago as part of President Lyndon B. Johnson’s “War on Poverty.” Their aim then, as it is now, is to provideaffordable, high quality, comprehensive primary care to medically underserved populations, regardless of theirinsurance status or ability to pay for services. A growing number of health centers also provide dental, behavioralhealth, pharmacy, and other important services. No two health centers are alike, but they all share one common purpose:to provide coordinated, culturally competent, and community-directed primary and preventive health care services.Health centers play a critical role in the U.S. health care system, delivering care to 29 million* people today. Across thecountry, health centers produce positive results for their patients and for the communities they serve. They stand asevidence that communities can improve health, reduce health disparities, and generate taxpayer savings. They deal with amultitude of costly and significant public health and social problems, including substance use disorder, mental illness,natural disasters, and homelessness – if they have the resources to do so. Federal and state support, along with adequatethird party reimbursement, are critically important to keep pace with escalating health care needs and rising costs amongpopulations served by health centers.Whom health centers serve, what they do, and their impressive record of accomplishments in keeping communitieshealthy are represented in this chartbook.* Includes patients of federally-funded health centers, look-alikes, and expected patient growth for 2019.
About this ChartbookThe Community Health Center Chartbook highlights important research and data on Health Center ProgramGrantees, as well as other Federally-Qualified Health Centers (FQHCs). In this document, unless otherwise noted,the term “health center” is generally used to refer to organizations that receive grants under the Health CenterProgram as authorized under section 330 of the Public Health Service Act, as amended (referred to as“grantees”). Data and research sources can be found at the bottom of each figure. Most slides draw from theUniform Data System (UDS) maintained by the Bureau of Primary Health Care, HRSA, DHHS. UDS data included inthis chartbook are limited to health centers that meet the federal grant requirements and receive federal fundingfrom the Bureau of Primary Health Care. For more information about UDS data, visithttps://bphc.hrsa.gov/uds/datacenter.aspx.
Table of ContentsSection 1: Who Health Centers alth Centers Serve 1 in 12 People in the U.S.Health Centers Serve Many Special PopulationsHealth Centers Serve Greater Proportions of Special PopulationsHealth Center Patients are Predominately Low-IncomeMost Health Center Patients are Uninsured or Publicly InsuredHealth Center Patients’ Health Insurance Coverage is Unique Among Ambulatory Care ProvidersHealth Centers Serve More Medicare and Medicaid Dual Eligibles than Other Ambulatory Care ProvidersHealth Center Patients are Disproportionately Poor, Uninsured, and Publicly InsuredHealth Center Patients are Disproportionately Members of Racial/Ethnic Minority GroupsHealth Center Patients Suffer from Chronic Conditions at Higher Rates than the General PopulationHealth Center Patients are Growing Increasingly Complex, with Higher Rates of Chronic Conditions than in Previous YearsHealth Centers Serve Patients Throughout the Life CycleHealth Center Patients Ages 65 and Older are the Fastest Growing Age GroupSection 2: Expanding Access to Care2-12-22-32-42-5Number of Federally-Funded Health Center Organizations by State, 2018Growth in Health Center Organizations and Sites, 2009 – 2018Growth in Health Center Patients and Visits, 2009 – 2018Health Centers Have Expanded Their Capacity To Provide More Services OnsiteHealth Centers Have Higher Rates of Accepting New Patients Compared to Other Primary Care Providers
Table of ContentsSection 2: Expanding Access to Care (Continued )2-62-72-8Health Center Patients by Insurance Status, 2009 – 2018Percent of Medicaid Beneficiaries Served by Health Centers, 2018Percent of Uninsured Population Served by Health Centers, 2018Section 3: High Quality Care and Reducing Health Disparities3-13-23-33-43-53-63-73-83-9Health Centers Achieve Higher Rates of Hypertension and Diabetes Control than the National Average, Despite ServingMore At-Risk PatientsMany Health Centers Exceed Healthy People 2020 GoalsHealth Center Patients Have Lower Rates of Low Birth Weight than Their U.S. Counterparts, Despite Serving More At-RiskPatientsHealth Center Patients are More Satisfied with Care Received Compared to Low-Income Patients NationallyEnabling Services are a Defining Characteristic of Health Centers and Help Improve Access to Care and PatientSatisfactionHealth Centers Exceed Medicaid Managed Care Organization High Performance Benchmark ScoresHealth Centers Provide More Preventive Services than Other Primary Care ProvidersWomen at Health Centers are More Likely to Receive Mammograms than Their Counterparts NationallyWomen at Health Centers are More Likely to Receive Pap Smears than Their Counterparts Nationally
Table of ContentsSection 3: High Quality Care and Reducing Health Disparities (Continued )3-103-113-123-13Health Center Patients are More Likely to Receive Colorectal Cancer Screenings than Their Counterparts NationallyHealth Centers Perform Better on Ambulatory Care Quality Measures than Private Practice PhysiciansHealth Centers Provide More Value-Driven Care Compared to Private PracticesPercent of Health Centers with Patient-Centered Medical Home Recognition, July 2019Section 4: Cost-Effective Care4-14-24-34-44-54-64-74-84-94-10Health Centers are Increasingly Participating in New Payment and Delivery System ModelsHealth Centers Save 24% Per Medicaid Patient Compared to Other ProvidersHealth Centers Have Lower Total Spending Per Medicaid Patient Compared to Other ProvidersHealth Center Medicaid Revenues as a Percent of Total Medicaid ExpendituresHealth Centers are Associated with Lower Total Costs of Care for Medicare Patients Compared to Other ProvidersMedicare Spending is Lower in Areas Where Health Centers Serve More Low-Income ResidentsHealth Centers Save 35% Per Child Compared to Other ProvidersHealth Centers Save 1,263 (24%) Per Patient Per YearHealth Centers’ Average Daily Cost Per Patient is Lower than Other Physician SettingsHealth Centers are Economic Drivers by Promoting Growth in Local and State Economies
Table of ContentsSection 5: Health Center Staffing and 35-145-155-16Growth in Health Center Clinical Staff, 2009 – 2018Health Center Care Team Staff Provide a Broad Array of ServicesHealth Center Medical Services Staff, 2018Health Centers are Hiring Non-Physician Providers at Higher Rates than PhysiciansHealth Center Enabling Services and Other Programs Staff, 2018Percent of Health Centers Offering Case Management Services Onsite, 2018Health Center Dental Staff, 2018Percent of Health Centers Offering Dental Services Onsite, 2018Health Center Behavioral Health Staff, 2018Percent of Health Centers Offering Behavioral Health Services Onsite, 2018Health Centers Have Responded to an Increasing Need For Substance Use Disorder (SUD) Treatment and Therapy ByBuilding Their Capacity and Integrating CarePercent of Health Centers with Staff Authorized to Provide Medication-Assisted Treatment (MAT) for Opioid Use Disorder,2018Health Centers Have Responded to an Increasing Need for Substance Use Disorder (SUD) Treatment and Therapy bySeeing More PatientsPercent of Health Centers Offering Vision Services Onsite, 2018Percent of Health Centers Offering Pharmacy Services Onsite, 2018Percent of Health Centers Offering Four or More Services Onsite, in Addition to Medical Care
Table of ContentsSection 5: Health Center Services and Staffing (Continued.)5-175-185-195-205-21Percent of Health Centers Using TelehealthHealth Centers are Using Telehealth to Expand Access to Needed ServicesHealth Centers are Adopting Innovative Telehealth Services at Higher Rates than Other Primary Care ProvidersPercent of Health Centers Using Telehealth for Interacting with Patients, 2018Percent of Health Centers Using Telehealth for eConsults with Other Providers, 2018Section 6: Challenges in Meeting Demand for Care6-16-26-36-46-56-66-76-86-9Payments from Third Party Payers are Less than CostFederal Health Center Appropriation History, FY10 – FY19Health Center Operating Margins are Less than Hospital Operating MarginsHealth Center Funding Per Uninsured Patient Is Well Below Total Per Patient CostHealth Centers Experience Difficulty Recruiting Many Clinical StaffHealth Centers Have Unique Challenges Recruiting and Retaining StaffHealth Centers Face Barriers to Offering Telehealth ServicesEstimated Percent of County Residents Experiencing Shortages of Primary Care PhysiciansHealth Center Capital Project Plans and Funding Needs
Section 1Who Health Centers Serve
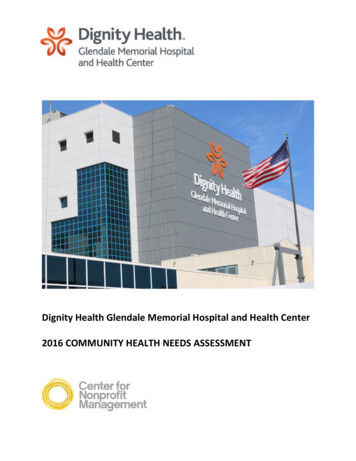
Figure 1-1Health Centers Serve1 in 12 People in the U.S.Including 1 in 9 Children1 in 7 Racial/Ethnic Minorities1 in 5 Medicaid Beneficiaries1 in 5 Uninsured Persons1 in 3 People in PovertySources: (1) NACHC, 2019. Based on 2018 Uniform Data System data on federally-funded and look-alike health centers, estimates for annual patient growth, and national data sources. (2) Bureau ofPrimary Health Care. 2019. Health Center Program Fact Sheet. Available from ut/healthcenterfactsheet.pdf
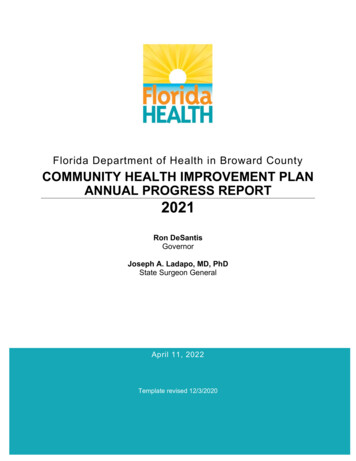
Figure 1-2Health Centers Serve Many Special Populations385,222Veterans819,177School-Based HealthCenter Patients995,232Agricultural sness4,415,160Public HousingPatients6,706,410Patients Best Served in a LanguageOther than EnglishSource: 2018 Uniform Data System. Bureau of Primary Health Care, HRSA, DHHS.
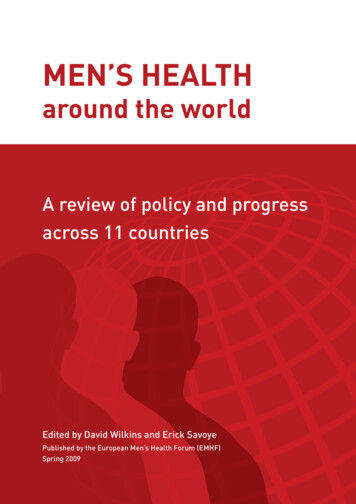
Figure 1-3Health Centers Serve Greater Proportions of Special PopulationsU.S. PopulationHealth Center Population16%5%4%0.9%Agricultural Workers0.2%Individuals Experiencing Homelessness0.6%Residents of Public Housing** Health center population defined as residents of public housing includes all patients served at a health center located in or immediately accessible to a public housing site.Sources: (1) 2018 Uniform Data System, Bureau of Primary Health Care, HRSA, DHHS. (2) Legal Services Corporation: Agricultural-Worker Population Estimates, Final Estimates, July 2016. (3) U.S.Department of Housing and Urban Development. The 2018 Annual Homeless Assessment Report (AHAR) to Congress, December 2018. (4) U.S. Department of Housing and Urban Development.Picture of Subsidized Households Dataset, 2018.
Figure 1-4Health Center Patients are Predominately Low-Income101 - 150% FPL91% of health center patientsare in or near poverty.16%151 - 200% FPL8%Over 200% FPL9%100% FPL and Below68%Notes: FPL federal poverty level. Percentages of health center patients in each category are based on patients with known income. Figures may not sum to 100% due to rounding.Source: 2018 Uniform Data System, Bureau of Primary Health Care, HRSA, DHHS.
Figure 1-5Most Health Center Patients are Uninsured or Publicly Insured48%82% of health center patients areuninsured or publicly insured.23%18%10%1%MedicaidUninsuredMedicareOther Public InsurancePrivate InsuranceNote: Percentage for “Other Public Insurance” includes non-Medicaid CHIP, or coverage where states contract CHIP through private third-party payers and not Medicaid.Source: 2018 Uniform Data System, Bureau of Primary Health Care, HRSA, DHHS.
Figure 1-6Health Center Patients’ Health Insurance CoverageIs Unique Among Ambulatory Care ProvidersPrivate Insurance18%10%Other / %34%Medicaid3%14%CHCEmergency DepartmentPrivate PhysicianNotes: Percentages may not add to 100% due to rounding and private physician and emergency department numbers allow for more than one category to be indicated. Dual eligible patient visitswere removed from the Medicaid category in NAMCS/NHAMCS data for private physicians and emergency department visits. This was done to be more comparable with conventional groupings ofMedicare and Medicaid patients when reporting UDS data for health centers.Sources: (1) 2018 Uniform Data System, Bureau of Primary Health Care, HRSA, DHHS. (2) National Ambulatory Medical Care Survey, 2016. Table 6. Expected Sources of Payment at Office Visits. UnitedStates, 2016. National Center for Health Statistics. (3) National Hospital Ambulatory Survey, 2015. Table 6. Expected Sources of Payment at Emergency Department Visits: United States, 2016.
Figure 1-7Health Centers Serve More Medicare and Medicaid Dual EligiblesThan Other Ambulatory Care Providers100%Medicare OnlyDual EligiblePatientsNationally, 20% of theMedicare population isdually enrolled in Medicaid.Total Medicare PatientsPatients39%21%6%0%CHCEmergency DepartmentPrivate PhysicianSources: (1) 2018 Uniform Data System, Bureau of Primary Health Care, HRSA, DHHS. (2) National Hospital Ambulatory Survey, 2016. Table 6. Expected Sources of Payment at Emergency DepartmentVisits: United States, 2015. National Center for Health Statistics. (3) National Ambulatory Medical Care Survey, 2016. Table 6. Expected Sources of Payment at Office Visits: United States, 2016.National Center for Health Statistics. (4) Centers for Medicare and Medicaid Services Medicare-Medicaid Coordination Office, December 2018. Data Analysis Brief: Medicare-Medicaid DualEnrollment 2006 through 2017. Note: Used for national estimate of national dual eligible population.
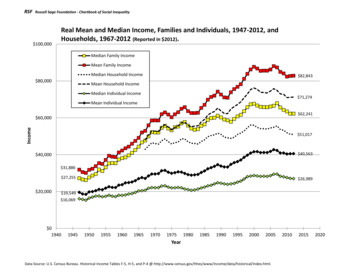
Figure 1-8Health Center Patients areDisproportionately Poor, Uninsured, and Publicly Insured91%U.S. PopulationHealth Center Population68%48%30%23%13%Under 200% FPLAt or Below 100% FPL15%Medicaid*9%UninsuredNote: FPL federal poverty level.* Medicaid alone and not in combination with other insurance.Sources: (1) 2018 Uniform Data System, Bureau of Primary Health Care, HRSA, DHHS. (2) U.S. Census Bureau, 2018 American Community Survey 1-Year Estimates, Tables B17002, S2704, and DP03.
Figure 1-9Health Center Patients areDisproportionately Members of Racial/Ethnic Minority GroupsHealth Center PopulationHispanic / Latino13%Asian American / Native Hawaiian /5%6%Pacific IslanderMultiracialAmerican Indian / Alaska NativeWhite, Non-Hispanic36%18%African American / Black3%3%U.S. Population22%Nationally, 63% of the health center patients aremembers of racial/ethnic minorities comparedto 40% of the general U.S. population.1.4%0.9%41%60%Notes: Figures may not add to 100% due to rounding and patients of Hispanic ethnicity can identify with any racial category. Based on known race and/or ethnicity.Sources: (1) 2018 Uniform Data System, Bureau of Primary Health Care, HRSA, DHHS. Note: National racial/ethnic minority estimate calculated using the Reference Guide for UDS Data ReportsAvailable to Health Centers, CY 2018, Bureau of Primary Health Care, HRSA, DHHS. (2) U.S. Census Bureau, 2018 American Community Survey 1-Year Estimates, Table B03002.
Figure 1-10Health Center Patients Suffer from Chronic ConditionsAt Higher Rates than the General PopulationU.S. PopulationHealth CenterPercent of AdultsReporting:Percent of Adults who Report Ever Being Told They Have:45%32%42%42%36%21%14%HypertensionHigh CholesterolAsthma21%18%11%Diabetes*Health is Fairor Poor* Other than during pregnancy.Note: Includes only adult population ages 18 and older.Sources: (1) 2014 Health Center Patient Survey. Bureau of Primary Health Care, HRSA, DHHS. (2) Kaiser Family Foundation. Health Status Indicators. 2015. Note: Used for High Cholesterol,Hypertension, Diabetes, and Self-Reported Health Status. Centers for Disease Control and Prevention. (3) Behavioral Risk Factor Surveillance System. BRFSS Prevalence Trends and Data. 2016. Note:Used for Asthma; estimate is the median crude prevalence rate for all U.S. States, Territories, and D.C.
Figure 1-11Health Center Patients are Growing Increasingly Complex,With Higher Rates of Chronic Conditions than in Previous YearsPercent Growth in Health Center Patients Diagnosed with Selected Chronic Conditions, 2013 - stance Use es25%Growth in Total Patients0%20132014201520162017* COPD chronic obstructive pulmonary disease** Excludes tobacco and alcohol use disordersSource: National Association of Community Health Centers. Health Centers are Providing Care to Growing Numbers of Patients with Complex Needs. May 2019. Available h-fact-sheets-and-infographics/
Figure 1-12Health Centers Serve Patients Through the Life CycleSelected Age Groups, Represented Two WaysAges 65 9%Ages 45-6424%Ages 20-4433%Ages 65 (9%)100%90%Ages 45-6424%80%70%60%Ages 13-178%Ages 5-1214%Ages 18-193%Under 59%Ages 18-4436%50%40%30%Under 1831%20%10%0%Source: 2018 Uniform Data System, Bureau of Primary Health Care, HRSA, DHHS.
Figure 1-13Health Center Patients Ages 65 and OlderAre the Fastest Growing Age GroupNumber of Health Center Patients by Age Group, 2013 - Ages 18 – 4427% GrowthUnder 1827% GrowthAges 45-6431% Growth5,254,539Ages 65 61% Growth2,601,5721,616,0622013Source: 2013 & 2018 Uniform Data System, Bureau of Primary Health Care, HRSA, DHHS.2018
Section 2Expanding Access to Care
Figure 2-1Number of Federally-Funded Health Center Organizations, 2018Nationally, there are1,362 federallyfunded healthcenter es: Binned by quantile for states and territories shown. National figure includes health centers in every state, territory, and D.C. Territories are not shown in the map above. The followingterritories have 1 grantee: Guam, American Samoa, Northern Mariana Islands, Palau, and Marshall Islands. The Virgin Islands has 2 grantees. The Federal States of Micronesia has 4 grantees.Source: 2018 Uniform Data System, Bureau of Primary Health Care, HRSA, DHHS.
Figure 2-2Growth in Health Center Organizations and Sites, 2009 - 2018SitesHealth Center Grantee 10201120122013Source: 2009 - 2018 Uniform Data System, Bureau of Primary Health Care, HRSA, DHHS.20142015201620172018Service Delivery SitesGrantees
Figure 2-3Growth in Health Center Patients and Visits, 2009 - 2018Total Patient VisitsTotal Patients (In 12010080601040520002009201020112012Source: 2009 - 2018 Uniform Data System, Bureau of Primary Health Care, HRSA, DHHS.201320142015201620172018Total Visits (In Millions)Total Patients
Figure 2-4Health Centers Have Expanded Their CapacityTo Provide More Services OnsiteNumber of Health Centers Employing Staff for Selected Services28% Growth2010 (1,124 total)56% Growth1,3491,2922018 (1,362 total)64% Growth inOffering Four orMore AncillaryServices Onsite31% Growth1,1231,05382885743% Growth**63171% Growth442199Enabling Services* Behavioral HealthDentalPharmacy**341Vision661402Four or MoreServices**** The Health Resources and Services Administration (HRSA) defines enabling services as, “non-clinical services that do not include direct patient services that enable individuals to access health careand improve health outcomes.“ Examples of enabling services include case management, translation/interpretation, transportation, and health education. (HRSA Health Center Program Terms andDefinitions, n.d.).** Pharmacy services only include staff employed by health centers and do not include contract pharmacies operating in health center sites.*** Four or more services are based on service types provided in the chart: enabling services, behavioral health, dental, pharmacy, and/or vision. The maximum number of services is five.Source: 2010 & 2018 Uniform Data System, Bureau of Primary Health Care, HRSA, DHHS.
Figure 2-5Health Centers Have Higher Rates of Accepting New PatientsCompared to Other Ambulatory Care ProvidersPrivate Practice PhysiciansNew Medicaid PatientsNew Medicare PatientsNew Private Insurance PatientsNew Self-Pay / Uninsured PatientsAny New PatientsHealth Centers73%99%87%97%92%93%95%99%95%99%Sources: NACHC analysis of (1) 2013 National Ambulatory Medical Care Survey – Community Health Centers Sample. National Center for Health Statistics. 2013 National Ambulatory Medical CareSurvey and 2013 National Ambulatory Medical Care Survey. National Center for Health Statistics. Note: Used for Private Practice Physician estimates.
Figure 2-6Health Center Patients by Insurance Status, 2009 – 2018(In 14201520162017Source: 2009 - 2018 Uniform Data System. Bureau of Primary Health Care, HRSA, DHHS.6.46.2Other2.70.32018
Figure 2-7Percent of Medicaid Beneficiaries Served by Health Centers, tionally, health centersserve 19% of all Medicaidbeneficiaries.Notes: National figure excludes health center Medicaid patients in territories and does not include Puerto Rico. Binned by quantile for states and territories shown. See Figure 4-4 to see health centerMedicaid revenues as a percent of total Medicaid expenditures.Sources: NACHC Analysis of (1) 2018 Uniform Data System (UDS). Bureau of Primary Health Care, HRSA, BPHC. (2) Kaiser Family Foundation. Monthly Medicaid and CHIP Enrollment, December 2018.(3) Puerto Rico estimate based on NACHC analysis of 2018 UDS and U.S. Census Bureau, 2018 American Community Survey 1-Year Estimates, Table S2704.
Figure 2-8Percent of the Uninsured Population Served by Health Centers, ationally, health centersprovide care to 22% of theuninsured population.Notes: National figure includes health centers in every state, DC, and Puerto Rico. Binned by quantile for states and territories shown.Sources: (1) NACHC Analysis of 2018 Uniform Data System, Bureau of Primary Health Care, HRSA, DHHS. (2) U.S. Census Bureau. 2018 American Community Survey, 1-Year Estimates, Table S2701.
Section 3High Quality Care and Reducing Health Disparities
Figure 3-1Health Centers Achieve Higher Rates ofHypertension and Diabetes Control than the National Average,Despite Serving More At-Risk Patients*National57%63%% of Population with Hypertension Under Control**Health Center67%60%% of Population with Diabetes Under Control**** To see a comparison of the prevalence of chronic conditions for health center patients, see Figures 1-10 and 1-11.** Estimated percentage of hypertensive patients with blood pressure 140/90.*** Estimated percentage of diabetic patients with Hba1c 9% for diabetes.Source: Bureau of Primary Health Care. 2019. Health Center Program Fact Sheet. Available from ut/healthcenterfactsheet.pdf
Figure 3-2Many Health Centers Exceed Healthy People 2020 GoalsMeet or Exceed at Least One Goal93%Dental Sealants for Children66%Hypertension Control57%Access to Prenatal Care49%Low Birth Weight47%0%Percent of Health Center GranteesMeeting Healthy People 2020 Goal100%Note: Healthy People 2020 goals are based on national health objectives to identify and reduce the most significant, preventable threats to health. For more on Healthy People 2020, visithttps://www.cdc.gov/dhdsp/hp2020.htmSources: (1) 2018 Uniform Data System. Bureau of Primary Health Care, HRSA, DHHS. (2) Office of Disease Prevention and Health Promotion. Healthy People 2020. 2020 Topics and Objectives.
Figure 3-3Health Center Patients Have Lower Rates ofLow Birth Weight than Their U.S. Counterparts,Despite Health Centers Serving More At-Risk PatientsNationalHealth Center13.7%11.6%8.3% 8.0%All Births7.1% 7.0%White7.5%6.8%7.9% 7.8%8.6%7.6%Hispanic /American Indian Native HawaiianLatinoor Alaska Native or Other Pacific8.6%7.6%Asian8.9%7.8%More than OneBlack or AfricanRaceAmericanIslanderSources: (1) 2018 Uniform Data System, Bureau of Primary Health Care, HRSA, DHHS. (2) NACHC analysis of CDC WONDER. Data downloaded October 29, 2019.
Figure 3-4Health Center Patients are More SatisfiedWith Care Compared to Low-Income Patients NationallyLow-Income Patients NationallyHealth Center Patients98%96%87%37%Satisfied with Hours of OperationSatisfied with Overall Care ReceivedSource: Shi L, Lebrun-Harris LA, Daly CA, et al. Reducing Disparities in Access to Primary Care and Patient Satisfaction with Care: The Role of Health Centers. Journal of Health Care for the Poor andUnderserved. 2013; 24(1):56-66.
Figure 3-5Enabling Services* are a Defining Characteristic of Health CentersAnd Help Improve Access to Care and Patient SatisfactionHealth Center Patients Who Used Enabling Services* Had:1.9 more health center visitsin the past year (on average)A 12 percentage-point higher likelihoodof getting a routine checkupA 16 percentage-point higherlikelihood of getting a flu shotAn 8 percentage-point higherlikelihood of being satisfied with care* The Health Resources and Services Administration (HRSA) defines enabling services as, “non-clinical services that do not include direct patient services that enable individuals to access health careand improve health outcomes.“ Examples of enabling services include case management, translation/interpretation, transportation, and health education. (HRSA Health Center Program Terms andDefinitions, n.d.).Note: This figure compares health center patients who used enabling services to patients that did not use enabling services.Source: Yue et al. Enabling Services Improve Access to Care, Preventive Services, and Satisfaction Among Health Center Patients. Health Affairs 38(9). September 2019.
Figure 3-6Health Centers Exceed Medicaid Managed Care Organization (MCO)High Performance Benchmark ScoresAverage Rate in High-Performing Health CentersAverage Rate in All Health CentersMedicaid MCO High Performance Benchmark (75th Percentile)81%79%73%71%62%Diabetes Control63%Blood Pressure Control72%62%54%Pap TestNotes: Quality measures include control of diabetes: share of patients with diabetes with HbA1c between 7% and 9%; control of hypertension: share of patients with hypertension with blood pressure 140/90; Pap tests: share of female patients age 24 – 64 who received Pap test within past three years.Source: Shin P, Sharac J, Rosenbaum S, Paradise J. Quality of Care in Community Health Centers and Factors Associated with Performance. Kaiser Commission on Medicaid and the Uninsured Report#8447 (June 2013).
Figure 3-7Health Centers Provide More Preventive ServicesThan Other Primary Care ProvidersMedicaid Patients Receiving New9%Asthma Education for Asthmatic PatientsTobacco Cessation Education for Smoking PatientsHealth EducationImmunization for 65 Years & OlderPap Smear in the Last 3 YearsPatient Visits to Other Providers21%Medication for Uncontrolled HypertensionHealth Center Patient Visits15%24%19%33%37%51%65%70%81%85%Sources: (1) Shi L, Tsai J, Higgins PC, Lebrun La. (2009). Racial/Ethnic and Socioeconomic Disparities in Access to Care and Quality of Care for U.S. Health Center Patients Compared with Non-HealthCenter Patients. J Ambul Care Manage 32(4): 342 – 50. (2) Shi L, Leburn L, Tsai J and Zhu J. (2010). Characteristics of Ambulatory Care Patients and Services: A Comparison of Community HealthCenters and Physicians' Offices J Health Care for Poor and Underserved 21(4): 1169-83. (3) Hing E, Hooker RS, Ashman JJ. (2010). Primary Health Care in Community Health Centers and Comparisonwith Office-Based Practice. J Community Health. 2011 Jun; 36(3): 406 - 13. (4) Fontil et al. Management of Hypertension in Primary Care Safety-Net Clinics in the United States: A Comparison ofCommunity Health Centers and Private Physicians’ Offices. Health Services Research. April 2017. 52:2.
Figure 3-8Women at Health Centers are More Likely to Receive MammogramsThan Their Counterparts NationallyNationalHealth Centers76%69%63%82%70%61%52%30%UninsuredIn Poverty*Hispanic / LatinoBlack* Includes women below 100% FPL or at 100% FPL and below.Sources: (1) Health Resources and Services Administration, 2014 Health Center Patient Survey. Female Health Center Patients Aged 40 Who Had a Mammogram in the Past 2 Years. (2) NationalCenter for Health Statistics. Health, United States, 2016: With Chartbook on Long-term Trends in Health. Hyattsville, MD. 2017. Table 70. Use of Mammography Among Women Aged 40 and Over, bySelected Characteristics: United States, Selected Years 1987 - 2015.
Figure 3-9Women at Health Centers are More Likely to Receive Pap SmearsThan Their Counterparts NationallyNational82%76%57%UninsuredHealth Centers75%63%In Poverty*92%89%Black69%Hispanic / Latino* Includes women below 100% FPL or at 100% FPL and below.Sources: (1) Health Resources and Services Administration, 2014 Health Center Patient Survey. Female Health Center Patients Aged 18 Who Had a Pap Smear in the Past 3 Years. (2) National Centerfor Health Statistics. Health, United States, 2016: With Chartbook on Long-term Trends in Health. Hyattsville, MD. 2017. Table 71. Use of Pap S
The Community Health Center Chartbook highlights important research and data on Health Center Program Grantees, as well as other Federally-Qualified Health Centers (FQHCs). In this document, unless otherwise noted, the term “healthcenter”is generally used to refer to