Transcription
UNIVERSITY OF NAPLES“FEDERICO II”DOCTORATE PROGRAM INCLINICAL AND EXPERIMENTAL MEDICINEMetabolic Endocrine CurriculumXXIX CYCLE (2014-2017)Coordinator: Prof. Gianni MaronePHD THESISUnderstanding Type 2 Diabetes: Epigenetic profiling inpopulations at high risk for the diseaseTutor/SupervisorProf. Francesco BeguinotCandidateDr. Antonella Desiderio
Understanding Type 2 Diabetes: Epigeneticprofiling in populations at high risk for the disease1
Table of contentsList of PublicationsAbstractBackground1.1 Diabetes mellitus1.2 Type 2 Diabetes1.3 Risk factors of T2D1.3.1 Obesity1.3.2 Family history of T2D1.3.3 scAT dysfunction: the connecting bridge among obesity andfamiliarity of T2D1.3.4 The genetic basis of T2D and obesity2.1 Epigenetics2.2 Epigenetics in T2D and obesity2.2.1 Epigenetic event in T2D2.2.2 Epigenetic event in obesity control3.1 Approaches for the identification of disease risk-associated genes4.1 GWAS analysis identified Ankrd26 as a candidate gene for thestudy of obesity and T2D riskAim of the studyMaterials and MethodsResults and DiscussionConclusions and future 416161719212324274749512
List of PublicationsParrillo L, Costa V, Raciti GA, Longo M, Spinelli R, Esposito R, Nigro C,Vastolo V, Desiderio A, Zatterale F, Ciccodicola A, Formisano P, Miele C,Beguinot F. Hoxa5 undergoes dynamic DNA methylation and transcriptionalrepression in the adipose tissue of mice exposed to high-fat diet. Int J Obes(Lond). 2016 Jun;40(6):929-37.Desiderio A, Spinelli R, Ciccarelli M, Nigro C, Miele C, Beguinot F, RacitiGA. Epigenetics: spotlight on type 2 diabetes and obesity. J Endocrinol Invest.2016 Oct;39(10):1095-103.Raciti GA, Spinelli R, Desiderio A, Longo M, Parrillo L, Nigro C, D’EspositoV, Mirra P, Fiory F, Pilone V, Forestieri P, Formisano P, Pastan I, Miele C,Beguinot F. Specific CpG hyper-methylation leads to Ankrd26 gene downregulation in white adipose tissue of a mouse model of diet-induced obesity.Sci Rep. 2017 Mar 7;7:43526.3
AbstractThe epigenetic hypothesis argues that, in addition to genetic variation,epigenetics provides an additional set of mechanisms mediating therelationship between genotype and the environment that may contribute to theindividual susceptibility to different disorders such as T2D.The aim of this study was to investigate the epigenetic profiling in twopopulation at high risk of T2D, i) obese and ii) first degree relatives of type 2diabetic patients (T2D-FRDs), using a candidate gene study and an EWASapproach, respectively.i) In human Peripheral Blood Leucocytes (PBLs), the ANKRD26 geneexpression inversely correlates with BMI (r -0.436; p 0.01), and was loweredby about 25% in obese subjects compared with lean individuals (p 0.01).Additionally, in the same individuals a site specific CpG hyper-methylation ofthe ANKRD26 promoter occurred in obese compared with lean subjects(p 0.001) and inversely correlates with the ANKRD26 gene expression (r 0.850, p 0.05).ii) In Subcutaneous Adipose Tissue Stromal-Vascular Fraction cells (SVFs)from lean euglycaemic T2D-FDRs, 34 miRNAs and 84 genes were identifiedto be differentially expressed compared with the lean counterpart with nofamily history of T2D (control group) by Next Generation Sequencing. Inaddition, in the T2D-FDRs, the expression of the miRNAs, hsa-miR-23a-5p, 193a-5p and -193b-5p, was down-regulated compared with the control subjects(p 0.01), and inversely correlates with adipocyte cell size (p 0.01).Interestingly, bio-informatic analysis of these data highlighted that theexpression changes of the miRNAs, hsa-miR-23a-5p, -193a-5p and -193b-5p,enriched pathways associated to adipocyte commitment/differentiation andfunction. Furthermore, the expression of the miRNAs target gene IGF2 andMXRA5 was up-regulated in the T2D-FDRs compared with controls (p 0.01),and inversely correlates with miRNA expression (p 0.01) and positively withadipocytes cell size (p 0.01).In conclusion, in the first study I evidenced that the down-regulation of theANKRD26 gene and the site specific CpG hyper-methylation of its promoterrepresent a common abnormality in obese patients. In the second study, Iinstead concluded that specific changes in the expression of the miRNAs, hsamiR-23a-5p, -193a-5p and -193b-5p, occurred in the individuals withfamiliarity for T2D and may cause adipose dysfunction and impaired adiposecell recruitment, which are typical in T2D-FDRs, by interfering with functionsof adipocyte specific pathways.4
Background1.1 Diabetes mellitusDiabetes mellitus (DM) is a group of metabolic diseases characterized bychronic hyperglycemia [1]. There are two main types of DM: i. Type 1 diabetes(T1D), once called insulin dependent diabetes mellitus (IDDM), caused by lackof insulin secretion by beta cells of the pancreas [1], and ii. Type 2 Diabetes(T2D), once called non-insulin dependent diabetes mellitus (NIDDM), mainlycaused by decreased sensitivity of target tissues to insulin [1]. Theclassification of DM is reported in Table 1.Type 1 DiabetesType 2 DiabetesOther types ofdiabetesA. AutoimmuneB. Idiopathic1. Insulin resistance predominates over the relative defects in hormonesecretion2. Defects in insulin secretion predominate over the presence of insulinresistanceA. Gestational diabetesF. Pharmacologically or chemicallyB. Genetic defects in β-cellinduced1. Vacorfunction:1. Chromosome 12,2. PentamidineHNF-1α (MODY 3)3. Nicotinic acid2. Chromosome 7,4. Glucocorticoidsglycosidase (MODY 2)5. Thyroid hormones3. Chromosome 20,6. DiazoxideHNF-4α (MODY 1)7. β-adrenergic agonists4. Mitochondrial DNA8. Tiazides5. Others9. Dilantin10. α interferonC. Genetic defects in insulin11. Othersaction1. Type A insulin resistanceG. Infections2. Leprechaunism1. Congenital rubeola3. Rabson-Mendenhall syndrome2. Cytomegalovirus4. Lipotrophic diabetes3. Others5. OthersH. Infrequent forms of autoimmunediabetesD. Disease of the exocrine1. Stiff-man syndrome)pancreas1. Pancreatitis2. Antibodies against insulin receptors2. Pancreatectomy/trauma3. Others3. NeoplasiaI. Other syndromes occasionally4. Cystic fibrosisassociated with diabetes5. Hemochromatosis1. Down syndrome6. Fibrocalcific pancreatopathy2. Klinefelter syndrome7. Others3. Turner syndrome4. Wolfram syndromeE. Endocrinopathies1. Acromegaly5. Friedreich ataxia2. Cushing syndrome6. Huntington’s chorea3. Glucagonoma7. Lawrence-Moon-Biedel syndrome4. Pheochromocytoma8. Myotonic dystrophy5. Hyperthyroidism9. Porphyria6. Somatostatinoma10. Prader-Willi syndrome7. Aldosteronoma11. Others8. OtherTable 1. Classification of diabetes. MODY: mature onset diabetes of the young. Modifiedfrom Diabetes Care. 2009;32(Suppl 1):S62-S67.5
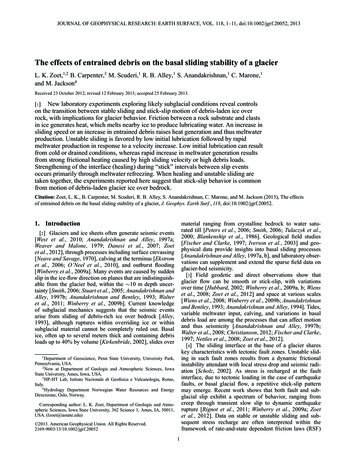
Since the origin and etiology may be different, the DM types share theexistence of defects in insulin secretion, insulin action, or both. The reducedsensitivity to insulin is often called insulin resistance. The basic effect ofinsulin lack or insulin resistance on glucose metabolism is an impairment ofthe efficient uptake and utilization of glucose by most cells of the body, exceptthose of the brain [2]. As a result of this, blood glucose concentrationincreases, cell utilization of glucose falls and utilization of fats and proteinsincreases [3]. The classic symptoms in T1D, are excessive secretion of urine(polyuria), thirst (polydipsia), weight loss and tiredness; these symptoms maybe less marked in T2D [1]. Indeed, in this form, no early symptoms appear andthe disease is diagnosed several years after its onset, when complications arealready present. T2D represents the more frequently occurring form, whichaccounts for 90% of all diabetes cases worldwide [4]. It occurs commonly inadults, but is being noted increasingly in adolescents as well. The InternationalDiabetes Federation revealed that about 382 million people worldwide, or8.3% of adults, are estimated to have diabetes. If these trends continue, by2035, some 592 million people, or one adult in 10, will have diabetes [5].These numbers make it clear the high interest about the pathogenesis of T2D,both in the scientific research and in the field of clinical trials.1.2 Type 2 DiabetesT2D is a complex multifactorial disease whose incidence has increased in bothdeveloped and developing countries worldwide. The combined effect ofpopulation aging, urbanization, dietary changes, physical inactivity andunhealthy behaviors, are driving the emerging pandemic of T2D [6]. Thepathology is characterized by sustained elevations of plasma glucose levelsresulting in chronic hyperglycemia. The onset of chronic hyperglycemia isassociated with long-term damage and dysfunction and typically results wheninsulin secretion from the islets fails to keep pace with increasing insensitivityto the action of circulating insulin on its target tissues [1]. Insulin resistance isan early feature of T2D. The major sites of insulin resistance include liver andthe peripheral tissues, skeletal muscle and fat. In the Figure 1 is represented thecross-talk between tissues in the regulation of glucose metabolism. In muscleand fat, insulin resistance is manifested by decreased glucose uptake. Inparticular, in muscle, insulin resistance impaired the utilization of glucose bynon-oxidative pathways and by the decrease in glucose oxidation as well. Inthe fat, insulin resistance increase free fatty acid (FFA) flux from adiposetissue to non-adipose tissue, resulting in abnormalities of fat metabolism, whilein the liver insulin resistance leads to failure of insulin to suppress hepaticglucose production, which is fueled by glycogen breakdown and particularlyby gluconeogenesis [7]. T2D often remains asymptomatic and undetected foryears. The failed diagnosis is connected to serious complications, which canresult in early death. Long-term complications of diabetes include retinopathywith potential loss of vision; nephropathy leading to renal failure; peripheralneuropathy; autonomic neuropathy and cardiovascular disease.6
Figure 1. Cross-talk between tissues in the regulation of glucose metabolism. Nature. 2001Dec 13;414(6865):799-806.Nevertheless, diabetic-patients have an increased incidence of atheroscleroticcardiovascular, peripheral arterial, and cerebrovascular diseases, besideshypertension and abnormalities of lipoprotein metabolism as well [1].Although the pathogenesis of diabetes is complex, several risk factors havebeen identified. Among these, obesity, family history of diabetes, aging,physical inactivity, impaired glucose tolerance, history of gestational diabetesare the most relevant [6]. In Table 2 are reported the odds ratio score for T2Drisk.VariableAge 45 yearsFemale genderFamily history of diabetesBMI 25-3030-3535-40 40Central obesityPhysical inactivityDiabetes (95%CI)odds3.3 (2.4‑4.6)1.6 (1.2‑2.2)1.9 (1.3‑2.0)1.6 (1.5‑1.8)3.2 (2.9-3.5)5.9 (5.3-6.5)11.6 (10.5-12.8)2.4 (1.8‑3.3)1.4 (1.1‑1.9)Table 2. Odds ratio score for diabetes risk. BMI: Body mass index, CI: Confidenceinterval. Modified from J Family Med Prim Care. 2015 Jul-Sep;4(3):399-404, Diabetol MetabSyndr. 2014 Apr 3;6(1):50.7
1.3 Risk factors of T2D1.3.1 ObesityThe increasing global prevalence of T2D is tied to rising rates of obesity in partas consequence of social trends toward alterations of the energy homeostasis interms of balance among energy intake, expenditure and storage [8]. Obesity isone of the major risk factors for T2D and it has shown a parallel increase inglobal prevalence. Indeed, the estimated 205 million men and 297 millionwomen worldwide (as of 2008) to be obese (body mass Index, BMI 30-35kg/m2) are at 10-40 fold higher risk of T2D [9]. The relatively recent rise inobesity appears to be related to gene-environment interactions where thegenetic background, coupled with the current obesogenic environment, and therewarding nature of palatable foods, tends to promote obesity [10].Nevertheless, some obese people never develops T2D, and some T2 diabeticsare extremely lean. It is now recognized that among obese people 1 on 3 are“metabolically healthy”, which means that their fasting glucose, triglycerides,and other metabolic markers are normal. This population is at no higher riskfor T2D or cardiovascular disease (CVD) than their metabolically healthy leancounterparts [11]. How this might be possible is still unclear. Recent growingevidences have raised much interest in the potential role of regional adiposetissue (AT) distribution in the contribution to T2D. AT is an endocrine organinvolved in a number of processes including the communication between thebrain and peripheral tissues by secreting hormones which regulate appetite andmetabolism [12]. These functions appear to be modulated by the location of thevisceral AT (VAT) and subcutaneous AT (scAT), by the size of the averageadipocyte in the tissue, and by adipocyte metabolism of glucose andcorticosteroids. Thus, fat distribution plays an important role in metabolic risk.Indeed, increase in intra-abdominal visceral fat promotes a high risk ofmetabolic disease, whereas increased subcutaneous fat in the thighs and hipsexerts little or no risk [13]. Nevertheless, it is now known that abdominalsubcutaneous fat cell size in humans is negatively correlated with insulinsensitivity independently to degree of obesity [14] and abdominalsubcutaneous adipose cell size has been shown to be an independent predictorof future T2D in perspective studies [15].1.3.2 Family history of T2DA family history of diabetes is associated with a range of metabolicabnormalities and is a strong risk factor for the development of T2D [16].Familiarity for T2D has long been adopted as an argument supporting thegenetic origin of diabetes, indeed, first degree relatives of T2D patients (T2DFDRs) have up to 10-fold higher risk of developing the disease than age- andweight-matched subjects without a clear family history of the disease [17, 18].In support of this, the 39 % of T2 diabetic individuals have at least one affectedparent and among the monozygotic twin pairs with one affected twin,approximately the 70 % of unaffected twins eventually develop the disease8
[18]. It is likely that this elevated risk is mediated, in part, by both genetic andshared environmental components among family members, but the precisefactors accounting for this increased risk are poorly understood. Differentstudies suggest that T2D risk depends not only on the number of affectedrelatives but on the age at diagnosis and on whether maternal or paternalhistory is present as well [19]. Particularly, maternal diagnosis provides furtherinsight into individual risk of T2D. Indeed, it has been reported that individualswith a young maternal age at diagnosis of T2D had a greatly increased odds ofimpaired glucose tolerance differently for individual with younger paternaldiagnosis [20]. Scott et al. have also observed in their study that the familyhistory associated-risk is 17% for maternal diabetes and less than 1% forpaternal diabetes [20]. This evidence suggests that the risk of T2D attributableto family history may have a distinct etiology depending on the family memberaffected. In addition, T2D-FDRs frequently have an impaired nonoxidativeglucose metabolism (indicative of insulin resistance) long before the onset ofT2D and may have also beta-cell dysfunction, as evidenced by decreases ininsulin and amylin release in response to glucose stimulation [18].Furthermore, recent evidence suggests that family history of T2D isaccompanied by scAT dysfunction, as well [21].1.3.3 scAT dysfunction: the connecting bridge among obesity andfamiliarity of T2DIt is now well recognized that a limited expandability of the scAT leads toinappropriate adipose cell expansion (adipocyte hypertrophy) with localinflammation and dysregulated insulin-resistant AT [22] (Figure 2).Furthermore, obesity with abdominal subcutaneous adipose cell enlargement isalso characterized by a reduced number of pre-adipocytes that can undergodifferentiation [23]. This is due to specific inability of the pre-adipocytes inabdominal scAT to differentiate into mature adipocytes and/or of theprogenitor cells to be committed into adipocyte lineage. This intriguing findingexplains in part why there is differential lipid partitioning and why abdominalobesity is closely linked to insulin resistance. Thus, the inability to store excessfat in the scAT is likely a key mechanism for promoting ectopic fataccumulation in tissues and areas where fat can be stored, including the intraabdominal and visceral areas, the liver, epi/pericardial area, around vessels, themyocardium, and skeletal muscle tissue [24]. It was also demonstrated that preadipocytes of T2D subjects display an intrinsic gene expression profile ofdecreased differentiation capacity. Indeed, the decreased expression of genesinvolved in differentiation can provide a molecular basis for the reducedadipogenesis of pre-adipocytes from T2D subjects, leading to reducedformation of adipocytes in subcutaneous fat depots and ultimately to ectopic fatstorage in these subjects [25]. Recent evidence revealed that even non-obeseT2D-FDRs are less insulin-sensitive and have considerably largersubcutaneous fat cells than individuals with the same age, BMI, amount ofbody fat but lacking a known family history of diabetes. This finding indicates9
that T2D-FDRs, also when non-obese, have a dysfunctional scATcharacterized by inappropriate hypertrophy of the adipose cells. Overall thecombinations of these observations suggest that familiarity for T2D, as well asobesity and T2D itself, presents in the scAT a common feature due to animpaired ability to recruit and/or differentiate new adipose cells [23, 25-26].The reasons for this inability are currently unclear and deserve furtherinvestigations.Figure 2: Metabolically healthy white adipose tissue expansion versus unhealthypathological expansion. a) Healthy WAT expansion displays high insulin sensitivity and ischaracterized by an anti-inflammatory state due to elevated levels of Treg cells and M2adipose tissue macrophages (ATMs), sufficient vasculature to support tissue expansion andadipocyte hyperplasia. b) Unhealthy WAT expansion, instead, displays a heightened state ofinflammation (high levels of infiltrating pro-inflammatory M1 ATMs and NK cells), impairedformation of new vasculature to support WAT growth, and enhanced fibrosis and hypoxia.Such events contribute to the development of WAT insulin resistance. Nat Rev Drug Discov.2016 Sep;15(9):639-60.1.3.4 The genetic basis of T2D and obesityUntil 2012, more than 175 loci have been associated with common forms ofT2D and closely related continuous traits such as fasting glucose, BMI, and fatdistribution [27-29]. Population and family (including twins) studies haveextensively documented the familial aggregation of both T2D and obesity [18].In particular for T2D risk, linkage studies in parallel with candidate genestudies have reported many T2D-associated loci (Figure 2) [30]. Among them,the strongest known T2D-associated locus, with an odds ratio for T2D of 1.4fold per allele, was mapped at the TCF7L2 (transcription factor 7-like 2) locus[31]. This gene was attested to modulate the pancreatic islet function. Indeed,most studies suggest that the predominant intermediate phenotype associatedwith TCF7L2 variation is the impaired insulin secretion [31].This is consistentwith the replicated observation that the TCF7L2 association is greater among10
lean than obese T2D subjects [31]. The first genome-wide association study(GWAS) for T2D provided the evidence that GWAS would work for complexdisease and beside TCF7L2, single nucleotide polymorphisms (SNPs) in thezinc transporter SLC30A8 and variants in HHEX were identified, as well [32].This study was successively followed by other that found novel associations atCDKAL1, IGF2BP2 and CDKN2A/B genes [32]. The Diabetes and GeneticsReplication and Meta-Analysis (DIAGRAM) consortium identified other sixnew loci JAZF1, CDC123-CAMK1D, TSPAN8-LGR5, THADA, ADAMTS9 andNOTCH2 [30]. Subsequently, the Meta-Analyses of Glucose and Insulinrelated traits Consortium (MAGIC) with a large-scale meta-analyses of GWASfor glycaemic phenotypes in persons without diabetes, identified other ninenovel associations loci for fasting glucose (ADCY5, MADD, ADRA2A, CRY2,FADS1, GLIS3, SLC2A2, PROX1 and C2CD4B) and one influencing fastinginsulin and HOMA-IR near the IGF1 locus. Evaluating the impact on T2Drisk, the MAGIC investigators found novel associations with T2D in additionalfive loci (ADCY5, PROX1, GCK, GCKR and DGKB-TMEM195) and replicatesthe known signals at TCF7L2 and SLC30A8 loci [32]. Therefore, theidentification of KCNQ1 in East-Asian samples illustrated how studies frompopulations of different ancestry might uncover additional T2D loci. Indeed,KCNQ1 was previously unidentified in samples of European descent.Differences in risk–allele frequency meant that the East-Asian studies werebetter powered to detect an effect [33]. In support of this, recent studies inpopulations of Asian ancestry have also found novel association loci reachinggenome-wide significance at PTPRD, SRR, UBE2E2 and CDC4A-CDC4B[33]. Summarizing, to date, 76 T2D susceptibly variants have been identified,explaining only the 10% of observed familial clustering in Europeans (Figure3).Figure 3. Trans-ethnic meta-analysis of T2D risk-associated loci. 26,488 T2D cases and83,964 controls from populations of European, East Asian, South Asian, and Mexican andMexican American ancestry. Nat Genet. 2014 Mar;46(3):234-44.11
Alongside T2D risk-associated loci, the noncoding variation in SNPs withinintrons 1 and 2 of FTO (fat mass and obesity associated) gene is also thestrongest genetic association with risk to polygenic obesity in humans [34].After the previously reported variants in FTO gene, the other strongestassociation signal mapped 188 kb downstream of MC4R (melanocortin-4receptor) gene, mutations of which are the leading cause of monogenic obesityin humans [35]. In the 2009, a meta-analysis of GWAS by the GeneticInvestigation of ANthropometric Traits (GIANT) consortium confirmed theFTO and MC4R genes as BMI associated-loci and identified six additional locias genome-wide significant: TMEM18, KCTD15, GNPDA2, SH2B1, MTCH2and NEGR1[36]. Another study by Thorleifsson et al. published in the sameissue of Nature Genetics replicated their findings confirming knownassociations to BMI of variants in or near the loci FTO, MC4R, as well as forthe loci NEGR1, TMEM18, KCTD15 and SH2B1 and identified additional twonew loci: ETV5 and BDNF [37]. Some obesity-related genes are reported inTable 3 [38]. Thus, substantial efforts have been made to define loci andvariants contributing to the individual risk of both T2D and obesity, however,the overall risk explained by genetic variation is very modest.12
Nearest M160TMEM18TNNI3KVEGFAZNF608ZNRF3KREMEN1Full gene nameADAM metallopeptidase with thrombospondin type 1 motif 9Brain-derivedneurotrophicfactorChromosome 12 openreadingframe 51Cell adhesion molecule 2CDK5 regulatory subunit associated protein 1-like 1Cytoplasmicpolyadenylation element binding protein 4Dynamin 3 – phosphatidylinositol glycan anchor biosynthesis class CEts variant 5Fas apoptoticinhibitorymolecule 2Fanconi anemia complementation group LPOC5 centriolar protein homologFat mass and obesity associatedGlucosamine-6-phosphate deaminase 2Glycoprotein 2zymogengranulemembraneG protein-coupled receptor family C group 5 member BGrowth factor receptor-bound protein 14Homeobox C13Insulin receptor substrate 1Inositol 1,4,5trisphosphate receptor type 2/sarcospan Krasoncogeneassociated genePotassium channel tetramerisation domain containing 15Kruppel-like factor 9Low density lipoprotein receptor-related protein 1BLeucine rich repeat neuronal 6 CLymphocyte antigen 86Lysophospholipase-like 1Mitogen-activated protein kinase kinase 5Melanocortin 4 receptorMitochondrialribosomal protein S22Methioninesulfoxidereductase AMitochondrialcarrier 2Mitochondrialtranslational initiation factor 3Neuronal growth regulator 1Nuclear factor (erythroid-derived 2)-like 3Nischarin/stabilin 1Neurexin 3Nudix (nucleoside diphosphate linked moiety X)-type motif 3Paired box 5Proproteinconvertasesubtilisin/kexin type 1Protein kinase D1Polypyrimidinetractbinding protein 2Glutaminyl-peptide cyclotransferase-like/gastric inhibitory clase3Ribosomal protein Fat MIWHRWHRBMIBMIBMIWAISTBMIBMIBMIWHRWHRBMIBMIFat massBMIBMIBMIBMIBMIBMIBMIWHRSEC16 homolog BSH2B adaptor protein 1Solute carrier family 39 member 8Sprouty homolog 2T-box 15/tryptophanyltRNA synthetase 2 mitochondrialTranscription factor AP-2 beta (activating enhancer binding protein 2beta)Transmembrane protein 160Transmembrane protein 18TNNI3 interactingkinaseVascular endothelial growth factor AZinc finger protein 608Zinc and ring finger 3/kringle containing transmembrane protein 111641316BMIBMIBMIFat %WHRBMI19216522BMIBMIBMIWHRBMIWHRTable 3. SNPs reported to be associated to BMI, waist circumference, waist–hip ratio, fatpercentage or fat mass in GWAS. Chr: chromosome, BMI: body mass index, WHR: waistto hip ratio. Mol Cell Endocrinol. 2014 Jan 25;382(1):740-57.13
2.1 EpigeneticsSubstantial evidence has brought to light that environmental factors includingdiet, physical activity, drugs and smoking, affect the phenotype and provide amajor contribution to susceptibility to most chronic non communicablediseases [39]. Epigenetics represents the fastest growing research areas inbiomedicine, acting at the interface between the genome and environmentalfactors. It might be broadly defined as the sum of all the mechanisms necessaryto unfold the genetic program into development [40]. In the early 1940s,Conrad Waddington linked genetics and developmental biology coining theterm epigenetics, defining it as “the branch of biology which studies the causalinteractions between genes and their products which bring the phenotype intobeing” [41]. However, the meaning of the word has gradually changed over thefollowing years, and epigenetics is known today as “the study of changes ingene function that are mitotically and/or meiotically heritable and that do notentail a change in DNA sequence” [42]. Differently from traditional genetics,based on cell lineages and clonal inheritance, epigenetic changes often occur ingroups of cells while some epigenetic event is clonal. In addition, geneticchanges are, almost by definition, stable, whereas epigenetic changes areplastic events [40]. Epigenetic mechanisms are plastic genomic processes thatchange genome function under endogenous and exogenous influences [43-44],and may propagate modifications of gene activity from one cell generation tothe next [45]. These mechanisms imply chemical modifications of DNA, suchas DNA methylation, post-traslational changes in histone proteins alteringchromatin conformation, and transcriptional gene silencing mediated by noncoding RNAs (ncRNAs) [46] (Figure 4).Figure 4. Schematic representation of epigenetic modifications. Epigenetic modificationsinclude DNA methylation, histone modifications and miRNAs. Ac: acetylation, Me:methylation, P: phosphorylation. J Endocrinol Invest. 2016 Oct;39(10):1095-103.14
Abnormalities in one or more of these mechanisms can lead to inappropriateexpression or silencing of genes, resulting in imbalance of the epigeneticnetwork and may result in metabolic disorders such as T2D and obesity [4748]. DNA methylation is the best characterized epigenetic mark. In mammals,it is essential during development and is involved in a variety of biologicalprocesses, including genomic imprinting and X chromosome inactivation [49].It has long been recognized as an epigenetic silencing mechanism [50] whichpreferentially occurs at CpG di-nucleotides that are usually clustered in theCpG islands (CGIs) [51]. Quite often, un-methylated CpG sites (CpGs) at genepromoters create a transcriptionally permissive chromatin state by destabilizingnucleosomes and facilitating the recruitment of transcription factors [52]. Onthe other hand, dense DNA methylation of CpGs mediates stable long-termgene silencing by direct inhibition of binding of transcription factors or by acombination of events mediated by methyl-CpG binding domain proteins(MBDs) which recruit methylated DNA mediators of chromatin remodeling,such as histone deacetylases (HDACs), or other repressors of gene expression[50, 53-54]. Furthermore, findings over the past ten years have progressivelyrevealed the relevance of ncRNAs in most epigenetically-controlled events.The most extensively studied ncRNAs are the miRNAs, that are criticalregulators of post-transcriptional gene expression. In particular, miRNAs areable to suppress the target gene expression binding the 3’ Untranslated Region(3’UTR) of the target mRNA Figure 5. Moreover miRNAs are susceptible toepigenetic modulation, indeed, are able to regulate both DNA methylation andhistone modifications by controlling the expression of important epigeneticregulators, including DNA methyltransferases (DNMTs) and HDACs therebyimpacting on the entire gene expression profile [55].Figure 5. miRNA action. The single-stranded mature miRNAs thenRNA-induced silencing (RISK) complex. This complex guides thesequence located at the 3’-UTR of the target mRNA. Incomplete orresults in degradation of the mRNA or inhibition of translation.Aug;121(2):409-17.act as the core of themiRNA to its targetcomplete base
Parrillo L, Costa V, Raciti GA, Longo M, Spinelli R, Esposito R, Nigro C, Vastolo V, Desiderio A, Zatterale F, Ciccodicola A, Formisano P, Miele C, Beguinot F. Hoxa5 undergoes dynamic DNA methylation and transcriptional repression in the adipose tissue of mice exposed to high-fat