Transcription
Mobile GamingApps Report2019 User Acquisition Trends & ltegyWith Retention Data fromMobile Gaming Apps Report: 2019 User Acquisition Trends & Benchmarks1
ContentsKey Takeaways .3Introduction .4Mobile Gaming Apps: A World (and Wealth) of Opportunity .7Global costs & conversion rates .7iOS vs Android .8Registration costs & conversion rates by month .9In-app purchase costs & conversion rates by month .10Install costs by country: Low costs in highly attractive markets .11Registration costs & engagement rates by country .12In-app purchase costs & engagement rates by country .13Retention rates by gaming app category .14Midcore & Strategy Gaming Apps: A Passion, Not a Pastime . 16Casual Gaming Apps: Feeding our Craving for Snappy Gameplay . 24Hyper Casual Gaming Apps: A New and Dominant Force . 34Social Casino Gaming Apps: Immersive Gameplay with Mass Appeal . 42
Key TakeawaysPrepare for a perfect storm of marketing conditions1Moderate increases in costs and impressive double-digit conversion rates indicate thatusers still need some convincing early in the funnel, but they are willing to pay, play andstay around—particularly if the sub-category offers a habit-forming core loop.Competition heats up but summer months could give you the edge2A strategy to target users in the summer months from July to September can paydividends. It’s during this period that the install-to-in-app conversion rate (16.0%) hits itssecond-highest point and the cost to acquire a new user who makes an in-app purchasehits a low of 27.09.Don’t just play it safe in mature markets; explore untapped opportunities in APACand EuropeNorth America may be a textbook model for robust growth in the mobile gaming appsmarket, but the data also reveals several countries where potential is huge, but the costs3are not. Russia, in particular, stands out as a country that embraces Casual and SocialCasino games offering insanely affordable CPIs and eye-watering install-to-registrationrates. Japan also merits a closer look, showing the highest interest and commitmentto Casual games and a healthy appetite for Hyper Casual. Finally, EMEA—specificallyGermany and the U.K.—is a region that offers lower costs and a healthier retention curvefor Midcore & Strategy games.Social Casino has staying power & Hyper Casual has users hookedDay 1 retention is highest for Social Casino (32.2%) and Hyper Casual (32.7%) games,4but it’s Social Casino that maintains momentum into Day 30. But retention rates for threesub-categories (Casual, Hyper Casual and Midcore & Strategy) narrow at Day 7 andagain on Day 14, indicating that audiences for these games are equally engaged, and,perhaps, equally receptive to campaigns and messaging that nudge them to return tothe game and play more often.
IntroductionMobile gaming apps continue to grow at a fast and furious pace, setto reach a 60% market share in gaming consumer spend in 2019.But it’s not just the topline numbers that are impressive.The explosion in Hyper Casual games, which tap a universal desire for simple gameplay,and the expansion of instant gaming platforms from the likes of WeChat and Facebook,are also pushing the pace. The result: a massive market where mobile gaming appsappeal to a much broader audience than ever before. Outlook: Mobile gaming will generate revenues of 95.4 billion by 2022, according toNewzoo, a research firm providing market intelligence for games, esports, and mobile. Opportunity: A recent study from Newzoo and Activision Blizzard reveals 1 in 2 usershave opened a mobile game in the last seven days, making gaming the third mostpopular app type right behind social media and shopping apps. Outcome: We live in the “Golden Age of Gaming,” a time when mobile gaming appsaccount for 33% of all mobile downloads and 10% of all time spent on mobile, accordingto app market data provider AppAnnie. It reckons a whopping 74% of all consumerspend on Google Play and Apple iTunes app stores are driven by mobile games. The mobile gaming apps market continues to thrive, but that’s no guarantee yourbusiness will ride the tide. To keep you (literally) at the top of your game, the 2019Mobile Gaming Apps Report draws from Liftoff internal data from June 2018 throughMay 2019. But marketers also need data to drive deep-funnel goals and defineretention targets and benchmarks. To this end Liftoff has partnered with AppsFlyer,the global leader in mobile attribution and marketing analytics. AppsFlyer’s analysis ofretention data (Day 1, Day 3, Day 7, Day 14 and Day 30), based on 6,500 apps and 950million installs, is integrated throughout the report.Mobile Gaming Apps Report: 2019 User Acquisition Trends & Benchmarks4
In this report you’ll find:A breakdown of key engagement activitiesand trends to compare performance acrossplatforms (Android and iOS) and throughoutthe calendar year.An analysis of regions (North America,EMEA, APAC and LATAM) highlighting keycountries and trends.Additional granularity on four distinctgaming app sub-categories (Midcore &Strategy, Casual Gaming, Hyper Casualand Social Casino).Finally, Liftoff partners with Apptopia—a company that provides app publishers anddevelopers access to app intelligence worldwide to track costs and conversionsglobally—to give you insights into the total downloads and in-app purchase revenue(for the period June 2018 through May 2019) generated by each sub-category.Mobile Gaming Apps Report: 2019 User Acquisition Trends & Benchmarks5
MethodologyReport Data HighlightsTotal Apps UsedImpressionsClicks555107.4B1.6BDuration1 June 2018 - 31 May 2019InstallsRegistrationsIn-App Purchases81.8M3.8M14M
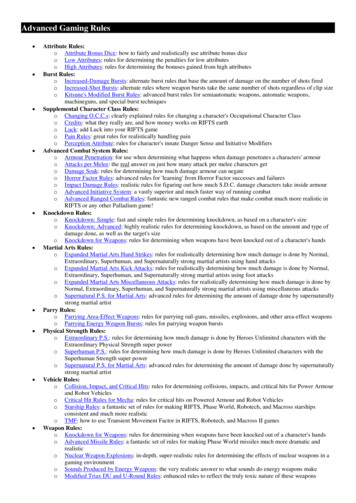
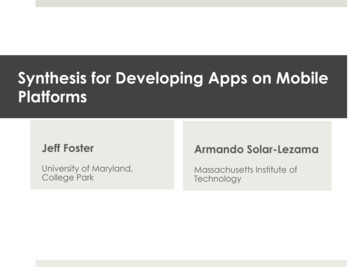
Mobile gaming apps: A world (and wealth)of opportunityGlobal costs & conversion rates: Rich rewards and high engagementcome at a costBy all counts, the mobile gaming market has never been healthier. However, yearsmarked by an avalanche of apps and new genres has produced users spoilt for choiceand somewhat wary of splurging on in-app purchases.Overall Gaming Apps Costs & Conversion Rates At the top of the funnel, it costs an average of 4.37 to acquire a new gaming app user,an increase of 0.62 or 16.5% compared to the previous year ( 3.75). In the middle of the funnel, the cost to acquire a user who completes a registration ispricey at 9.17, up 33.3% compared to the previous year ( 6.88). However, the installto-register rate of 47.7% (though down 6.90% compared to the previous year) tells apositive story—provided marketers use the data and analytics collected at this stage toretarget and re-engage users and drive frequent use. Deeper in the funnel, the cost to convert a player into a first-time purchaser is hardly abargain ( 35.42). However, a conversion rate of 12.3% ( just 1.1% down from the previousyear) suggests marketers who strike a chord with their campaigns can still strike it rich.Mobile Gaming Apps Report: 2019 User Acquisition Trends & Benchmarks7
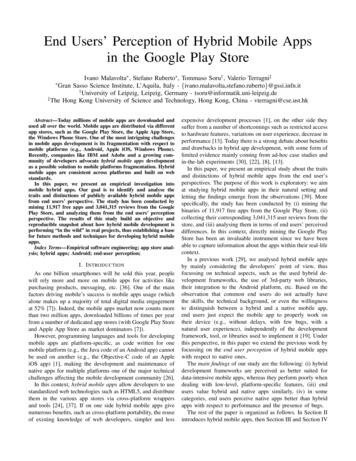
iOS vs Android: Costs drop, conversions rates dip, and Android remainsa better buyPlayers are spending tons of money on iOS and Android, but there are trade-offs tomake depending on your target market. Android is the one to pick for reach. Theplatform dominates with about 85% of the total global smartphone market, according toresearch firm IDC. Meanwhile, iOS continues to generate the most revenue—but recentreports suggest the platform is losing steam and market share in Europe, Japan andChina.Gaming Apps Costs & Conversion Rates by Platform At 3.21 Android users are a bargain to acquire, compared to iOS users that cost 4.85. The cost to acquire an Android user ( 33.83) who makes an in-app purchase is up9.9% over the previous year. This may be in the same range of the cost to acquire aniOS user ( 36.63), but a review of the install-to-in-app purchase rate tells a differentstory. Admittedly, the conversion rate for Android users has dipped into the single-digits(9.5%). But the steep decline in rates for iOS users (13.2% from 21.0% the previous year)signals the start of a downward trend that could topple strategies that focus exclusivelyon winning big-spender iOS users.Mobile Gaming Apps Report: 2019 User Acquisition Trends & Benchmarks8
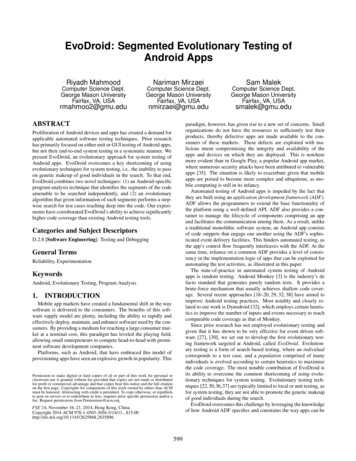
Registration costs & conversion rates by month: December and Marchare banner monthsThe pay-off for marketers comes when they can buy low and engage high. Fortunately,this is a pattern that marks several key months in the calendar year.Gaming Apps Registration Costs & Conversion Rates by Month Engagement rates remain in the double-digits throughout the calendar year,fluctuating between a low of 44.3% in April and a high of 61.3% in December,coincidentally the same month when the cost to acquire a user who will completea registration dips down to an affordable 7.93 before rocketing by 11.2% to reach 8.82 in January. September through December and February through March are periods when aperfect storm of conditions play in favor of strategies to acquire new users. If the aimis to re-engage users you have already acquired, then June through August, themonth of January, and the period April through May are the times to target. Compared to the previous year, peaks and troughs in the cost and conversioncurve have been replaced by a much flatter distribution of values suggesting thatseasonality is less of a factor. Users are growing more accustomed to interacting withgaming apps across the calendar year and the window of opportunity is open widerthan ever before.Mobile Gaming Apps Report: 2019 User Acquisition Trends & Benchmarks9
In-app purchase costs & conversion rates by month: Summer is a hot timeto capture share of walletIt pays to target users when they take a break from the routine and dedicate morehours to having fun in the sun.Gaming Apps In-App Purchase Costs & Conversion Rates by Month Costs and conversions are in a rare and positive balance from July to September,when the conversion rate (16.0%) hits its second-highest point and the cost to acquirea user who makes an in-app purchase hits a low of 27.09. The holiday buzz may linger into February, but engagement rates languish wellinto April. December is the stand-out month if you want holiday results that are offthe charts, but keep in mind the conversion rate (16.2%) coupled with a price tag of 29.94 is only marginally higher than it is in September. Overall, month-over-month costs are comparable with those reported the previousyear. However, engagement rates have plateaued at a lower level, indicatingmarketers have to do more to spark interest and drive conversions.Mobile Gaming Apps Report: 2019 User Acquisition Trends & Benchmarks10
Install costs by country: Low costs in highly attractive marketsNorth America may be the starting point for the tremendous growth of the mobilegaming market, but this snapshot highlights several countries where potential is huge,but the costs are not.Gaming Apps Install Costs by Country At 2.17, the cost to acquire a user in Russia sits in the middle for a market that isanything but average. The overall Russian games market, which is home to 66 milliongamers, is projected by Newzoo to hit 1.8 billion in revenues. China ( 1.32) and Brazil ( 1.42) offer bargain prices that merit a second look. Afterall, China, which currently accounts for 25% of the global mobile games market, ispunching above its weight with a games-addicted audience expected to reach 728million by 2023, up from 598 million in 2018. Meanwhile, Brazil offers exponentialgrowth, but the uneven distribution of wealth can make conversion an uphill battle. Users in the U.K. (and much of Europe) are developing an enormous passion formobile gaming apps, a positive trend that suggests prices to acquire installs in thesecountries (U.K.: 4.25 and Germany: 4.08) are poised to rocket.Mobile Gaming Apps Report: 2019 User Acquisition Trends & Benchmarks11
Registration costs & engagement rates by country: Russia and Brazilhave the clear cost advantageGaming Apps Costs & Conversion Rates by Country At 2.05, the cost to acquire a user who will complete a registration in Brazil is overfive times less than the cost in the U.S. market ( 10.7). What’s more, Brazil boasts aconversion rate of 69.3%, 25.6% greater than the U.S.Mobile Gaming Apps Report: 2019 User Acquisition Trends & Benchmarks12
Significantly, Russia is the second cheapest country to acquire a user, and theconversion rate (56.4%) is impressive. It’s also comparable to Canada (52.1%) but offersmuch better value for money since the cost in Russia ( 3.85) is 60.8% lower than inCanada ( 9.83). Nearly identical conversion rates in Germany (67.0%) and Japan (67.4%), coupled with a 1.85 difference in cost to acquire a user who will complete a registration, may not be asteal, but they do spell opportunity.In-app purchase costs & engagement rates by country: Germany andthe U.K. are willing to play and pay Germany, the U.K. and Russia offer comparable costs, but the U.K. offers the lowestcost ( 24.53) and the highest engagement (17.3%), a conversion rate that is 9.9% higherthan Russia (7.4%). When it comes to cost, Brazil ( 33.88) and Canada ( 33.43) are nearly identical. Butthat’s where the similarities stop. At 15.3%, the conversion rate in Canada is 3.5x therate of Brazil (4.2%). Predictably, Korea, an incredibly sophisticated market where Midcore & Strategygames enjoy wide appeal, is also the most expensive. High competition for users hasdriven costs into the stratosphere ( 66.95), and the conversion rate of 5.5% suggestsmarketers risk burning more cash than they generate.At 24.53, the U.K. offers the lowest costto acquire a gaming app user that makesa first in-app purchase and the highest engagement rate (17.3%).Mobile Gaming Apps Report: 2019 User Acquisition Trends & Benchmarks13
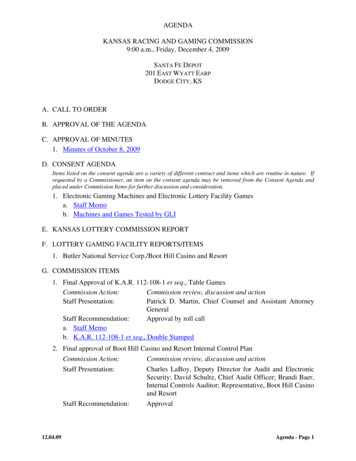
Retention rates by gaming app category: Social Casino and Casual Gamesgrab and keep user attentionEach gaming sub-category has its own audience and appeal. Understanding thesenuances will help you drive connection with your users and develop campaigns that willextend your customer lifecycle.Gaming Apps User Retention by Subcategory Social Casino (32.2%) and Hyper Casual (32.7%) gaming apps may rival each otherfor the top notch spot on Day 1. But Social Casino pulls out ahead by Day 3, aleading position it maintains into Day 30, proving this is a sub-category that greatlybenefits from the staying power of the social and competitive elements it combines ingameplay.Mobile Gaming Apps Report: 2019 User Acquisition Trends & Benchmarks14
At just 28.5%, Midcore & Strategy may seem to get off to a slow start on Day 1, but itpicks up speed. A milestone to note is Day 14, when the retention rate (5.2%) nearlyties with that of Casual games (5.4%) to take third place. Significantly, the gap in retention rates for Casual, Hyper Casual, and Midcore &Strategy narrow at Day 7 and again on Day 14, indicating that audiences are equallyengaged and perhaps equally receptive to campaigns and messaging that reinforcethe value proposition of the games that attracted these players in the first place. With the highest retention rate on Day30, Social Casino greatly benefits fromthe staying power of the social andcompetitive elements it combines ingameplay.Mobile Gaming Apps Report: 2019 User Acquisition Trends & Benchmarks15
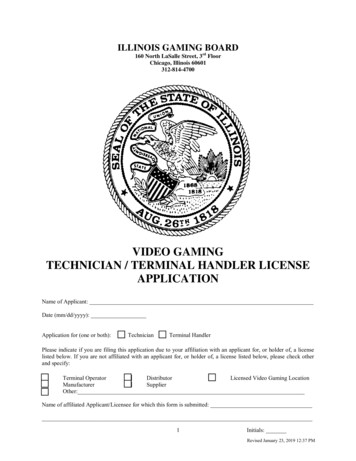
Midcore& StrategyThis category, which includesrole-playing games (RPGs) andadventure games, distills hardcoregames down to their essence,delivering users a more lighthearted and immersive experience.Shorter sessions empower the30-somethings who make upthe majority of the audience tofit gameplay around their dailyschedule, and not the other wayaround.EXAMPLES:Empires & Allies, War Machines: 3D TankGames, War Robots, Vikings: War of Clans,Narcos: Cartel Wars and Game of Thrones:Conquest.Mobile Gaming Apps Report: 2019 User Acquisition Trends & Benchmarks16
Midcore & Strategy Gaming Apps:A passion, not a pastimePositioned at the intersection of immersive experience and casualgameplay, this sub-category appeals to an audience that is botheager to play and willing to pay.Midcore & Strategy Gaming Apps Costs & Conversion Rates Competition for Midcore & Strategy gamers is heating up, but CPIs are keeping cool ata comfortable 3.81. At 35.79, the price tag for a user who makes an in-app purchase may seem pricey,but this is balanced by a double-digit conversion rate that speaks volumes. Overall, users aren’t an easy sell, but they don’t balk at spending time and money tomaster the addictive gameplay.Apptopia data pegs worldwide downloads of Midcore & Strategyapps at 192,022,661, generating 5,644,667,096 in in-apppurchase revenue.Mobile Gaming Apps Report: 2019 User Acquisition Trends & Benchmarks17
In-App purchase costs show a positive trend YoY Costs are decreasing, and conversion rates are stable deep in the funnel, where itcounts the most. Install-to-in-app purchase costs are down by a factor of over 2.5 from 95.39 in 2017to 35.79 in this year’s report. Registration, where costs ratcheted up 72.0% to reach 10.61, appears to be the biggest hurdle. Install-to-in-app purchase conversion rates dipped 3.2 percentage points to reach10.6%, compared to 13.8% the previous year.Midcore & Strategy Gaming Apps Costs & Conversion Rates YoYInstall costs converge, but EMEA may be the ‘next opportunity’At 3.53 CPIs in EMEA offer value for money, coming in 4.3% under APAC ( 3.69) and awhopping 21.0% under North America ( 4.47).Mobile Gaming Apps Report: 2019 User Acquisition Trends & Benchmarks18
Midcore & Strategy Gaming Apps Install Costs by RegionBig fans in APAC, but the action is in EMEA At 8.02, EMEA takes the lead with both the lowest cost to register and the highestinstall-to-register conversion rate (77.4%). The difference in cost with the second placerunner APAC ( 9.97) is 1.95 or 19.6% less. But don’t let the bargain blind you. EMEAtowers with a conversion rate that is more than 2X that of the APAC region. Deeper in the funnel, EMEA also offers better value for money. At 33.87, the costto acquire a user who completes an in-app purchase may not be a steal. But it isnonetheless 27.0% lower than APAC ( 46.41) and a conversion rate 10.5% higher thanboth the APAC and North America ensures high returns, not losses.Midcore & Strategy Gaming Apps Register & Purchase Costs & Conversion by RegionMobile Gaming Apps Report: 2019 User Acquisition Trends & Benchmarks19
U.S. deep-dive Install costs are a steal in the U.S.USA Midcore & Strategy Gaming Appsat 4.34, 2.9% less than the NorthCosts & Conversion RatesAmerica region ( 4.47). However, thecost to acquire a user who completes aregistration ( 13.85) is pricey — comingin 7.5% higher than the cost for NorthAmerica ( 12.89). Compared to the rest of North America,the cost to acquire a user who makesan in-app purchase is slightly higherthan the region, but this is balanced byhigher conversion rates. Conversion rates are attractive andthe install-to-in-app-purchase (11.6%)is 48.7% greater than the rate for theApptopia data pegsdownloads of Midcore &Strategy ap
to app market data provider AppAnnie. It reckons a whopping 74% of all consumer spend on Google Play and Apple iTunes app stores are driven by mobile games. The mobile gaming apps market continues to thri