Transcription
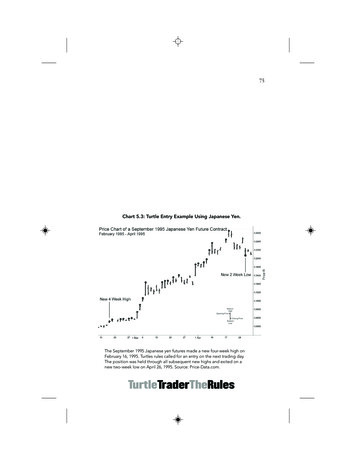
75Chart 5.3: Turtle Entry Example Using Japanese Yen.The September 1995 Japanese yen futures made a new four-week high onFebruary 16, 1995. Turtles rules called for an entry on the next trading day.The position was held through all subsequent new highs and exited on anew two-week low on April 26, 1995. Source: Price-Data.com.Ab aYRA NQR AUR?bYR
76Chart 5.4: Turtle Long Entry Example Using Natural Gas.A new fifty-five-day high was made in November 2005 Natural Gas on July12,2005. The market continued making new highs until a peak on October 5,2005. Source: Price-Data.com.Ab aYRA NQR AUR?bYR
78Chart 5.5: Turtle Short Entry and Exit Example Using Eurodollars.The December 2006 Eurodollars made a new 55-day low, signaling an entry, onFebruary 20, 2006. The market briefly moved lower before making a new twentyday high on March 16, 2006. Short positions in the market were exited with a loss.On March 29, 2006, the market made a new low and short positions were reestablished. The market continued making new lows before an exit signal, a newtwenty-day high, occurred on July 14, 2006. Source: Price-Data.com.Ab aYRA NQR AUR?bYR
81Table 5.6: September 2006 Kansas City Wheat FuturesATR Calculations 1/06519.0007/12/0607/13/0620-DayMovingAverageof theTrue TrueRange RangeTR 1TR 2TR .509.751.0010.7510.75Ab aYRA NQR AUR?bYR 11.0011.94
82Chart 5.7: Chart Showing Dell Daily Bars with Daily ATR.Daily Price Chart of Dell Computers with ATR valued in dollars plotted below.Athe ATR fluctuates as the market moves up and down on any given day.Source: Price-Data.com.Ab aYRA NQR AUR?bYR
85Chart 5.9: Chart Showing Soybean Daily Bars with Daily ATR.Daily price chart of May 2004 Soybean Futures shows a smaller ATR at the beginning of the trend. A smaller ATR allows for more contracts to be traded via Turtlemoney-management rules. By the end of the trend, ATR has expanded greatly,reducing the size of the position you can have on. Source: Price-Data.com.Ab aYRA NQR AUR?bYR
123AUR R S\ ZN[PRTable 7.1: Annual Turtle Performance.1984198519861987111%Mike Cavallo14%100%34%Jerry Parker 10%129%124%37%Liz Cheval 21%52%134%178%Stig Ostgaard20%297%108%87%Jeff Gordon32%82%51%11%Mike CarrJim MelnickHoward 19851986132%129%78%Tom Shanks18%170%146%Jim DiMaria71%132%97%Brian Proctor55%116%185%Paul Rabar92%126%78%Mike O’Brien99%135%78%Phil LuiSource: Barclays Performance Reporting (www.barclaygrp.com).
AUR0\Z]YRaRAb aYRA NQR124Table 7.2: 1985 Month-by-Month Performance for Mike Cavallo,Jerry Parker, and Liz Cheval.DateMike Cavallo RORJerry Parker RORLiz Cheval RORJan-8524.45%2.51%26.70%Feb-85 12.49%18.92%23.07%Mar-8555.73% 8.77% 20.29%Apr-85 15.39% 20.38% 27.80%May-854.50%17.52%72.49%Jun-852.50% 10.30% 22.48%Jul-8553.75%61.05%29.21%Aug-85 20.62%1.18% 18.77%Sep-85 34.21%11.25% 26.93%Oct-85 5.09%14.61% 6.60%Nov-8539.52%20.99%46.98%Dec-8522.82% 2.46%20.04%VAMI (Value Added Monthly Index): An index that tracks the monthly performance of ahypothetical 1,000 investment as it grows over time.ROR: Rate of return.Source: Barclays Performance Reporting (www.barclaygrp.com).
Chart 5.3: Turtle Entry Example Using Japanese Yen. The September 1995 Japanese yen futures made a new four-week high on February 16, 1995. Turtles rules called for an entry on the next trading day. The position was held through all subsequent new highs and exited on a ne