Transcription
Profiler: Integrated Statistical Analysis andVisualization for Data Quality AssessmentSean Kandel , Ravi Parikh , Andreas Paepcke , Joseph M. Hellerstein† , Jeffrey Heer Stanford† University of California, BerkeleyUniversity{skandel, rparikh, paepcke, jheer}@cs.stanford.edu, hellerstein@cs.berkeley.eduABSTRACTData quality issues such as missing, erroneous, extreme and duplicate values undermine analysis and are time-consuming to find andfix. Automated methods can help identify anomalies, but determining what constitutes an error is context-dependent and so requireshuman judgment. While visualization tools can facilitate this process, analysts must often manually construct the necessary views,requiring significant expertise. We present Profiler, a visual analysis tool for assessing quality issues in tabular data. Profiler appliesdata mining methods to automatically flag problematic data andsuggests coordinated summary visualizations for assessing the datain context. The system contributes novel methods for integratedstatistical and visual analysis, automatic view suggestion, and scalable visual summaries that support real-time interaction with millions of data points. We present Profiler’s architecture — includingmodular components for custom data types, anomaly detection routines and summary visualizations — and describe its application tomotion picture, natural disaster and water quality data sets.Categories and Subject DescriptorsH.5.2 [Information Interfaces and Presentation]: User InterfacesKeywordsData analysis, visualization, data quality, anomaly detection1.INTRODUCTIONData sets regularly contain missing, extreme, duplicate or erroneous values that can undermine the results of analysis. Theseanomalies come from various sources, including human data entryerror, inconsistencies between integrated data sets, and sensor interference. Flawed analyses due to dirty data are estimated to cost billions of dollars each year [6]. Discovering and correcting data quality issues can also be costly: some estimate cleaning dirty data toaccount for 80 percent of the cost of data warehousing projects [5].The statistics and database communities have contributed a number of automated routines for detecting dirty data, such as findingoutliers or duplicate records. While these techniques can reveal potential issues, human judgment is required to determine if the issuesare in fact errors and how they should be treated. For example, outlier detection might flag a high temperature reading; an analyst thenneeds to assess if the reading is an exceptional event or an error.Permission to make digital or hard copies of all or part of this work forpersonal or classroom use is granted without fee provided that copies arenot made or distributed for profit or commercial advantage and that copiesbear this notice and the full citation on the first page. To copy otherwise, torepublish, to post on servers or to redistribute to lists, requires prior specificpermission and/or a fee.AVI ’12, May 21-25, 2012, Capri Island, ItalyCopyright 2012 ACM 978-1-4503-1287-5/12/05 . 10.00.Discovering a potential error is only the first step towards cleandata. Before manipulating the data, an analyst may investigate whyan anomaly has occurred to inform possible fixes. The analyst mustplace the anomaly in context by scrutinizing its relationship withother dimensions of the data. Appropriately-chosen visualizationscan help reveal and contextualize these anomalies. Histograms andscatter plots, for instance, may reveal outlying values in a distribution. Analysts typically have to choose which views to construct:they must determine which subset of data columns and rows to visualize, how to transform the data, choose visual encodings, andspecify other criteria such as sorting and grouping. Determiningwhich visualizations to construct may require significant domainknowledge and expertise with a visualization tool.In response we present Profiler, a visual analysis system to aiddiscovery and assessment of data anomalies. Profiler uses type inference and data mining routines to identify potential data qualityissues in tabular data. Profiler then suggests coordinated, multiview visualizations to help an analyst assess anomalies and contextualize them within the larger data set.Our first contribution is an extensible system architecture thatenables integrated statistical and visual analysis for data quality assessment. This modular architecture supports plug-in APIs for datatypes, anomaly detection routines and summary visualizations. Wepopulate this framework with commonly-needed data types and detection routines. We focus primarily on univariate anomalies dueto their frequency, tractability, and relative ease of explanation.We demonstrate how coupling automated anomaly detection withlinked summary visualizations allows an analyst to discover andtriage potential causes and consequences of anomalous data.Our architecture also introduces novel visual analysis components. We contribute a technique for automatic view suggestionbased on mutual information. Profiler analyzes the mutual information between table columns and the output of anomaly detectionto suggest sets of coordinated summary visualizations. Our modelrecommends both table columns and aggregation functions to produce visual summaries that aid assessment of anomalies in context.We also contribute the design of scalable summary visualizations that support brushing and linking to assess detected anomalies. Through linked selections, analysts can project anomalies inone column onto other dimensions. Our aggregate-based summaryviews bin values to ensure that the number of visual marks depends on the number of groups, not the number of data records. Weprovide optimizations for query execution and rendering to enablereal-time interaction with data sets in excess of a million rows.2.RELATED WORKProfiler draws on three areas of related work: anomaly detection,data cleaning tools, and visual analysis systems.2.1Classifying Data AnomaliesThe database and statistics literature includes many taxonomiesof anomalous data [5, 7, 10, 19, 24, 33]. These taxonomies inform
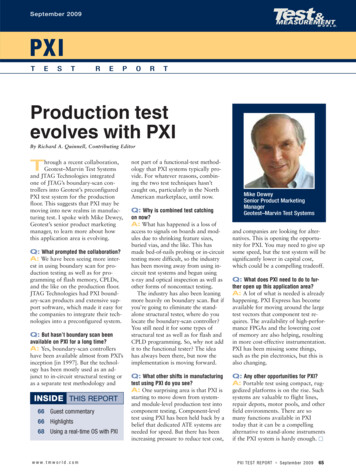
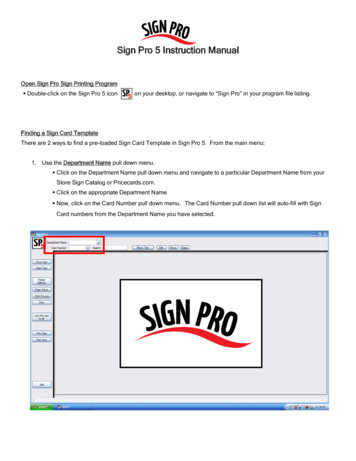
Major Genre0Distributor240Production Budget3KRelease LocationError (2)Extreme (7)Inconsistent (3)00300MBased on Short FilmSpin-OffBased on Factual Book/.Disney RideCompilationBased on ToyMusical Group Movie0100Worldwide Gross3K03B0Distributor (Levenshtein)Source (Levenshtein)Title (Levenshtein)Schema (1)Schema BrowserTransform:Creative TypeDistributorMPAA RatingRPG-13PGNot RatedGNC-17OpenIMDB RatingIMDB VotesMPAA RatingMajor GenreCreative TypeContemporary FictionHistorical FictionFantasyScience FictionDramatizationKids FictionFactualSuper HeroMultiple Creative TypesProduction BudgetRelated Views:AnomaliesRelease Date220Anomaly BrowserMissing (6)MPAA RatingCreative Type19112010Running Time (min)2KSourceMajor GenreDistributorRelease LocationError (2)Extreme (7)Inconsistent (3)Distributor (Levenshtein)002400Production Budget3K0300M0SourceOriginal ScreenplayBased on Book/Short StoryBased on Real Life EventsRemakeBased on TVBased on Comic/Graphic.Based on PlayBased on GameTraditional/Legend/Fai.Based on Magazine ArticleBased on Musical/OperaBased on Short FilmSpin-OffBased on Factual Book/.Disney RideCompilationBased on ToyMusical Group MovieMajor rrorRomantic ComedyMusicalDocumentaryBlack ComedyWesternConcert/PerformanceUS DVD Sales0Rotten Tomatoes Rating90001000Worldwide Gross3K03B0Source (Levenshtein)Title (Levenshtein)Figure 1: The Profiler User Interface. The UI contains (clockwise from top-left): (a) schema browser, (b) formula editor, (c) canvas ofSchema (1)linked summary visualizations, and (d) anomaly browser. Profiler generates a set of linked views for each identified anomaly. Here,we investigate possible causes of missing MPAA movie ratings. The grey bar above the MPAA rating chart indicates missing values;we select it to highlight matching records. The Release Date chart shows that missing ratings correlate with earlier release dates.a variety of algorithms for detecting outliers [4, 10, 12, 33], duplicate records [7], and key violations [13]. While these routines flagpotential issues, most types of error require some form of human intervention to assess and correct [19]. Here, we focus on errors thatarise within a single relational table. Guided by prior taxonomies,we identified five categories of anomalies to address in Profiler:Missing data results from a number of sources, including incomplete collection or redaction due to privacy concerns. Missing data can take the form of missing records or missing attributes.These issues can lead to a loss of statistical power if too many casesare unobserved and can introduce bias into model estimates, especially when data is not missing at random [1].Erroneous data can arise because of error during data entry,measurement, or distillation [10]. Obviously, analysis of incorrectdata can lead to incorrect conclusions.Inconsistent data refers to variable encodings of the same value.Examples include variations in spelling or formatting, measurement units, or coding schemes (e.g., names vs. abbreviations).Extreme values such as outliers can undermine robust analysisand may be erroneous. Extreme values may be standard univariateoutliers, or may be type specific. For example, time-series outliersgenerally take two forms [33]: an additive outlier is an unexpected,transient movement in a measured value over time, whereas an innovation outlier is an unexpected movement that persists over time.Key violations refer to data that violate primary key constraints.For example, having two employees with the same social securitynumber violates the assumption that SSN is a key.Observed issues can fall into multiple categories: a numeric outlier may result from an accurate measurement of an extreme value,a data entry error, or from inconsistent units (feet vs. meters).2.2Data Cleaning ToolsMotivated by the issues above, database and HCI researchershave created interactive systems for data cleaning. Many of theseinterfaces focus on data integration [9, 15, 21, 27, 34] or entity resolution [17]. Here we focus on data quality issues in a single table.Profiler does include detectors for duplicate values, but we do notattempt to address the general problem of entity resolution.Other interfaces support mass reformatting of raw input data [14,16, 25, 29]. A common form of discrepancy detection is providedby data type definitions that specify constraints for legal values [16,25, 29]. These systems are usually limited to finding formattingdiscrepancies for individual values. Profiler’s data types are similarto domains in Potter’s Wheel [25] and Scaffidi et al.’s Topes [29].However, Profiler detects a broader range of discrepancies, including distribution-dependent outliers and duplicate values. Unlikethese prior tools, Profiler also generates scalable interactive visualsummaries to aid anomaly assessment.Perhaps most comparable to Profiler is Google Refine [14], whichsupports both faceted browsing and text clustering to identify dataquality issues. Refine users must manually specify which facetsand clusters to create. In contrast, Profiler automatically suggestsvisualizations to aid discovery and assessment of discrepancies.Profiler is integrated with the Wrangler [16] data transformationtool. An analyst can transform raw data using Wrangler. Once thedata is properly formatted as a relational table, Profiler can leveragetype information to automate anomaly detection and visualization.2.3Visual Analysis SystemsVisualization can support discovery of patterns in data, including anomalies [18]. Aggregation, clustering and sorting have beenused in various contexts to support scalable visualization for large
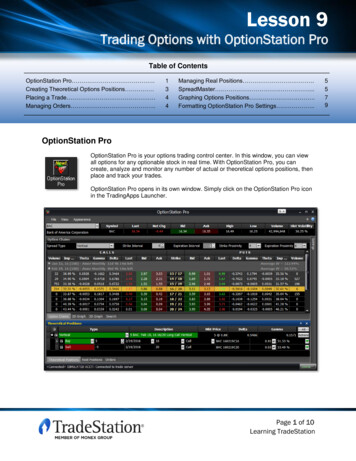
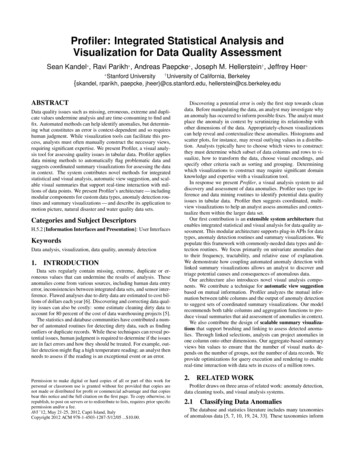
Transform:Creative TypeDistributorIMDBRatingdata sets [3, 20, 28, 35]. Through linkedhighlighting(“brushing& linking”), coordinated multiple views enable assessment of relaIMDB Votestionships between data dimensions [22, 36]. Profiler’s visualizationlayer extends this prior work with a set MPAAof type-specificaggregateRatingvisualizations that aid assessment of data quality issues.Visual analytic tools such as Tableau[31], GGobiand ImRelatedViews:[32],Contextprovise [36] enable analysts to construct multi-dimensional viewsAnomalyBrowserof data. However, these tools generallyrequireusers to choosewhich variables to visualize. As the numberMissingof(5)data subsets explodes combinatorially, analysts must oftenon significant doMPAA relyRatingmain expertise to identify variables thatCreativemay containType or help explainanomalies. To facilitate the view selectionSourceprocess, Profiler automatically suggests both data subsets andappropriate summary viMajor Genresualizations based on identified anomalies and inferred data types.DistributorWhile other tools support general exploratory analysis, Profiler proError (1)vides guided analytics to enable rapid quality assessment.Extreme (7) Production BudgetOthers have explored interfaces for guiding analysis and suggestIMDB Rating Release Dateing appropriate views. Social Action [23] uses a wizard-like interIMDB Votes Release Locationface to guide users through social networkanalysis. Seo and ShneiRotten Tomatoes RatingProductionBudgetderman’s rank-by-feature framework [30]sorts histogramsand scatTime (min)RunningTime(min)terplots of numeric data according to user-selectedRunningcriteria.OthRelatedUS clusteringDVD Salesers have used dimensionality reduction,andViews:sortingNonetoaid visualization of multidimensional data[8, 11,Anomaly37]. InBrowserProfiler,US GrossMissing (6)analysiswe use anomaly detection followed by mutualinformationWorldwideGrossRatingto suggest a set of coordinated summaryviews forMPAAassessingInconsistent(3) Type dataCreativequality issues. Our suggestion engine automatestheSourcechoice of dataSchema (1)Major Genrecolumns, aggregation functions and visual encodings.DistributorRelease Location3.USAGE SCENARIOSchema BrowserError (2)Extreme (7)Inconsistent (3)Schema (1)TypeBefore describing Profiler’s architecture, we begin with a repreCreativesentative usage scenario. Consider an example task, using movieDistributordata compiled from IMDB, Rotten Tomatoesand The Numbers.This data set contains 16 columns and overmovies. The dataIMDB3,000Ratingincludes metadata such as the title, primaryproductionlocation, diIMDB Votesrector, MPAA rating, and release date; financial information suchRatingas DVD sales and worldwide gross; andMPAAIMDBratings.An analyst is interested in which factorsaffecta movie’s eventualMajorGenrerevenue. She first loads the data into Profilerto assessoverall dataProductionBudgetquality. The interface shows a schema browser, anomaly browser,Noneformula editor and an empty canvas Related(Figure 1).Views:The schemabrowsershows the column names in the data set; the analyst could doubleAnomalyBrowserclick column names or drag them intothe canvasto visualize thecorresponding column. Instead, she examinesMissingthe(6)anomaly browser.The anomaly browser displays potentialMPAA qualityRating issues, groupedby issue type and sorted by severity. Foreach issue,CreativeType Profiler lists thecolumns containing the issue and the nameof the detection routineSourcethat flagged the anomaly. The analyst clicks the MPAA RatingMajor Genrelabel in the missing values group. In response, Profiler displays theDistributorMPAA Rating data as a categorical barchart showing the countsRelease Locationfor each rating type. The chart title includesa data summary bar:Errorindicate(3)green bars indicate parsed values, red barstype verificationerrors, and grey bars indicate missingExtremevalues. (7)Inconsistent(3)Curious why so many values are missing,the analystadds re(Levenshtein)lated visualizations by selecting the Distributor‘Anomaly’ optionin the related views menu — this operation requeststhat might exSource views(Levenshtein)plain the observed anomaly. She thenselectsthe grey bar in theTitle(Levenshtein)MPAA Rating chart to see how missingvalues project across otherSchema (1)columns (Figure 1). She finds that missing ratings correlate withearly release dates. While this is interesting, she determines thatthe missing values don’t have a strong relationship with any financial figures. This result holds for other columns with missing data.The analyst next decides to look at extreme values in financialfigures and clicks Worldwide Gross in the ‘Extreme’ anomaly list.Worldwide GrossRelease Date2800028000000000US Gross260008000000000Production Budget240003000000000IMDB Votes350JanDec0Major rrorRomantic ComedyMusicalDocumentaryBlack ComedyWesternRunning Time (min)Concert/PerformanceFigure 2: Automatically generatedviews to help assess World26001800wide Gross. Worldwide Gross correlates with high US Gross0andProduction Budgets.High0 grossalso coincides with Action06000000240&USAdventuremovies and the Summer & Winter seasons. ProDVD SalesTransform:filerchose to bin Release Date3000by month instead of by year.Worldwide Gross vs US GrossRelease Location22002240000000000Figure 3: Map assessing 2D outliers in a binned scatter plot. Selected in the scatter plot are movies with high Worldwide Grossbut low US Gross (in orange). Linked highlights on the mapTransform:confirm that the movies were released outside of the US.TitleThe Texas Chainsaw MassacreThe Texas Chainsaw Massac.Final DestinationFinal Destination 2Final Destination 3HalloweenHalloween 2Halloween IIMission: ImpossibleMission: Impossible 2Mission: Impossible IIIPredatorPredator 2PredatorsSpider-ManSpider-Man 2Spider-Man 3Title 2001The BrothersThe OthersTitle 2004Dawn of the DeadShaun of the DeadTitle 2008Day of the DeadDiary of the DeadThe ReaderThe RockerTitle 2009The InformantThe InformersTitle 2003Figure4: Conditioned duplicate detection. Left: Movie titlesThe GrudgeThe Grudge by2 Levenshtein distance reveal over 200 potential duclusteredThe Pledgeplicates. Right: Conditioning the clustering routine on ‘ReleaseToy StoryYear’reducesthe number of potential duplicates to 10.Toy Story2Toy Story 3A25thhistogramreveals a small number of high grossing movies. ToHourRush Hour explanatory visualizations, the analyst selects ‘Data ValgenerateRush Hour 2ues’Rush fromHour 3 the related views menu — this operation requests viewsthatScarymightMovie help explain the total distribution of Worldwide Gross,ScaryMovie2notjustflaggedanomalies. She mouses over the bars at the highScary Movie 3endthe4Worldwide Gross histogram and sees that these valuesScaryofMoviecorrelatewith high values in other financial figures, such as U.S.American PieAmericanPie 2Gross(Figure2). She notices that Action and Adventure moviesBig Momma'saccountforHousea disproportionate number of highly grossing movies.Big Momma's House 2Thetime-series view reveals that these films spike during the sumCheaper by the DozenmerandbyholidayThe view groups release dates by monthCheaperthe Dozenseasons.2ratherChild's thanPlay year, as binning by month produces a stronger relationChild'sPlay Worldwide2shipwithGross. The analyst is now confident that e, not errors in the data.Creepshow 2Doctor DolittleDoctor Dolittle 2Friday the 13th Part 2Friday the 13th Part 3Kill Bill: Volume 1Kill Bill: Volume 2Men in BlackMen in Black 2Creative TypeContemporary FictHistorical FictionFantasyScience FictionDramatizationKids FictionFactualSuper HeroMultiple Creative T
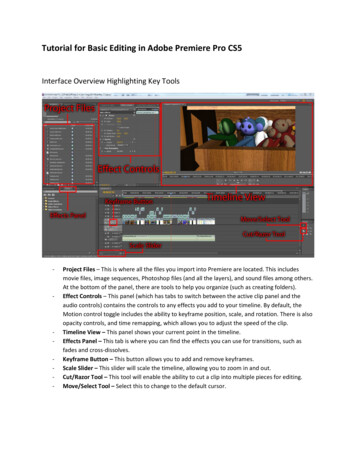
The analyst decides to explore the seemingly strong relationshipbetween Worldwide Gross and U.S. Gross. The analyst first selects ‘None’ in the related views menu to de-clutter the canvas. Shedrags U.S. Gross from the schema viewer onto the histogram displaying Worldwide Gross to create a binned scatterplot. The dataappear to be log-normally distributed so she uses the chart menu toset log scales for the axes. She notes outlying cells containing verylow U.S Gross values compared to Worldwide Gross. She adds amap visualization by dragging Release Location to the canvas andconfirms that most of these movies were released outside the U.S(Figure 3). The analyst decides to filter these data points from thedata set so she chooses a filter transform from the transformationmenu. The formula editor shows a predicate based on the currentselection criteria and the analyst hits return to filter the points.The analyst notices that the Release Location map contains a redbar indicating erroneous country values. She decides to toggle themap visualization to a bar chart to inspect the erroneous values. Sheclicks the small arrow at the top-right of the chart to open the chartmenu and changes the visualization type. She filters the bar chartto only show erroneous values and sees a few ‘None’ and ‘WestGermany’ values. To fix these errors, the analyst selects a replacetransform in the formula editor menu and then specifies parameters;e.g., replace(Release Location, ‘West Germany’, ‘Germany’).Next, the analyst inspects the ‘Inconsistency’ list in the anomalybrowser. The analyst clicks on Title in order to spot potential duplicate records. Profiler responds by showing a grouped bar chart withmovie titles clustered by textual similarity (Figure 4). Unsurprisingly, the analyst sees that movies and their sequels are clusteredtogether. There also appear to be potential remakes of classic films.The analyst worries that there might also be misspellings of somefilms, but does not want to verify all the clusters by hand. Theanalyst reasons that true duplicates are likely to have the same Release Date and so decides to condition the text clustering anomalydetector on Release Date. The analyst clicks ‘Levenshtein’ nextto Title in the anomaly browser. A menu appears which includesselection widgets for conditioning anomaly detection on anothercolumn. After rerunning the detector, there are significantly feweranomalies to check. The analyst is satisfied that there are no duplicate entries and continues with her analysis.4.SYSTEM ARCHITECTUREUnderlying the Profiler application is an extensible architecturethat combines statistical algorithms and coordinated visualizations.The system is implemented in JavaScript, and is intended to runinside browsers with optimized JavaScript execution engines. Thearchitecture consists of five major components.First, Profiler represents data tables using a memory-residentcolumn-oriented relational database. The database supports standard SQL-style queries for filtering, aggregation, and generatingderived columns. Unlike standard SQL databases, Profiler uses arelaxed type system: values can deviate from their column’s defined type. Profiler flags these values as inconsistent; they appearin red within a chart’s quality summary bar. The same database system also powers the Wrangler [16] data transformation tool. Profiler has access to the Wrangler data transformation language andextends it with additional transforms, including more advanced aggregation operations such as binning numeric data to compute histograms and mathematical operations for deriving new columns.The rest of the Profiler architecture consists of four modularcomponents (Figure 5). The Type Registry contains data type definitions and a type inference engine. Profiler uses types to chooseappropriate anomaly detection routines and visualizations. The Detector performs anomaly detection by combining type-aware fea-(a) Data Table(d) Anomaly Detectiont1(e) View Recommendationt2t3[.][.][.] a([.]) [][] 7derived anomalies101.8.1.7[.][.][.] [.][.][.][.][.](b) Type Inferencederived(c) Feature Generation(f) Interactive VisualizationFigure 5: The Profiler Architecture. An (a) input table is analyzed to (b) infer types for each column. Type information isused to (c) generate features prior to running (d) anomaly detection routines. The results of anomaly detection and mutualinformation analysis are used to perform (e) view recommendation and populate a set of (f) interactive visualizations.ture extractors and a set of data mining routines. Using detectedanomalies and the mutual information between columns, the Recommender suggests visualizations to help an analyst assess potential issues. The View Manager presents linked summary visualizations; it generates type-specific visualizations and executes coordinated queries across views to support brushing and linking. Wenow describe each of these components in detail.4.1Type RegistryThe Type Registry consists of a set of type definitions and routines for type inference. Each column in a data table is assigned atype, whether automatically via inference or manually by the user.At minimum, a Profiler type is defined by a binary verificationfunction: given an input value, the function returns true if the valueis a member of the type and false otherwise. Verification functionsinclude regular expression matches, set membership (e.g., dictionary lookup of country names) and range constraints (e.g., pH between 0-14). Profiler associates a type with an entire column, butnot all values in the column necessarily satisfy the type definition.Profiler includes built-in support for primitive types — boolean,string, and numeric (int, double) — and higher-order types suchas dates and geographic entities; e.g., state/country names, FIPScodes, zip codes. Profiler’s detector and view manager componentsrequire that all columns be assigned to a data type. The type systemis extensible: as new types are defined, anomaly detection and visualization methods can be specified in terms of pre-existing typesor new components (e.g., a novel type-specific visualization) thatplug-in to the Profiler architecture.A type definition may also include a set of type transforms andgroup-by functions. A type transform is a function that maps between types (e.g., zip code to lat-lon coordinate). These functionsform a graph of possible type conversions, some of which may belossy. User-defined types can include type transforms to built-intypes to leverage Profiler’s existing infrastructure. Group-by functions determine how values can be grouped to drive scalable visualizations. For instance, numeric types can be binned at uniformintervals to form histograms, while dates may be aggregated intomeaningful units such as days, weeks, months or years.Type inference methods automatically assign a type to each column in a data table based on the Minimum Description Lengthprinciple (MDL) [26]. MDL selects the type that minimizes thenumber of bits needed to encode the values in a column. MDL hasbeen used effectively in prior data cleaning systems, such as Potter’s Wheel [25]. We use the same MDL formulation in Profiler.4.2DetectorProfiler’s Detector applies a collection of type-specific data mining routines to identify anomalies in data.
Missing recordDetection Method(s)Outlier Detection Residuals thenMoving Average w/ Hampel X84VisualizationHistogram, AreaChartHistogram, AreaChartQuality BarHistogram, ScatterPlotOutlier Detection z-score, Hampel X84 Histogram, ScatterPlotMisspellingGrouped Bar ChartClustering Levenshtein DistanceOrderingClustering Atomic StringsGrouped Bar ChartRepresentationClustering Structure ExtractionGrouped Bar ChartSpecial charactersClustering Structure ExtractionGrouped Bar ChartErroneous entryOutlier Detection z-score, Hampel X84 HistogramExtraneous dataType Verification FunctionQuality BarMisfieldedType Verification FunctionQuality BarQuality BarWrong physical data Type Verification FunctiontypeNumeric outliersOutlier Detection z-score, HampelHistogram, ScatterX84, Mahalanobis distancePlotTime-series outliers Outlier Detection Residuals vs. Moving Area ChartAverage then Hampel X84Primary key violation Frequency Outlier Detection Unique Bar ChartValue RatioMissing valueMeasurement unitsFrequency Outlier Detection HampelX84Find NULL/empty valuesClustering Euclidean DistanceFigure 6: Taxonomy of Data Quality Issues. We list classesof methods for detecting each issue, example routines used inProfiler, and visualizations for assessing their output.4.2.1The Detection PipelineThe Detector determines which anomaly detection routines toapply, runs them, and produces output for visualization. This process has two phases: feature generation and anomaly detection.During feature generation, the Detector derives features of theinput columns to use as input to anomaly detection routines. Features are extracted using unary transformations called generators.For example, a generator might compute the lengths of string values; an anomaly detector might then compute z-scores to flag abnormally long strings. The Detector maintains a list of appropriate generators (including the identity function) for each type in theType Registry. Given an input table, the Detector applies generators to each input column according to its type signature. The resultis a set of feature columns that serve as input to anomaly detectors.Detection routines then analyze the feature columns. Detectionroutines accept columns as input and output two columns: a classcolumn and a certainty column. The class column contains integers; 0 indicates that no anomaly was found in that row. Non-zerovalues indicate the presence of an anomaly and distinct integers indicate distinct classes of anomaly. For example, the z-score routineoutputs a class column where each value is either 0 (within 2 standard deviations from the mean), -1 ( 2 stdev), or 1 ( 2 stdev). Thecertainty column represents the strength of the routine’s prediction.For z-scores, these values indicate the distance from the mean.The Detector organizes detection routines by the data types theycan process. After feature generation, the system visi
Spin-Off Based on Factual Book/. Disney Ride Compilation Based on Toy Musical Group Movie Source Drama Comedy Action Adventure Thriller/Suspense Horror Romantic Comedy Musical Documentary Black Comedy Western Concert/Performance Major Genre 100 0 900 Rotten Tomatoes Rating 0 3B 0 3K Worldwide Gross 0