Transcription
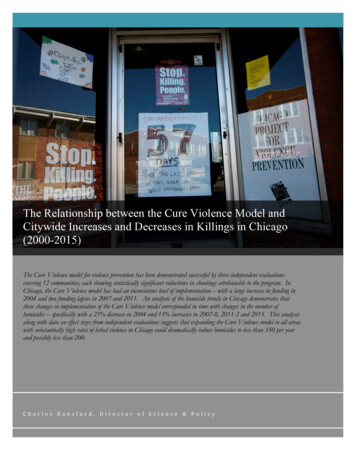
The Relationship between the Cure Violence Model andCitywide Increases and Decreases in Killings in Chicago(2000-2015)The Cure Violence model for violence prevention has been demonstrated successful by three independent evaluationscovering 12 communities, each showing statistically significant reductions in shootings attributable to the program. InChicago, the Cure Violence model has had an inconsistent level of implementation – with a large increase in funding in2004 and two funding lapses in 2007 and 2011. An analysis of the homicide trends in Chicago demonstrates thatthese changes in implementation of the Cure Violence model corresponded in time with changes in the number ofhomicides – specifically with a 25% decrease in 2004 and 15% increases in 2007-8, 2011-2 and 2015. This analysisalong with data on effect sizes from independent evaluations suggests that expanding the Cure Violence model to all areaswith substantially high rates of lethal violence in Chicago could dramatically reduce homicides to less than 350 per yearand possibly less than 200.C h a r l e sR a n s f o r d ,D i r e c t o ro fS c i e n c e&P o l i c y
BackgroundThe Cure Violence model for violence prevention, known in Chicago as CeaseFire, is a public healthapproach to violence prevention that stops lethal violence before it occurs and stops its spread byinterrupting ongoing conflicts, working with the highest risk to change behavior related to violence,and changing community norms. This model is based on proven public health techniques and isdesigned to have a community level effect, meaning that it does not just change individuals but alsochanges the entire community outcome as measured by shooting and killings. At some point, whenthe implementation of the model covers enough of the areas of a city with substantially high rates oflethal violence, the program is expected to have an effect on citywide levels of shootings and killings.This report examines the implementation status of the Cure Violence program from 2000 to 2012and compares it to the citywide trend in shooting and killing in Chicago. As shown in Figure #1below, there have been three periods in the past 10 years where killings in Chicago have had a largeincreases or decreases, and in each case this shift has coincided with a change in Cure Violenceimplementation. In 2004, a tripling of the Cure Violence program coincided with a precipitous 25%drop in killing. In 2008, 2012, and 2015, a large cut in Cure Violence coincided with a 15% jump inkillings. The chart shows a visually apparent connection in time between these trends. This reportwill detail our analysis of the evidence, which supports this connection.CeaseFire Funding and Homicides in ChicagoCeaseFiretripled700600CeaseFirepartially restoredCeaseFirepartially restored500400CeaseFireunstable fundingCeaseFirepartially interruptedCeaseFirepartially interruptedCeaseFirepartially 00920082007200620052004200320022001200019990Figure #1 – The trend in homicides in Chicago has had four major changes since 1999, all of which coincided in time with major changes to the CeaseFire program.In 2004, a tripling of CeaseFire coincided with a 25% drop in homicides. In 2008, 2012, and 2015 a partial shut down of CeaseFire coincided in time with a15% increase in homicides.2
More importantly, this report will conclude by examining the potential effect that could be had byexpanding the Cure Violence method throughout the communities in Chicago with substantiallyhigh rates of lethal violence. With a fully funded Cure Violence program working to supplement theefforts of law enforcement and community organizations, it is projected that homicides could bereduced to less than 350 per year and possibly much lower.Effectiveness of Cure Violence ModelThe effectiveness of the Cure Violence model lies in the innovative way in which it addressesviolence.1 First, the model utilizes workers who have a unique ability to detect and peacefullymediate conflicts within the community before they can turn violent. Evaluations have shown thatthese workers have been up to 100% effective in preventing retaliations and that their work isdirectly related to actual reductions in shootings and killings. Second, Cure Violence outreachworkers have the ability to identify and work with individuals at highest risk for involvement inviolence. The evaluation of the program in Chicago found that 84% of clients met the criteria forbeing high risk and that overall clients were given meaningful assistance in areas such as finding ajob, treating drug abuse, and leaving a gang.Cure Violence also implements a new angle in reducing violence by utilizing community messengersto shift community norms related to the acceptability of the use of violence. These efforts includecommunity based “responses to violence” by the community, as well as special events such as rallies,marches, community barbeques whereanti-violence messages are propagated, andCure Violence Model Evaluation Resultscommunity workshops and summits wherehigh risk individuals are convened to# of CommunitiesReduction inCitydiscuss the use of violence. Additionally, a(study period)EvaluatedShootingspublic education campaign, which has beenshown to effectively change otherChicago7-41% to -73%(2000-2008)behaviors such as smoking, is deployed tochange group and community normsBaltimore4(2007-2010)related to violence. An evaluation of the-34% to -44%implementation of Cure Violence inNew YorkBaltimore found that the program was1-20%(2009-2011)effective in reducing the acceptability ofthe use of violence in its targetFigure #2 – Cure Violence has had 3 independent evaluations covering 12 communities.communities, even among those that wereAll communities had large reductions.not active clients.Results from three independent evaluations have shown reductions in violence across 12 differentcommunities. In Chicago, shootings dropped by 41% to 73% in program communities.2 InFor a more detailed description of the components of the model, see the appendix at the end of this report.Overall reductions in shootings in the seven program sites were between 41% and 73%. When comparing to controlcommunities to control for other factors such as law enforcement, statistically significant reductions that werespecifically attributable to the CeaseFire program were found to be between 16% and 28% in four communities by time seriesanalysis. Hot spot analysis found reductions of shooting density between 15% and 40% in four partially overlappingcommunities. Six of the seven communities examined had reductions due to the program as determined by either timeseries analysis or hot spot analysis. The seventh community had -100% drop in retaliation homicides and largereductions in shootings, but the neighboring comparison community had similar reductions.123
Baltimore, homicides were reduced by up to 56% and shootings by up to 44%. In New York, therate of gun violence was found to be 20% lower than comparison neighborhoods afterimplementation of the program. The CDC funded Johns Hopkins study in Baltimore showed manyother positive effects as well, including a relationship between interruptions and less homicides, aneffect on norms related to use of firearms, and a positive effect in neighboring communities ofhaving the Cure Violence method operating “next door.”The following pages present the case for the connection between the level of implementation ofCure Violence in Chicago and the citywide increases and decreases in killings. While not acomparative analysis, the evidence presented suggests that fluctuations in the level of homicide wereat least partly a result of the level of Cure Violence implementation and that expanding the programcould substantially reduce killings across the city.2004 – 25% Drop in Homicide and Increase of CeaseFire Implementation in ChicagoIn 2004, CeaseFire received funding from the state of Illinois that allowed it to rapidly expand,approximately tripling in size – from 5 to 15 communities and from 20 to 80 workers. This sameyear, homicides dropped by an unprecedented 25% in Chicago. While CeaseFire was not covering alarge area of the city during this time, there is evidence that suggests that the program was a factor inthis large drop. First, the formal evaluation funded by the Department of Justice showed that theCeaseFire program was having an effect on shootings and killings that was attributable to theprogram at the neighborhood level during this year (Skogan et al., 2009).2004 CeaseFire Beats Had Larger Reduction in Homicide Rate40Cea35seFire BHomicides Rate3025eatsRest of Chicago20151050200220032004Figure #3 – In 2004, Homicides dropped in CeaseFire beats by 47% and inthe rest of the city by 23%.Further suggestion of the effect of the CeaseFirestrategy is information from beats whereCeaseFire was most active and where decreasesoutpaced the city’s overall drop. For example inthe 11th police district, where CeaseFire was activethe longest and where efforts were substantiallyincreased, there was a 56% drop in homicides.Also, beat 1413 in Logan Square, which had thehighest number of homicides (ten) of any beat inthe city in 2003 and where CeaseFire also had adoubling of activity (from 4 workers to 8workers), there were zero homicides in 2004.Overall, CeaseFire beats had a 47% reduction inhomicides in 2004, nearly twice the level ofreduction citywide.3CeaseFire may not have been the only factor in the decline in homicides in 2004, but it is likely thatit was one of the important factors. Among the other factors, the efforts of the Chicago PoliceDepartment are important to consider. An independent study of the Chicago Police Departmentefforts in 2004 looked at many aspects of the Chicago Police Department’s efforts including hotspot policing, targeted deployment (including Special Operations Section and Targeted ResponseThere was also a -40% citywide reduction in shootings in 2004, however a change in the definition of what wasclassified as a shooting occurred in late 2003 making analysis of shooting trends impossible. The shooting reductions inCeaseFire beats and districts were greater than the reductions in beats and districts without a program.34
Unit), and enhanced activities. No statistical evidence linking the police efforts to the reduction inhomicides in 2004 was found. Despite this lack of evidence, the researchers believed that a morethorough analysis could show some effect (Rosenbaum and Stephens, 2005).Another possible factor is the Project Safe Neighborhoods (PSN) program, which was active in twoChicago districts during 2004. PSN, however, actually started in January 2003, and therefore wouldnot be temporally linked to a reduction unique to 2004. Additionally, PSN was limited to only twopolice districts in 2004. This does not rule out PSN as a contributing factor and one analysis hassuggested that the program was effective in reducing homicides in two districts (Papachristos et al.2007).4It is likely that CeaseFire, Chicago Police efforts, and PSN all played a role in decreasing homicidesto historic lows in Chicago in 2004. There are other possible factors as well, including displacementthat occurred due to the closing of some public housing and gentrification. However, the role ofCeaseFire in the 2004 reduction is hard to ignore given the increase from 5 to 15 communities andfrom 20 to 80 workers at the same time as the reduction occurred. The other factors may haveplayed a role, but are not as correlated in time as the changes to the CeaseFire implementation.2007-2008 - 1st Homicide Increase and Interruption of CeaseFire in ChicagoIn September 2007, funding of CeaseFire was cut, temporarily shutting down the intervention in 15sites.5 Starting in the same month, September 2007, shootings in Chicago began to increase after along period of decline. From January to August of 2007, when CeaseFire was still active, shootingsdecreased by 155 and homicides by 11 compared to the same period in 2006. Beginning inSeptember 2007, however, shootings began to increase, and continued to increases consistently overthe next year with 11 of the next 12 months having an increase over the preceding year. After 12months, shootings had increased by 416 additional victims and homicides increased by 37 victims.As shown in Figure #4, the loss of funding had a drastic effect on the number of CeaseFire workersand clients. Prior to the interruption in funding, from January to August of 2007, there was anaverage of 61 CeaseFire outreach workers helping 529 highest risk participants.6 In September 2007,the number of outreach workers dropped from 61 to 4, and then rose slightly to an average of 15workers per month over the next year. The number of highest risk participants fell from 529 to 0for several months before the remaining outreach workers were slowly able to build back theircaseloads to just over 100 participants. As a result, more than 400 individuals who were trying to gettheir lives on a better path found themselves dropped from the program and left without assistanceWhile the analysis of the PSN program showed strong effects of the program, the analysis appears to have incorrectdata for the CeaseFire implementation and therefore could not have properly controlled for the CeaseFire effect. Forexample, the paper claims CeaseFire began in 1999 and that it was present in 50% of PSN beats, both incorrectstatements.5 There were 2 sites that secured private funding to reinstate workers after shutting down for 2 to 3 months. One othersite shut down for 4 of 7 months before stabilizing at half strength. The remaining sites shut down for at least 12months. Some of the sites maintained violence interrupters, but the outreach staff were cut effectively shutting downthe intervention.6 The external evaluation of the Chicago program confirmed that the program worked with the highest risk individualswith 84% of the participant meeting the criteria to be considered high risk.45
616 Communities65 Outreach Workers588 ClientsCeaseFire Active(by 155)Shootings DecreasinglJunJuApstguuAlJuApy%neJuayMCeaseFire Workers Cutfrom State BudgetCeaseFire Intervention Interrupted(by 416)Shootings 7Fe00y2ranuJaChange in Shootings (aggregated and compared to previous year)Figure #4 – The same month that CeaseFire was shut down, shootings started increasing after a long trend downward. While CeaseFire remained shut down, shootings increased in 11 of 12 months for an additional 416shooting victims and 37 additional homicide 01603501802007-2008 Cut in CeaseFire Coincides with Increase in ShootingsNumber of CF Outreach Workers & Clients
from CeaseFire. Several of the participants who were dropped are known to have been killed in thatperiod of increasing violence.7In addition to reducing the number of outreach workers, CeaseFire also laid off nearly two-thirds ofits violence interrupters,8 the workers tasked with meditating high-risk, potentially fatal conflicts.From January to August of 2007, 343 high-risk conflicts that were otherwise thought likely to resultin a shooting were instead mediated by CeaseFire workers, an average of 49 per month. After thefunding interruption, the number of high-risk conflicts mediated dropped to an average of 21 permonth. These conflict mediations are a major element of the Cure Violence model and have beenshown to play a major role in its effectiveness. The evaluation of CeaseFire in Chicago showed thatCeaseFire mediated interruptions were up to 100% effective in preventing retaliations homicides andthe evaluation of Baltimore confirmed a relationship between interruptions and reductions inhomicides.In addition to the decrease in CeaseFire implementation and the increasing shootings beginning inthe same month, the geographic location of the increases in violence during this period further tiesthis increase to the CeaseFire reductions. Fully 351 of the 416 additional shootings in Chicago overthe 12 months following September 2007 occurred in the districts where the CeaseFire interventionhad been removed; 82 of the shootings happened in the specific CeaseFire beats that were shutdown. Regarding homicides, the districts that had a program shut down had 41 additionalhomicides, with the remainder of the city actually having a reduction in homicides. The specificCeaseFire beats that were shut down had a subsequent increase of 18 additional homicides a yearafter the shut down.2007-2008 Former CeaseFire Districts Had Increases in Shootings- 20 to 100 more shootingsCF- 0 to 19 more shootings- Shootings decreasedCFCFCeaseFire remained active! in 14th which had decreaseCeaseFire was cut! large increases in shootingsFigure #5 – Many of the districts that had CeaseFire programs shut down also had largeincreases in shootings. One of the districts where CeaseFire remained active was one of thefew that had a decrease in shootings.As shown in Figure #5, many of the districtswhere the CeaseFire program was shutdown had large increases in shootings. Forexample, in the 7th police district, where theCeaseFire program maintained violenceinterrupters but did not have outreachworkers or community norm changeactivity, there were 100 additional shootingscompared to the previous year, 41 of whichwere in the former CeaseFire beats. Thiswas the largest increase in shootings of anyChicago Police district over this period. Inthe 5th police district, which also hadviolence interrupters but no outreach orcommunity norm change, had an increaseof 85 shootings. Beat 522, a formerCeaseFire community, had an additional 20shootings.This is based on anecdotal evidence from outreach workers and has not been otherwise documented.From January to October there were 27 to 35 violence interrupters. The number of violence interrupters dropped to12 from November through January. The number of interrupters fluctuated in 2008 between 12 and 21 violenceinterrupters.787
There were a few CeaseFire communities that were able to maintain an active program. Threepolice beats in the 14th district were able to maintain CeaseFire programs through the generoussupport of private funders and had continued decreases in shootings. After September 2007, whenthe other CeaseFire beats were shut down and the shootings were increasing, these CeaseFire beatsin the 14th district had a reduction of 14 fewer shootings and one fewer homicide.9 The 11th districtwas the one other district that maintained a full program, however the program was maintained inonly two beats while it was cut in five beats. Overall, the 11th district had an increase of 19shootings and decrease of 2 homicides, but the two active CeaseFire beats had no change inshootings and had a reduction of nine fewer homicides. The five CeaseFire beats that shut down inthe 11th district had an increase of 7 shootings and a decrease of four fewer homicides. 10Few other explanations have been offered for this increase in violence. The news media, whichlargely did not report on the increase that started in September 2007 until 2008 (see Rozas, May2008), put forth the theory that it could have been related to the hiring of a new policesuperintendent (see Rozas, July 2008). However, the superintendent did not join the departmentuntil February 2008, six months after the point at which the increase in shootings actually began.There is no other record of any change to law enforcement or criminal justice programs during thistime period.At the end of December 2008, CeaseFire funds were fully restored to the “pre-cut” level. In 2009,the number of workers and active community sites were fully restored, and there were 458 killings in2009 – essentially a full return to the 2007 number. Therefore not only were the increases in killingsconcurrent with the drop in CeaseFire staffing, but the subsequent reductions in killings alsofollowed the restoration of the program.2011 - 2nd Homicide Increase and Interruption of CeaseFire in ChicagoAs in 2007, in 2011 there was an interruption in the CeaseFire program, this time because of delaysin state contracting. During the period of implementation from January to June 2011, CeaseFire hadan average of 91 workers who were working with 423 high-risk participants per month, peaking inJuly 2011 with 562 participants. Beginning in July 2011 most of CeaseFire program sites shut down.In August, after implementation levels decreased, the number of high-risk participants was reducedto 227 and continued to drop, bottoming out in November at 134 participants. This means that 428of the highest risk individuals who CeaseFire was working with to get their lives on a better path11were dropped from the program and left without assistance from CeaseFire.9 Both Logan Square and Humboldt Park maintained staffing after two periods of program interruption in Novemberand December 2007 and again in February and March 2008. Of the 12 months being examined here, these twocommunities maintained at least 75% staffing in 8 months.10 There were two additional communities that maintained partial outreach staffs for the period in question, howeverthey did not have violence interrupters. The Auburn Gresham community shut down for two months and had half stafffor five months and had an increase of two shootings. The Woodlawn community shut down for three months, hadhalf staff for four months, and three-quarters staff for six months. This area of Woodlawn had an increase of fourshootings.11 The external evaluation of CeaseFire in Chicago showed that CeaseFire was 85% to 97% successful in meeting clientneeds on a number of areas including leaving a gang, finding a job, finishing their education, and getting drug treatment(Skogan et al., 2009).8
As with the 2007-2008 increase, this drop in CeaseFire implementation coincided with an increase inshootings and killings. There had been reductions in shootings and killings from January to August2011, with shootings decreasing by 62 (a 5% drop) and homicides by 37 (a 12% drop). If this samelevel of reduction had been maintained for the remainder of the year, homicides could have beenreduced to less than 400 in 2011, to an estimated 382 killings. Starting in September 2011, thesetrends reversed. From September 2011 to June 2012, homicides increased every month for a totalof 106 additional victims compared to the previous year. Shootings also increased, although theincrease did not begin until December 2011 and continued to March 2012 for a total of 109additional victims.2011-2012 Cut in CeaseFire Coincides with Increase in Homicides60%600CeaseFire funding interrupted500Participants levels climb to348, still 38.1% lower thanhighest level in 201140%20%CeaseFire participants levelsgo from 562 in July to 227 inAugust (59.6% drop)Avg. 423 participants/month# of Participants4000%CeaseFire clients levels reach theirlowest level of 134 participants300Avg. 265 participants/month!20%!40%!60%200!80%Aggregated Change in HomicidesMost of the sites that were shut downexperienced increases in homicides,shootings, or both, while the areas withCeaseFire sites that were able tomaintain funding were mostly able tocontinue to reduce homicides andshootings. Sites that previously had anactive CeaseFire program from Januaryto June that was shut down had asubsequent increase of 21 homicidesfrom September 2011 to June 2012compared to the previous year. Whenthese sites were active from January toJune 2011 they had a reduction of 5homicides.12 Shootings increased inthese sites by 10 additional shootingsfrom September 2011 to December2011 before decreasing in un-11Jul-11CF b-12Mar-12Change in HomicidesFigure #6 – In June 2011, CeaseFire lost most of its funding in Chicago and had to shut downmany sites. Starting in September, homicides increased after a large downward trend.This decrease in shootings in 2012 was largely due to a few very large decreases in a fewcommunities that had CeaseFire programs reinstated. For example, the Chicago Lawn communitywas cut from July 2011 to December 2012, but was able to rehire workers in January 2012 and wasable to maintain a partial staff of outreach workers and violence interrupters in 10 of 12 months. In2012, this one community had 28 fewer shootings than the previous year. By comparison, beats 833and 835, which had been part of the Chicago Lawn CeaseFire site in 2011, but were not able to bereinstated in 2012, had an increase in shootings of 6 additional shootings. Although the timing ofreinstatement and the decrease in shootings varied, and other communities did not have as large of areduction as Chicago Lawn, similar results occurred in CeaseFire. These sites were interrupted in2011 and homicide and shootings increases occurred, then reinstated in 2012 and decreasesoccurred.13Some sites that shut down had brief periods of program activity. It is theorized that this program activity was notconsistent enough to have a positive effect and could in fact have a negative effect.13 The decreases in homicides did not begin to occur until September 2012 while shootings decreases started in January2012.129
There were also a few sites that were able to maintain implementation throughout 2011 and 2012,although some experienced some short interruptions.14 These four sites covering 10 beats had areduction of 14 homicides and 4 shootings in 2011, including 5 fewer homicides and one fewershooting in the final 6 months when the rest of the city was increasing. In 2012, these sites had 3fewer homicides and 54 fewer shootings.There are many factors that affect violence in Chicago, but few appear as closely linked in time andplace as CeaseFire implementation levels. Law enforcement and criminal justice initiatives, whichare major factors that determine the level of violence in a community, may also have had an effect inthis period but were not able to be systematically reviewed. One of the leading theories in the mediawas that the unseasonably warm weather in early 2012 could have brought more people out,increasing the chance of conflict. However, this theory does not account for the increase inhomicides during the fall of 2011 (i.e. the increase started earlier), which preceded and followed asimilar trajectory in 2012. Furthermore, a separate review of other cities that also experiencedunusually warm weather – including Detroit, St. Louis, Indianapolis, and Cincinnati – did notexperience an increase in homicides.15Also telling is that no other violent crime category experienced a similar increase over this sameperiod. If law enforcement, criminal justice programs, or the weather were responsible, the increaselikely would have occurred for other crime categories as well. Since CeaseFire is a program thataddresses gun violence, specifically shootings and killings, it should not be surprising that around thetime that it was cut back, lethal violence increased while other crime did not.SummaryThis report describes the work of CeaseFire in Chicago and the added value it brings to the ongoinglaw enforcement efforts to reduce the number of shootings and killings in the city. The associationbetween the level of implementation of the CeaseFire program and the level of killings in Chicago isdiscussed in this report. Chicago had been on a long and continuous trend of decreasing shootingsand killings starting in 2001, coinciding with the start of the CeaseFire intervention. In 2004, thetripling of the CeaseFire program coincided with a sharp drop in killings. In mid-2007, theCeaseFire intervention was interrupted and shootings and killings started increasing during the exactsame month. These increases occurred in the same districts where CeaseFire used to work and notwhere the CeaseFire intervention remained active. No other explanation for this increase is as wellconnected in time and place as is the changes in CeaseFire implementation. In mid-2011, theCeaseFire program again experienced an interruption in funding, which again coincided with anincrease in shootings and killings. Additionally, we present data on the increase in homicides thathas coincided with the cut in CeaseFire funding in 2015 (this report will be updated when more datais available). These are four instances in which there was a documented and consistent correlationbetween CeaseFire implementation and trends in shootings and killings. And finally, CeaseFire has14 Seven of the 10 active beats had periods where the program shut down, but was active most months. The 3 otheractive beats had only 3 outreach workers instead of 4, but had very high levels of violence interrupters. There was oneadditional new site that was active only from January to June 2012 and had a reduction of 2 homicides.15 Of 265 cities with population over 100,000 for which data was available, 105 had an increase in homicides in the firstsix months of 2012. Chicago had, by far, the highest real number increase in homicides with 69 additional homicides.The next closest was Philadelphia with an increase of 26. Only seven cities had double digit increases (FBI UCR 2013).10
been shown to decrease shootings by three independent scientific evaluations, including studiesfunded by the U.S. Department of Justice and the Centers for Disease Control and Prevention.This report is short of a comparative analysis, which is impossible when considering the timeperiods, outcome variables, and that there are not cities that are truly comparable to Chicago andcan act as controls. Separate independent studies have been conducted by leading experts in bothcriminal justice and pu
Oct 08, 2019 · The Relationship between the Cure Violence Model and Citywide Increases and Decreases in Killings in Chicago (2000-2015)!! 2 Background The Cure Violence model for violence prev