Transcription
CHAPTERInformation SecurityMetrics13Would you believe us if we told you there was one metric, and only one, that wouldtell you everything you needed to know about an organization’s information securityrisk posture? No, probably not, and you’d be right. That said, the number of metricsrequired to gain a meaningful understanding of an organization’s risk posture is nothundreds, or even dozens. Not, at least, if you understand the key elements that driverisk into an organization.A comprehensive coverage of metrics isn’t possible in a single chapter. Therefore, our focus here is on understanding where and how metrics fit into an information security risk management program and how to leverage them effectively.To provide this understanding, we’ll share a framework you can use for identifyingmeaningful metrics and figuring out their value proposition. Of course, we’ll provideexamples, both in this chapter and the next one. Our examples will not be exhaustive,though. If you’re looking for exhaustive examples, there are a lot of books on themarket dedicated to information security metrics.Speaking of other books, if you’re looking for a very good book dedicated to thesubject of information security metrics, we really like IT Security Metrics by LanceHayden. Hayden goes into significant detail on the nature of data, statistics, andanalysis. For the data geeks in the crowd, we also really like another book entitledData-Driven Security: Analysis, Visualization, and Dashboards by Jay Jacobs andBob Rudis. We would like to think that the concepts and frameworks presented inthis book, and especially this chapter, will allow you to better leverage the wealth ofinformation in those books.TALKING ABOUT RISKThe word “data” can take a plural or singular form (e.g., “data are” or “data is”). Scientists and otherquants often prefer the plural form, while much of the rest of humanity seems to prefer the singularform. Fortunately, the word’s meaning does not change based on the form that is used, nor is thereconfusion about what it means. For those reasons, we didn’t sweat it. We hope you wouldn’t either,at least while reading this book.CURRENT STATE OF AFFAIRSThe use of metrics promises to take our profession from art to science (or at least tosomething less superficial and more science-like). In order to realize that promise,however, our profession has to solve a few fundamental problems first—problemsMeasuring and Managing Information Risk. -0Copyright 2015 Elsevier Inc. All rights reserved.293
294CHAPTER 13 Information Security Metricswe have beaten a drum about throughout this book. For example, without consistent and logical nomenclature, it becomes wickedly hard to normalize data or communicate effectively. After all, if one person’s “threat” is another person’s “risk” isanother person’s “vulnerability,” it is extremely difficult to find common ground.How do you know what data you need in the first place, and how do you apply data toderive meaningful results if your “models” look anything like “Threat x Vulnerability/Controls,” or are simply checklists? Finally, the only way your metrics becomemeaningful is if they support explicitly defined objectives that matter. In this chapter,we continue the process of tying together what has been covered in the earlier chapters—nomenclature, models, and objectives—so that you can leverage metrics moreeffectively.TALKING ABOUT RISKWe have heard the statement on more than one occasion that an important criterion for a “good”metric is that the data should be easy to acquire. Yes, it’s great when data acquisition is easy. but ifyou rely on that to drive which metrics you use, you may miss out on really important information.All we’re saying is don’t just rely on the easy stuff. Understand the decision you are trying to support and get the best information you can, given your time and resources.TALKING ABOUT RISKIt’s been our experience that information security organizations can often get away with havingrelatively useless (or worse, misleading) metrics. On numerous occasions, we have seen auditors,regulators, executives, and third-party assessors apparently attribute program maturity and effectiveness to a bunch of colorful charts and graphs, even when the metrics are either misleading or goentirely unused in decision-making.METRIC VALUE PROPOSITIONRemember what we said in the Risk Management chapter; that risk managementboils down to a series of decisions and the execution of those decisions? Well, thisentire chapter could perhaps be entitled “Decision Support” because the only reasonfor generating metrics is to inform decisions. In fact, if you’re publishing metricsthat aren’t being actively used in decision-making, then you are wasting time andresources. Because of this, we’re going to come at metrics with a clear eye towardtheir role in decision support. Behind every decision there are one or more goals thatan organization is driving toward. Before we go on, ask yourself what overarchinggoal might form the foundation for decisions within a risk management program.We’ll answer the question shortly, but here is a hint—we discussed it in the RiskManagement chapter.Within the metrics world, you may have heard people talk about the “Goal,Question, Metric” (GQM) method for developing good metrics. We really likethis approach because it helps people focus on and understand a metric’s value
Beginning with the end in mindproposition1. For example, the GQM approach might go about defining a metric inthe following way: Goal: Reduce the number of network shares containing sensitive information Question: How much sensitive information resides on network shares? Metric: Volume of sensitive information on network sharesThis is a clear and concise way to define that kind of metric. However, you haveto be a bit careful to not put the cart before the horse. The above example suggeststhat a decision had already been made regarding a different question. Perhaps thatdifferent question was, “Do we need to reduce the volume of sensitive informationon our network shares?” (Apparently, the answer was “yes”). There may have been aquestion before that; something like, “Do we have significant concentrations of riskassociated with sensitive information?” (Again, apparently the answer was “yes”).Absent the context of those questions and their subsequent decisions, chasing a metric like the volume of sensitive information on network shares might not be a gooduse of time even given a great metric definition method like GQM. We have to definethe big picture—those “macro goals”—first.In keeping with our decision-based focus, we would like to make a fairly subtle butimportant observation about the question component of GQM. In the above examplerelated to network shares, the original question was phrased as “how much,” yet theimplied questions that might have come before were phrased differently. The “Do weneed ?” and “Do we have ?” phrasing is more explicitly aligned with decision- makingbecause, depending on the answers, different actions may be required. The question of“how much” doesn’t explicitly relate to a decision or goal. Implicitly, perhaps, but it’simportant that we understand the decision context for the metric as explicitly as possible.Before we dive into the section on how to leverage GQM to make metrics meaningful, there is one more thing to point out—comparison. Specifically, metrics arefundamentally a means of making comparisons between, for example: Current conditions and desired future conditions Risk scenarios (prioritization) Mitigation options (selection) Past conditions and current conditions (efficacy of past decisions and actions)You may have noticed that this also aligns with the risk management stack—meaningful measurements enable effective comparisons, which enable well-informeddecisions. We love it when things come together like this.BEGINNING WITH THE END IN MINDSo, did you come up with any ideas regarding our question about an overarchingGQM-type goal for metrics? As you’ll recall from the Risk Management chapter, our1 TheIT Security Metrics book by Lance Hayden does a great job of discussing GQM.295
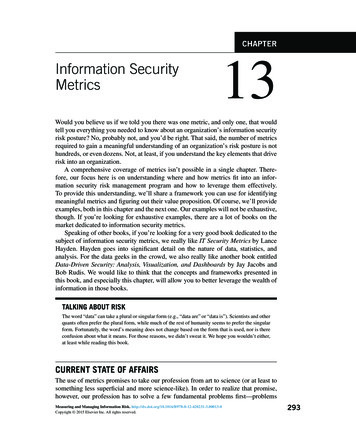
296CHAPTER 13 Information Security Metricsdefinition for risk management includes the phrase, “ cost-effectively achieve andmaintain an acceptable level of loss exposure.” That sounds suspiciously like a goalto us, so you get a diamond encrusted platinum star if that’s what you came up with.With that goal as our starting point, let’s continue to break this down and apply theGQM approach for our metrics. We can begin by breaking our overarching goal intofour subgoals: Being cost-effective Achieving alignment with the organization’s risk appetite Maintaining alignment with the organization’s risk appetite Defining the organization’s risk appetite (that “acceptable level of lossexposure”)The next step is to break these down into more granular subgoals.BREAKING IT DOWNIn this section, we’ll begin to break down our overarching goal into layers of subgoals, questions, and metrics. We’ll wait to discuss these subgoals until a little furtheron though, because some of the discussion will be lengthy. For now, let’s just coverthe outline.In the mind-map shown in Figure 13.1, we have broken out our four main subgoals into another layer of granularity. Once you have a handle on this layer ofabstraction, we think you will find it is pretty easy to figure out additional layers ofsubgoals, questions for these goals, and then the metrics that inform those questionsand their associated decisions.Not over or under controlCost-effectivelyOptimize solution selectionAcceptable rate of progressEfficient operationsGood risk landscape visibilityAchieveKnow the gapClose the gap. cost-effectively achieveand maintain an acceptablelevel of loss exposureMaintainAcceptable level of loss exposureFIGURE 13.1Mindmap of example risk management metric goals.Good risk management visibilityRemediate causes of varianceKnow the acceptable level of risk
Beginning with the end in mindBefore we move on, there are a few things we need to point out about the framework above: This framework may not be the only way to decompose the risk managementgoal. You may find that a different set of subgoals, questions, and metrics worksbetter for you, or you might find that this framework provides most of what youneed, only requiring a handful of your own tweaks. Efforts for achieving and maintaining will likely (should likely) run in parallel. If you aren’t tackling the root causes for variance and unacceptable lossexposure (primarily a part of the “maintain” function) even as you are mitigating current exposure, then your progress in achieving an acceptable level ofrisk is likely to be much slower. This is because even as you fix things, bad riskmanagement practices will be introducing risk elsewhere. Even if your organization achieves its desired level of risk, the dynamic natureof the risk landscape is undoubtedly going to throw occasional curveballs thattake the organization out of that comfort zone. Also, keep in mind that in somecases, management’s comfort zone may shift. Either way, you should view thisas a never-ending process. However, that has always been a mantra of information security and risk management, right?The bottom line is that the value of any metric should be defined within the context of a goal. When it comes to information security, that goal is to manage riskcost-effectively over time through better-informed decisions. Starting with that as thefocus, the rest is easy; or at least easier.MORE DETAILSOkay, let’s dig in and start to flesh this framework out a bit. As we do, you mightvery well identify questions and metrics (maybe even subgoals) that you would liketo add. If so, go for it. This table (Table 13.1) is not intended to provide the final wordon the topic or be entirely comprehensive. It’s intended to demonstrate the approachand provide a good starting point. You will note, too, that some metrics will supportmore than one question or goal.After this section, we’ll discuss each of the subgoals in greater detail to helpensure clarity and because some of them are particularly challenging in nature (e.g.,determining an organization’s acceptable level of loss exposure).One thing we hope you’ve noticed is that most of this is dependent on the abilityto measure risk. We’ll discuss this in greater detail further on, but we didn’t want tomiss the opportunity to drive home the point that effective risk management, particularly cost-effective risk management, is naturally dependent on risk measurementpractices. If risk measurement isn’t meaningful or is done poorly, then the odds ofeffectively managing risk go way down.You may note that we didn’t explicitly include examples related to reducing controls if, for example, an organization found it was overcontrolling loss exposure insome part of its risk landscape. Keep in mind though that the “close the gap” goal297
298CHAPTER 13 Information Security MetricsTable 13.1 Example Goals, Subgoals, Questions, and ot over or undercontrolAre we aligned with riskappetite?Optimize solutionselectionWhat is the most costeffective solution?Acceptable rateof progressAre we progressingtoward objectivesat the proper rate?Efficient operationsAre we focused on themost important things?Acceptable level of riskCurrent risk levelSolution costsSolution benefitsMilestonesCurrent risk conditionPrevious risk conditionElapsed timeForecast risk conditionAreas of risk concentrationKey control deficienciesResource utilizationResource costAchieveGood risk landscape visibilityIs the full cost-benefitof our resources beingrealized?Do we have goodvisibility?Know the gapHow far away fromalignment are we?Close the gapWhere does risk exist?What control deficienciesexist?Maintain
subject of information security metrics, we really like IT Security Metrics by Lance Hayden. Hayden goes into significant detail on the nature of data, statistics, and analysis. For the data geeks in the crowd, we also really like another book entitled Data-Driven Security: Analysis, Visualization, and Dashboards by Jay Jacobs and Bob Rudis. We would like to think that the concepts and frameworks presented in