Transcription
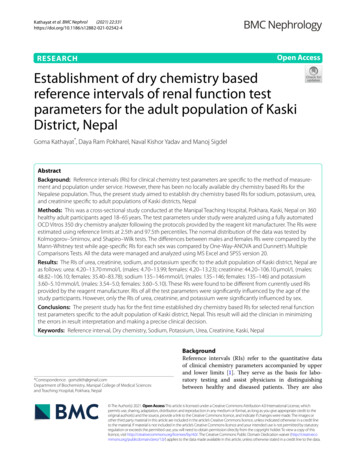
(2021) 22:331Kathayat et al. BMC pen AccessRESEARCHEstablishment of dry chemistry basedreference intervals of renal function testparameters for the adult population of KaskiDistrict, NepalGoma Kathayat*, Daya Ram Pokharel, Naval Kishor Yadav and Manoj SigdelAbstractBackground: Reference intervals (RIs) for clinical chemistry test parameters are specific to the method of measurement and population under service. However, there has been no locally available dry chemistry based RIs for theNepalese population. Thus, the present study aimed to establish dry chemistry based RIs for sodium, potassium, urea,and creatinine specific to adult populations of Kaski districts, NepalMethods: This was a cross-sectional study conducted at the Manipal Teaching Hospital, Pokhara, Kaski, Nepal on 360healthy adult participants aged 18–65 years. The test parameters under study were analyzed using a fully automatedOCD Vitros 350 dry chemistry analyzer following the protocols provided by the reagent kit manufacturer. The RIs wereestimated using reference limits at 2.5th and 97.5th percentiles. The normal distribution of the data was tested byKolmogorov–Smirnov, and Shapiro–Wilk tests. The differences between males and females RIs were compared by theMann-Whitney test while age-specific RIs for each sex was compared by One-Way-ANOVA and Dunnett’s MultipleComparisons Tests. All the data were managed and analyzed using MS Excel and SPSS version 20.Results: The RIs of urea, creatinine, sodium, and potassium specific to the adult population of Kaski district, Nepal areas follows: urea: 4.20–13.70 mmol/L (males: 4.70–13.99; females: 4.20–13.23); creatinine: 44.20–106.10 μmol/L (males:48.82–106.10; females: 35.40–83.78); sodium 135–146 mmol/L (males: 135–146; females: 135–146) and potassium3.60–5.10 mmol/L (males: 3.54–5.0; females: 3.60–5.10). These RIs were found to be different from currently used RIsprovided by the reagent manufacturer. RIs of all the test parameters were significantly influenced by the age of thestudy participants. However, only the RIs of urea, creatinine, and potassium were significantly influenced by sex.Conclusions: The present study has for the first time established dry chemistry based RIs for selected renal functiontest parameters specific to the adult population of Kaski district, Nepal. This result will aid the clinician in minimizingthe errors in result interpretation and making a precise clinical decision.Keywords: Reference interval, Dry chemistry, Sodium, Potassium, Urea, Creatinine, Kaski, Nepal*Correspondence: gomzikth@gmail.comDepartment of Biochemistry, Manipal College of Medical Sciencesand Teaching Hospital, Pokhara, NepalBackgroundReference intervals (RIs) refer to the quantitative dataof clinical chemistry parameters accompanied by upperand lower limits [1]. They serve as the basis for laboratory testing and assist physicians in distinguishingbetween healthy and diseased patients. They are also The Author(s) 2021. Open Access This article is licensed under a Creative Commons Attribution 4.0 International License, whichpermits use, sharing, adaptation, distribution and reproduction in any medium or format, as long as you give appropriate credit to theoriginal author(s) and the source, provide a link to the Creative Commons licence, and indicate if changes were made. The images orother third party material in this article are included in the article’s Creative Commons licence, unless indicated otherwise in a credit lineto the material. If material is not included in the article’s Creative Commons licence and your intended use is not permitted by statutoryregulation or exceeds the permitted use, you will need to obtain permission directly from the copyright holder. To view a copy of thislicence, visit http:// creat iveco mmons. org/ licen ses/ by/4. 0/. The Creative Commons Public Domain Dedication waiver (http:// creat iveco mmons. org/ publi cdoma in/ zero/1. 0/) applies to the data made available in this article, unless otherwise stated in a credit line to the data.
Kathayat et al. BMC Nephrol(2021) 22:331used to interpret the results of laboratory measurements,the screening of clinical trials, and as a basis for safetymonitoring for trial participants [2]. Population-specificRIs for quantitative clinical chemistry parameters areestablished according to the published guidelines of theclinical and Laboratory Standards Institute (CLSI 2008)[3] and the International Federation for Clinical Chemistry and Committee on Reference Intervals and DecisionLimits (IFCC-CRIDL) [4]. CLSI and IFCC publish andupdates these guidelines regularly for manufacturers andlaboratories to accomplish their own RI studies. This isbecause measured values of clinical laboratory parameters are not only influenced by individual factors such asage, sex, and lifestyle, but also by the method of estimation, race, and ecological factors like climate and altitude.Besides, they also vary not only between individuals butalso between populations [1, 5]. Globally, the RIs in useis usually referred from the textbooks or research articlesor values provided in the reagent kit insert. Thus, it is notsuitable to use the RIs that do not symbolize the localpopulation and the method being used. So, for the interpretation of individual patient laboratory test results, thetesting method and population based RIs are the mostwidely used tools [2]In Nepal, the majority of the diagnostic laboratoriesprovide liquid chemistry based testing services. The RIsfor such testing are widely adopted from the scientific literature, clinical chemistry textbooks, and commerciallyprovided kit inserts. Since 2018 there has been a gradualintroduction of dry chemistry based testing platforms aswell in selected laboratories and hospitals of Nepal. However, the RIs for such dry chemistry based testing platforms are rarely available in clinical chemistry textbooksand published scientific literature as compared to theliquid-based chemistry parameters. The only source ofthese values is kit inserts provided by the reagent manufacturers which are not specific to the local populationbeing served. Hence, in order to address this gap, there isan urgent need for establishing RIs that are both methodand population specific. To the best of our knowledge,there has been the establishment of liquid chemistrybased RIs only for lipid profile parameters for the Nepalese population [6]. There has been not a single scientificreport on dry chemistry based RIs for the whole population of Nepal. Therefore, the present study attempts to fillup this twofold research gap by establishing dry chemistry based RIs for selected renal function test parametersamong adult populations of Kaski district, Nepal.MethodsStudy designA laboratory-based cross-sectional study was conductedat the Department of Clinical Biochemistry of ManipalPage 2 of 9Teaching Hospital, Kaski, Nepal for a period of 6 monthsfrom June 2020 to November 2020 following the guidelines provided by CLSI and IFCC-CRIDL [3, 4].Study population and selection criteriaA total of 360 healthy adult participants of Kaski district,Nepal aged between 18 and 65 years were selected andenrolled using the priori convenient sampling technique.These adult participants were either the patient’s attendees or students and staffs of Manipal Teaching Hospital,Pokhara, Nepal. Study participants with one or more ofthe following conditions were excluded from the study: hypertension, kidney failure, cardiac diseases,chronic respiratory diseases, liver diseases, malabsorption syndromes, diabetes mellitus, malignancies,and hematological disorders including anemias history of being a hospital in-patient or otherwiseseriously ill during the previous 4 weeks known carrier state for hepatitis virus B (HBV), hepatitis virus C (HCV), or Human immunodeficiencyvirus (HIV) undergoing or has recently undergone a replacementor supplementation therapy e.g., thyroxine, insulin having psychological and mental disorders female participants who are pregnant, breastfeeding,or within 1 year of childbirth BMI 30 kg/m2Anthropometric, physiological, and lifestyle‑relatedvariablesAll the study participants were interviewed within thehospital premises using a pre-validated set of questionnaires and information regarding age, sex, disease ifany, family history, race, dietary habits, physical activity,smoking, or alcohol intake habits were recorded. Participants who reported drinking ethyl alcohol on a regular or occasional basis were labeled as alcoholics whilethose who never had alcohol in their life or quit it for thelast 1 year were labeled as non-alcoholics. Body height,weight, waist circumference (WC), hip circumference(HC), waist-hip ratio (WHR), and body mass index (BMI)of the participants were measured following the standard protocols [7]. According to the WHO guidelines forthe South Asian population BMI of 18.5 was classifiedas underweight; 18.5–22.9 as normal weight; 23–24.9as overweight; 25–29.9 as Obese I and 30 as Obese II[8]. Blood pressure was measured using a digital sphygmomanometer (Accumed automatic upper arm bloodpressure monitor, Swiss design) in triplicate while in thesitting position after about five minutes of rest.
Kathayat et al. BMC Nephrol(2021) 22:331Page 3 of 9Sample collection, processing, and storageStatistical analysisAbout 5 ml of venous blood samples were collected fromeach participant in gel tubes with clot activators between6 to 9 a.m. after they underwent a minimum of 8–10 hfasting. The collected blood samples were allowed toclot for about 20–30 min at room temperature and thencentrifuged at 4000 rpm for 10 min. Samples that werelipemic, hemolytic, or icteric were rejected and notincluded in the study. The serum samples so obtainedwere analyzed immediately whenever possible or storedat -20o C until analyzed in case of delay.All data management and statistical analyses were performed using MS Excel, Statistical Package for the SocialSciences (SPSS) version 20 (SPSS, IBM, Chicago, IL), andGraphPad Prism version 9. The data were categorizedbased on the sex and age groups of the study participants.The outliers present in the data were recognized with thehelp of Box plots, a procedure recommended by Hornand Pesce [9]. They were manually deleted which led todifferent sample sizes for each parameter.The normal distribution of the study data was testedby D’Agostino-Pearson Omnibus, Kolmogorov–Smirnov,and Shapiro–Wilk tests. Our data were found to followthe non-Gaussian probability curve. Therefore, nonparametric statistical methods were used to establish the RIsas per the CLSI C28-A3 guideline [3]. RIs were calculatedas the 2.5 percentile confidence interval (P 2.5) and 97.5percentile confidence interval (P 97.5) separately for bothmales and females. The Mann-Whitney test was used tocompare the RIs between males and females while OneWay-ANOVA and Dunnett’s multiple comparisons testswere used for the comparison of age group-specific RIsfor each sex. All p values (two-tailed) 0.05 were considered statistically significant.Biochemical analysisThe concentrations of serum urea, creatinine, sodium,and potassium were measured using a fully automateddry chemistry based analyzer (VITROS 350 chemistrysystem, Ortho clinical diagnostics, UK) according to thestandardized protocols provided by the manufacturers.Briefly, serum urea was measured by the urease method,creatinine was measured by a two-point rate enzymaticmethod which involves the use of creatinine amidohydrolase, sarcosine oxidase, and peroxidase and leuco dye.This method was validated and the values were traceableto a Gas Chromatography Isotope Dilution Mass Spectrometry (GC/IDMS) method and National Institute ofStandards and Technology (NIST) SRM 914 creatininestandard reference material. Sodium and potassium weremeasured using the ion-selective electrode (ISE) methodbased on the principles of direct potentiometry. Allspecimens from each individual were assayed in a singlebatch, using the same lots of reagents to minimize theanalytical variation.Quality control and quality assuranceAnalysis of samples was done after proper standardization of the instruments with the help of calibrators andinternal controls. We ran two levels of quality control(QC) sera for each analyte under the study and calculated both inter-and intra-assay coefficients of variation(CV%). Inter-assay CV% (reproducibility) for serum urea,creatinine, sodium, and potassium were 2.12, 2.62, 1.08,and 2.75, respectively. Similarly, intra-assay CV% (repeatability) for urea, creatinine, sodium, and potassium were0.96, 1.10, 1.08, and 0.39, respectively. All of these CV%were within the acceptable ranges. Internal QC was performed every day and observed values were within 2SDfrom their target values. Our laboratory also takes partin the monthly External Quality Assessments Scheme(EQAS) run by the Christian Medical College (CMC)Vellore, India to guarantee the accuracy and reliability ofour laboratory test values.ResultsThe serum levels of urea, creatinine, sodium, and potassium displayed non-Gaussian distribution. Table 1shows the sociodemographic and anthropometric variables of study participants according to their sex. Of the360 healthy participants studied, 180 (50%) were malesand 180 (50%) were females. The adult age ranged from18 to 65 years and the mean age of the participants was40.38 14.55 years. The age group intervals of the participants were categorized as 18–29 years; 30–39 years;40–49 years and 50–65 years. There were 99 (27.5%)participants within age group 18–29 years, 73 (20.3%) in30–39 years, 76 (21.1%) in 40–49 years and 112 (31.1%)in 50–65 years. All the participants were normotensive with the mean systolic blood pressure (SBP) of116.61 10.36 mmHg and diastolic blood pressure (DBP)of 77.11 8.51 mmHg. The mean height of the participants was 158.88 9.17 cm. Overall, the mean BMI ofthe participants was 23.82 2.28 kg/m2. Based on WHOguidelines for South Asian population, there were 113(31.4%) participants classified as normal weight BMI, 112(31.1%) as overweight, and 135 (37.5%) as obese I. Themean WC of the participants was 89.69 11.40 cm andWHR was 0.96 0.12. Based on their racial background,245 (68.1%) were Aryans, 61 (16.9%) were Mongolians, 35(9.7%) were Dalits and 19 (5.3%) were Newars. Among allthe participants, 314 (87.2%) were non-vegetarians and
Kathayat et al. BMC Nephrol(2021) 22:331Page 4 of 9Table 1 Sociodemographic and anthropometric variables of study participantsCharacteristic VariablesMaleFemalep-valueTotal40.38 14.55N (%)180 (50)180 (50)Age (years)40.86 14.6839.90 14.430.534c18–2947 (26.1)52 (28.9)0.708c30–3939 (21.7)34 (18.9)Age groups (years)360 (100)99 (27.5)73 (20.3)40–4935 (19.4)41 (22.8)76 (21.1)50–6559 (32.8)53 (29.4)112 (31.1)117.53 10.10115.69 10.57Blood pressure (mmHg)Systolic0.091c77.46 8.5376.76 8.510.436c23.92 2.6723.71 2.290.374cNormal weight54 (30)59 (32.8)0.446cOver weight55 (30.6)57 (31.7)DiastolicHeight (cm)BMI (kg/m2)BMI (kg/m2)Obese I163.27 8.48154.49 7.60 0.001a71 (39.4)64 (35.6)86.82 11.78 0.001a0.90 0.09 0.001aAryan125 (69.4)120 (66.7)0.749cMongolian27 (15)34 (18.9)W/H ratioRace1.02 0.1277.11 8.51158.88 9.1723.82 2.28113 (31.4)112 (31.1)92.56 10.26Waist (cm)116.61 10.36135 (37.5)89.69 11.400.96 0.12245 (68.1)61 (16.9)Dalit19 (10.6)16 (8.9)35 (9.7)Newar9 (5.0)10 (5.6)19 (5.3)Vegetarian15 (8.3)31 (17.2)Non-vegetarian165 (91.7)149 (82.8)No60 (33.3)152 (84.4)Yes120 (66.7)28 (15.6)No155 (86.1)179 (99.4)Yes25 (13.9)1 (0.6)8.9 2.47.9 2.4Diet0.012b46 (12.8)314 (87.2)Alcohol Intake 0.001a212 (58.9)148 (41.1)SmokingSerum urea (mmol/L)Serum creatinine (μmol/L)Height-creatinine ratioSerum sodium (mmol/L)Serum potassium (mmol/L)76.7 15.456.4 12.1 0.001a 0.001a 0.001a196.2 43.2252.3 51.2 0.001a4.4 0.44.3 0.40.114c141.1 2.9141.2 2.8334 (92.8)26 (7.2)0.827c8.4 2.566.5 17.1224.2 55.0141.2 2.84.3 0.4The results are presented as mean SD for continuous variables and n (%) for categorical variables ap 0.001, bp 0.05, cp 0.05 (two tailed); groups were comparedusing Students t test for quantitative variables and Chi square test for categorical variables. For the conversion of SI unit to conventional unit divide the concentrationof urea value by 0.357, creatinine value by 88.4 and sodium and potassium value by 146 (12.8%) were vegetarians. The majority of the participants were non-smokers (334, 92.8%) and non-alcoholics(212, 58.9%). Likewise, the mean values of serum urea,creatinine, height creatinine ratio, sodium and potassium were 8.4 2.5, 66.5 17.1, 224.2 55.0, 141.2 2.8,and 4.3 0.4 respectively. There were no significant sexdifferences (p 0.05) in age, age groups, SBP, DBP, BMI,race, serum sodium and potassium. However, significantsex differences were observed in terms of height, WC,WHR, diet, alcohol intake, smoking, serum urea, creatinine and height creatinine ratio (p 0.05).Table 2 shows the total and sex-specific RIs forrenal function test parameters under study. The RI forurea: 4.20–13.70 mmol/L (males: 4.70–13.99 mmol/L;females:4.20–13.23 mmol/L;p-value 0.001);creatinine:44.20–106.10 μmol/L(males:
Kathayat et al. BMC Nephrol(2021) 22:331Page 5 of 9Table 2 The established reference intervals for renal function test parameters for male and female /dLSodiumPercentilesReference ValuesInterval TotalDifference betweenMale and Femalez-valuep-value 3.966 0.001 11.983 0.001 0.2140.831 2.1450.032The results are presented as both medians and the percentiles. The RIs are presented as the values between 2.5 and 97.5 of the percentile. The number of participantsis indicated under the column labeled N. The RIs with p-values (two tailed) 0.05 are the ones that differ significantly between male and female48.82–106.10 μmol/L; females: 35.40–83.78 μmol/L;p-value 0.001); sodium 135–146 mmol/L (males:135–146; females: 135–146; p-value 0.831) and potassium 3.60–5.10 mmol/L (males: 3.54–5.0; females:3.60–5.10; p-value 0.032). Urea, creatinine, andpotassium RIs showed significant sex differences(p 0.05) while the RI for sodium showed no significantsex difference (p 0.05).Table 3 compares the RIs based on the age groups ofthe study participants. Since all age groups did not havea minimum sample size of 120 as required by CLSI andIFCC-CRIDL guidelines, the comparison of age-specificRIs was carried out by using One-Way-ANOVA andDunnett’s Multiple Comparisons Test. The mean RIs ofall four test parameters were significantly different ineach age group (p 0.05). The mean RI was significantlydifferent between age group 18–29 years and age group30–39 years for sodium; age group 18–29 years and agegroup 40–49 years for sodium and potassium and agegroup 18–29 years and age group 50–65 years for urea,creatinine, and potassium.A comparison of our estimated RIs for urea, creatinine, sodium, and potassium with the ones provided bythe manufacturer and currently being used at our laboratory is shown in Table 4.DiscussionThere has been a complete lack of dry chemistry basedRIs of biochemical test parameters for the entire agegroups of the Nepalese population. The present studyaimed to establish the RIs of serum urea, creatinine,sodium, and potassium for the adult population of theKaski district, Nepal. Due to the lack of locally established RIs, Nepalese clinical laboratories tend to adoptRIs established for foreign populations directly from thereagent kit inserts or some clinical chemistry textbookswithout further validation. The reason for going intosuch practices is possibly due to the cost factors, lack ofawareness, and no mandatory instructions from the localregulatory bodies. The role of clinical laboratories is notonly to generate numerical test results but also to guideclinicians to make the better screening, diagnosis, prognosis, and treatment of the diseases, and to conduct successfully any planned clinical trials. However, these rolesare genuinely fulfilled only when the test results are interpreted with reference to RIs specific to the populationbeing served or studied. In their absence, there is alwaysa chance of wrong interpretation of the test results,which may lead to the wrong diagnosis and managementof the target diseases. Besides, the wrong diagnosis andtreatment may affect the local population in terms of
Kathayat et al. BMC Nephrol(2021) 22:331Page 6 of 9Table 3 Comparison of reference intervals for male and female in the different age group for renal function test alemmol/L/FemalemEq/LTotal47519818–29 yearsN8.52 2.30*396.81 2.01347.62 2.307372.03 16.10*3952.86 12.803461.96 17.3073139.85 3.103923.88 6.43*19.08 5.6321.36 6.460.82 0.18*0.60 0.140.70 0.20140.52 3.10140.20 3.104.26 0.364.22 0.384.24 0.37347339347330–39 yearsN8.42 2.28357.51 2.09418.11 2.227677.29 13.86*3555.62 9.864167.20 16.2676141.79 2.49a3423.60 6.3721.03 5.8222.40 6.220.87 0.16*0.63 0.110.76 0.18141.85 2.16414.35 0.3234141.82 2.33a4.31 0.264.33 0.2975397340–49 yearsN8.60 2.175724.09 6.077.90 2.10b22.15 5.8951b8.22 2.1510878.04 14.30*5956.70 10.645366.53 16.37112142.15 2.46b58142.03 2.36b11123.01 6.010.88 0.16*0.64 0.120.75 0.19141.93 2.30b534.41 0.32564.35 0.294.38 0.30b5310950–65 yearsp-value9.54 2.630.2409.08 2.74c 0.0019.32 2.68c 0.00179.11 15.95*c0.04860.21 12.99c0.06070.16 17.37c0.006141.14 2.850.00125.96 6.7224.80 6.60c25.41 6.66c0.91 0.18*c0.67 0.13c0.79 0.20c140.89 2.890.0334.41 0.390.138141.02 2.864.32 0.424.36 0.41c 0.0010.3210.033RIs are expressed as mean standard deviation while the number of participants is shown in column labeled N. *indicates the differences of RIs between males andfemales of the same age group are statistically significant (p 0.05 by student’s t test)arepresents the significant difference of each analyte between age group 18–29 and 30–39 years for same-sex where p 0.05 by One-Way ANOVA and Dunnett’sMultiple Comparison Testbrepresents the significant difference of each analyte between age group 18–29 and 40–49 years for same-sex where p 0.05 by One-Way ANOVA and Dunnett’sMultiple Comparison Testcrepresents the significant difference of each analyte between age group 18–29 and 50–65 years for same-sex where p 0.05 by One-Way ANOVA and Dunnett’sMultiple Comparison TestTable 4 Comparison of reference interval of this study with adopted reference intervalAnalytesSexUnitReference interval established inthe present studyAdopted reference interval provided for thedry chemistry based platforms (OCD 5.10Total
Kathayat et al. BMC Nephrol(2021) 22:331their financial resources, health status, and time. This isthe reason why international regulatory bodies such asCLSI and IFCC recommend that each clinical laboratoryshould establish its RIs [3, 4]. In addition to the generalized RIs, the establishment of RIs with respect to sex,age group, pathophysiological status, and race of the general population provides extra resolution for better testresults interpretation and clinical decision making. Wethus also aimed to establish the sex-based RIs for the testparameters under study. Though we have reported theage group-specific RIs, their validity remains questionable as the sample size for each age group was less thanthat recommended by the CLSI and IFCC guidelines.Dry chemistry based platform was introduced in thediagnostic market very recently hence there are very fewliteratures available on the establishment of RIs based onthese new platforms. Thus, we compare our study findings with the previously established RIs that were mostlybased on liquid chemistry based platforms.The RIs for serum urea and creatinine were significantly higher in males (4.70–13.99 mmol/L and48.82–106.10 mmol/L) as compared to females (4.20–13.23 mmol/L, and 35.40–83.78 mmol/L). This sex-baseddifference may be associated with the previously reportedfactors such as higher muscle masses and height in malescompared to females, including others such as differencesin nutrition, and physiological status. Similar findingshave been reported in populations of North India, China,Tanzania, Uganda, Kericho; Kenya, and North-Rift Valley; Kenya [2, 10–14]. On the contrary, there was no significant sex difference for urea and creatinine in a studyconducted in the Nigerian population [15]. There wasno significant difference in RI for sodium between malesand females. This finding contradicts the findings of astudy conducted in China, North-Rift Valley; Kenya, andRwanda where a significant difference in RI for sodiumwas observed between males and females [10, 14, 16].There was a significant sex difference for potassium witha high RI of potassium present among the female participants (Table 2). This could be explained by the fact thatfemales have higher platelet counts than males [17] thatleads to additional serum potassium that results fromplatelet rupture during coagulation [18, 19]. On the otherhand, males have significantly higher RI for potassiumthan females in a population of North-Rift Valley, Kenya[14].We also attempted to analyze age group and sex-specific RIs in our study samples. Overall, we found thatRIs for all four test parameters were significantly different for each age group. The observed differences in RIssuggest that the serum concentration of these parameters is age-dependent (Table 3). The age-specific differences in the serum values of urea and creatinine could bePage 7 of 9explained by the fact that with the advancing age thereis an increase in muscle degradation and a decrease inglomerular filtration rate in both sexes. Comparablefindings have been observed in the population of NorthIndia, and North-Rift Valley; Kenya [2, 14]. The sex-wiseanalysis further revealed that only the RIs of serum ureafor females, creatinine for males, and sodium for bothmales and females differed significantly among differentage groups. There was an increase in the mean values ofurea with the increase in age among female participants.A similar study done in the Rwandan population foundthat serum urea levels in females showed a slight declinewith age [16]. Similarly, there was an increase in themean values of creatinine with the increase in age amongmale participants. Conversely, there was an increasein serum creatinine with an increase in age for femalesin a study done in North-Rift Valley; Kenya [14]. Theseinconsistencies may be due to demographic, geographic,and racial differences. Besides, the hidden pathologies,the variability of analytical methods, types, and analyticalperformance of the equipment and the quality of the reagents being used might have influenced the value of theseparameters in these studies.The combined effect of genetic and environmentalfactors, variable nature of physical activities, and agerelated decline in renal function could be attributed tothe observed differences in the mean values of serumsodium and potassium with the increase in age. Besides,serum potassium intake depends on habits, race, diet,and so on. Survey data from the Third National Healthand Nutrition Examination Survey (NHANES III, UnitedStates) demonstrated that irrespective of the sex of thestudy subjects, the mean potassium consumption of theAmerican people increased with age upto the age groupof 31–50 years. Thereafter, following the age of 50 years,the daily K intake slowly and noticeably decreases[20]. However, no clinically significant differences wereobserved in different age-specific RIs for potassium inthe study done in China [21].The dry chemistry based RIs that are provided inthe kit inserts and currently being used at our laboratory reporting were found to be different than what weestablished for our local population of the Kaski districtof Nepal. Not only these but our RIs were also found todiffer to some extent with the RIs determined elsewhereby the same methodology and analytical platforms [2, 5,10, 14]. These observed differences could be explainedin the light of sample size, genetic, race, demographic,geographical location, diet, lifestyle, cultural and seasonal differences among the studied populations [1, 2, 5,22]. This is the reason why several studies [5, 10, 23] andinternational guidelines [3, 4] recommend every diagnostic laboratory establish their RIs specific to the local
Kathayat et al. BMC Nephrol(2021) 22:331population being served and not blindly follow the RIsfor unrelated popu
erature, clinical chemistry textbooks, and commercially provided kit inserts. Since 2018 there has been a gradual introduction of dry chemistry based testing platforms as well in selected laboratories and hospitals of Nepal. How - ever, the RIs for such dry chemistry based testing plat-forms are rarely a


