Transcription
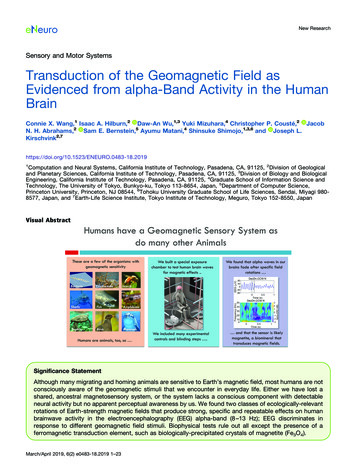
New ResearchSensory and Motor SystemsTransduction of the Geomagnetic Field asEvidenced from alpha-Band Activity in the HumanBrainConnie X. Wang,1 Isaac A. Hilburn,2 Daw-An Wu,1,3 Yuki Mizuhara,4 Christopher P. Cousté,2 JacobN. H. Abrahams,2 Sam E. Bernstein,5 Ayumu Matani,4 Shinsuke Shimojo,1,3,6 and Joseph -18.20191Computation and Neural Systems, California Institute of Technology, Pasadena, CA, 91125, 2Division of Geologicaland Planetary Sciences, California Institute of Technology, Pasadena, CA, 91125, 3Division of Biology and BiologicalEngineering, California Institute of Technology, Pasadena, CA, 91125, 4Graduate School of Information Science andTechnology, The University of Tokyo, Bunkyo-ku, Tokyo 113-8654, Japan, 5Department of Computer Science,Princeton University, Princeton, NJ 08544, 6Tohoku University Graduate School of Life Sciences, Sendai, Miyagi 9808577, Japan, and 7Earth-Life Science Institute, Tokyo Institute of Technology, Meguro, Tokyo 152-8550, JapanVisual AbstractSignificance StatementAlthough many migrating and homing animals are sensitive to Earth’s magnetic field, most humans are notconsciously aware of the geomagnetic stimuli that we encounter in everyday life. Either we have lost ashared, ancestral magnetosensory system, or the system lacks a conscious component with detectableneural activity but no apparent perceptual awareness by us. We found two classes of ecologically-relevantrotations of Earth-strength magnetic fields that produce strong, specific and repeatable effects on humanbrainwave activity in the electroencephalography (EEG) alpha-band (8 –13 Hz); EEG discriminates inresponse to different geomagnetic field stimuli. Biophysical tests rule out all except the presence of aferromagnetic transduction element, such as biologically-precipitated crystals of magnetite (Fe3O4).March/April 2019, 6(2) e0483-18.2019 1–23
New Research2 of 23Magnetoreception, the perception of the geomagnetic field, is a sensory modality well-established across allmajor groups of vertebrates and some invertebrates, but its presence in humans has been tested rarely, yieldinginconclusive results. We report here a strong, specific human brain response to ecologically-relevant rotations ofEarth-strength magnetic fields. Following geomagnetic stimulation, a drop in amplitude of electroencephalography (EEG) alpha-oscillations (8 –13 Hz) occurred in a repeatable manner. Termed alpha-event-related desynchronization (alpha-ERD), such a response has been associated previously with sensory and cognitive processing ofexternal stimuli including vision, auditory and somatosensory cues. Alpha-ERD in response to the geomagneticfield was triggered only by horizontal rotations when the static vertical magnetic field was directed downwards,as it is in the Northern Hemisphere; no brain responses were elicited by the same horizontal rotations when thestatic vertical component was directed upwards. This implicates a biological response tuned to the ecology of thelocal human population, rather than a generic physical effect. Biophysical tests showed that the neural responsewas sensitive to static components of the magnetic field. This rules out all forms of electrical induction (includingartifacts from the electrodes) which are determined solely on dynamic components of the field. The neuralresponse was also sensitive to the polarity of the magnetic field. This rules out free-radical “quantum compass”mechanisms like the cryptochrome hypothesis, which can detect only axial alignment. Ferromagnetism remainsa viable biophysical mechanism for sensory transduction and provides a basis to start the behavioral explorationof human magnetoreception.Key words: alpha-ERD; biogenic magnetite; biophysics; EEG; magnetoreception; quantum compassIntroductionMagnetoreception is a well-known sensory modality inbacteria (Frankel and Blakemore, 1980), protozoans (Bazylinski et al., 2000) and a variety of animals (Wiltschkoand Wiltschko, 1995a; Walker et al., 2002; Johnsen andReceived December 6, 2018; accepted February 26, 2019; First publishedMarch 18, 2019.The authors declare no competing financial interests.Author contributions: J.L.K. initiated, and with S.S. and A.M., planned anddirected the research. C.X.W., I.A.H., D.-A.W., Y.M., C.P.C., J.N.H.A., S.E.B.,A.M., S.S., and J.L.K. designed research; C.X.W., I.A.H., D.-A.W., Y.M., C.P.C.,J.N.H.A., A.M., S.S., and J.L.K. performed research; C.X.W., I.A.H., D.-A.W.,A.M., S.S., and J.L.K. analyzed data; C.X.W., I.A.H., D.-A.W., Y.M., C.P.C.,J.N.H.A., S.E.B., A.M., S.S., and J.L.K. wrote the paper.This work was supported by the Human Frontiers Science Program GrantHFSP-RGP0054/2014 (to S.S., J.L.K. and A.M.), and more recent analysis ofdata was supported by the Defense Advanced Research Projects Agency(DARPA) RadioBio Program Grant D17AC00019 (to J.L.K. and S.S.) and theJapan Society for the Promotion of Science (JSPS) KAKENHI Grant 18H03500(to A.M.). Previous support to J.L.K. from the Fetzer institute allowed construction of an earlier version of the 2-m Merritt coil system. C.X.W. and S.S. havebeen partly supported by the Japan Science and Technology Agency, CoreResearch for Evolutional Science and Technology (JST.CREST).All digital data are available at https://doi.org/10.22002/d1.930 and https://doi.org/10.22002/d1.931, including MATLAB scripts used for the automaticdata analysis.Acknowledgements: We thank Dragos Harabor, James Martin, KristjánJónsson, Mara Green, and Sarah Crucilla for work on earlier versions of thisproject and other members of the Kirschvink, Shimojo, and Matani labs fordiscussions and suggestions. We also thank James Randi, co-founder of theCommittee for the Scientific Investigation of Claims of the Paranormal (CSICOP), for advice on minimizing potential artifacts in the experimental design.Dr. Heinrich Mouritsen of the University of Oldenberg gave valuable advice forconstruction of the Faraday cage and input on an earlier draft of this manuscript. S.S. is also affiliated with Kyoto University KOKORO Center and Tamagawa University Brain Science Institute.Correspondence should be addressed to Shin Shimojo at hmre.contact@caltech.edu or Joseph L. Kirschvink at EURO.0483-18.2019Copyright 2019 Wang et al.This is an open-access article distributed under the terms of the CreativeCommons Attribution 4.0 International license, which permits unrestricted use,distribution and reproduction in any medium provided that the original work isproperly attributed.March/April 2019, 6(2) e0483-18.2019Lohmann, 2008), but whether humans have this ancientsensory system has never been conclusively established.Behavioral results suggesting that geomagnetic fields influence human orientation during displacement experiments (Baker, 1980, 1982, 1987) were not replicated(Gould and Able, 1981; Able and Gergits, 1985; Westbyand Partridge, 1986). Attempts to detect human brainresponses using electroencephalography (EEG) were limited by the computational methods that were used (Sastreet al., 2002). Twenty to 30 years after these previousflurries of research, the question of human magnetoreception remains unanswered.In the meantime, there have been major advances in ourunderstanding of animal geomagnetic sensory systems.An ever-expanding list of experiments on magneticallysensitive organisms has revealed physiologically-relevantstimuli as well as environmental factors that may interferewith magnetosensory processing (Wiltschko and Wiltschko,1995a; Lohmann et al., 2001; Walker et al., 2002). Animalfindings provide a potential feature space for exploringhuman magnetoreception, the physical parameters and coordinate frames to be manipulated in human testing(Wiltschko, 1972; Kirschvink et al., 1997). In animals, geomagnetic navigation is thought to involve both a compassand map response (Kramer, 1953). The compass responsesimply uses the geomagnetic field as an indicator to orientthe animal relative to the local magnetic north/south direction (Wiltschko and Wiltschko, 1995a; Lohmann et al., 2001).The magnetic map is a more complex response involvingvarious components of field intensity and direction; directionis further subdivided into inclination (vertical angle fromthe horizontal plane; the North-seeking vector of the geomagnetic field dips downwards in the Northern Hemisphere) and declination (clockwise angle of the horizontalcomponent from Geographic North, as in a man-madecompass). Notably, magnetosensory responses tend toshut down altogether in the presence of anomalies (e.g.,sunspot activity or local geomagnetic irregularities) thatcause the local magnetic field to deviate significantly fromeNeuro.org
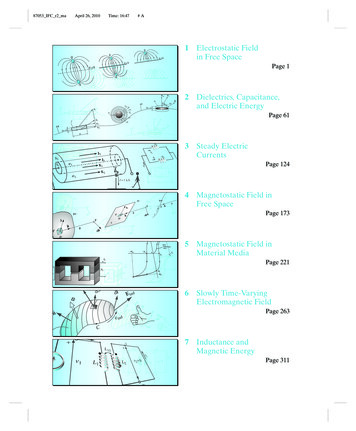
New Research3 of 23Figure 1. Schematic illustration of the experimental setup. The 1-mm-thick aluminum panels of the electrically-grounded Faradayshielding provides an electromagnetically “quiet” environment. Three orthogonal sets of square coils 2 m on edge, following thedesign of Merritt et al. (1983), allow the ambient geomagnetic field to be altered around the participant’s head with high spatialuniformity; double-wrapping provides an active-sham for blinding of experimental conditions (Kirschvink, 1992b). Acoustic panels onthe wall help reduce external noise from the building air ventilation system as well as internal noise due to echoing. A non-magneticchair is supported on an elevated wooden base isolated from direct contact with the magnetic coils. The battery-powered EEG islocated on a stool behind the participant and communicates with the recording computer via an optical fiber cable to a control room 20 m away. Additional details are available in Figure 2. This diagram and the center figure for the visual abstract was modified fromthe figure “Center of attraction,” by C. Bickel (Hand, 2016), with permission.typical ambient values (Wiltschko, 1972; Martin andLindauer, 1977), an adaptation that is thought to guardagainst navigational errors. These results indicate thatgeomagnetic cues are subject to complex neural processing, as in most other sensory systems.Physiologic studies have flagged the ophthalmicbranch of the trigeminal system (and equivalents) in fish(Walker et al., 1997), birds (Semm and Beason, 1990;Beason and Semm, 1996; Mora et al., 2004; Elberset al., 2017), and rodents (Wegner et al., 2006) as aconduit of magnetic sensory information to the brain. Inhumans, the trigeminal system includes many autonomic, visceral, and proprioceptive functions that lieoutside conscious awareness (Saper, 2002; Fillmoreand Seifert, 2015). For example, the ophthalmic branchcontains parasympathetic nerve fibers and carries signals of extraocular proprioception, which do not reachconscious awareness (Liu, 2005).If the physiologic components of a magnetosensorysystem have been passed from animals to humans,then their function may be either subconscious or onlyweakly available to conscious perception. Behavioralexperiments could be easily confounded by cognitivefactors such as attention, memory and volition, makingthe results weak or difficult to replicate at the group orindividual levels. Since brain activity underlies all behavior, we chose a more direct electrophysiologicalapproach to test for the transduction of geomagneticfields in humans.March/April 2019, 6(2) e0483-18.2019Materials and MethodsPart 1: summary and design logicExperimental equipment setupWe constructed an isolated, radio frequency-shieldedchamber wrapped with three nested sets of orthogonalsquare coils, using the four-coil design of Merritt et al.(1983) for high central field uniformity (Fig. 1; further details in Fig. 2 and Materials and Methods, Part 2: detailsfor replication and validation). Each coil contained twomatched sets of windings to allow operation in active orsham mode. In active mode, currents in paired windingswere parallel, leading to summation of generated magnetic fields. In sham mode, currents ran antiparallel, yielding no measurable external field, but with similar ohmicheating and magnetomechanical effects as in activemode (Kirschvink, 1992b). Active and sham modes weretoggled by manual switches in the distant control room,leaving computer and amplifier settings unchanged. Coilswere housed within an acoustically-attenuated, groundedFaraday cage with aluminum panels forming the walls,floor and ceiling. Participants sat upright in a woodenchair on a platform electrically isolated from the coil system with their heads positioned near the center of theuniform field region. The magnetic field inside the experimental chamber was monitored by a three-axis AppliedPhysics Systems 520A fluxgate magnetometer. EEGwas continuously recorded from 64 electrodes using aBioSemi ActiveTwo system with electrode positionscoded in the International 10-20 System (e.g., Fz, CPz,eNeuro.org
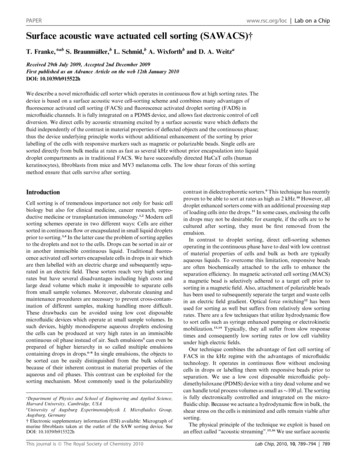
New ResearchADCBEHFI4 of 23GJFigure 2. Additional images of critical aspects of the human magnetic exposure at Caltech. A, Partially complete assembly of theFaraday cage (summer of 2014) showing the nested set of orthogonal, Merritt square four-coils (Merritt et al., 1983) with all but twoaluminum walls of the Faraday cage complete. B, Image of a participant in the facility seated in a comfortable, non-magnetic woodenchair and wearing the 64-lead BioSim EEG head cap. The EEG sensor leads are carefully braided together to minimize electricalartifacts. The chair is on a raised wooden platform that is isolated mechanically from the magnet coils and covered with a layer ofsynthetic carpeting; the height is such that the participant’s head is in the central area of highest magnetic field uniformity. C,Schematic of the double-wrapped control circuits that allow active-sham experiments (Kirschvink, 1992b). In each axis of the coils,the four square frames are wrapped in series with two discrete strands of insulated copper magnet wire and with the number of turnsand coil spacing chosen to produce a high-volume, uniform applied magnetic field (Merritt et al., 1983). Reversing the current flowin one of the wire strands via a DPDT switch results in cancellation of the external field with virtually all other parameters being thesame. This scheme is implemented on all three independently controlled coil axes (Up/Down, East/West, and North/South). D,Fluxgate magnetometer (Applied Physics Systems 520A) three-axis magnetic field sensor attached to a collapsing carbon-fibercamera stand mount. At the start of each session, the fluxgate is lowered to the center of the chamber for an initial current/controlcalibration of the ambient geomagnetic field. It is then raised to a position 30 cm above the participant’s head during the followingexperimental trials, and the three-axis magnetic field readings are recorded continuously in the same fashion as the EEG voltagesignals. E, Air duct. A 15 cm in diameter aluminum air duct 2-m-long connects a variable-speed (100 W) electric fan to the upperSE corner of the experimental chamber; this is also the conduit used for the major electrical cables (power for the magnetic coils,sensor leads for the fluxgate, etc.). F, G, An intercom/video monitoring system was devised by mounting a computer-controlledloudspeaker (F) outside the Faraday shield on the ceiling North of the chamber coupled with (G) a USB-linked IR video camera/microphone system mounted just inside the shield. Note the conductive aluminum tape shielding around the camera to reduce Rfinterference. During all experimental trials a small DPDT relay located in the control room disconnects the speaker from computer anddirectly shorts the speaker connections. A second microphone in the control room can be switched on to communicate with theparticipant in the experimental chamber, as needed. An experimenter monitors the audio and video of participants at all times, as perCaltech IRB safety requirements. H, LED lights, 12 VDC array, arranged to illuminate from the top surface of the magnetic coils nearthe ceiling of the chamber. These are powered by rechargeable 11.1-V lithium battery packs (visible in E) and controlled by an externalswitch. I, Ferrite chokes. Whenever possible, these are mounted in a multiple-turn figure-eight fashion (Counselman, 2013) on allconductive wires and cables entering the shielded area and supplemented with grounded aluminum wool when needed. J, Image ofthe remote-control area including (from left to right): the PC for controlling the coils, the DPDT switches for changing between activeand sham modes, the fluxgate control unit, the three power amplifiers that control the current in the remote coil room, and theMarch/April 2019, 6(2) e0483-18.2019eNeuro.org
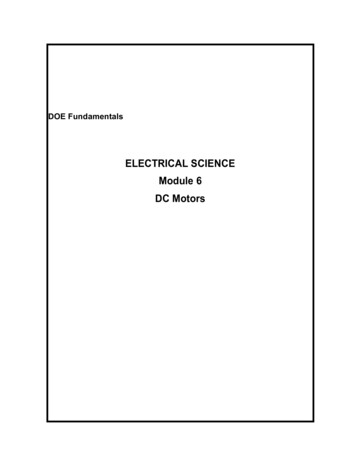
New Research5 of 23continuedseparate PC that records the EEG data. Participants seated in the experimental chamber do not report being able to hear sounds fromthe control room and vice versa. Additional guidance for the design of biomagnetic experiments is given by Kirschvink et al. (2010)and Schwarze et al. (2016).etc.). Inside the cage, the battery-powered digital conversion unit relayed data over a non-conductive, opticalfiber cable to a remote-control room, 20 m away,where all power supplies, computers and monitoringequipment were located.Experimental sequenceA 1-h EEG session consisted of multiple 7-min experimental runs. In each run of 100 trials, magnetic fielddirection rotated repeatedly between two preset orientations with field intensity held nearly constant at the ambient lab value ( 35 T). In SWEEP trials, the magnetic fieldstarted in one orientation then rotated smoothly over 100ms to the other orientation. As a control condition, FIXEDtrials with no magnetic field rotation were interspersedamong SWEEP trials according to pseudorandom sequences generated by software. Trials were separated intime by 2–3 s.Participant blindingDuring experiments, participants sat with their eyesclosed in total darkness. Participants were blind to activeversus sham modes, trial sequences, and trial onset timings. The experimental chamber was dark, quiet and isolated from the control room during runs. Auditory tonessignaled only the beginning and end of experiment runs,and experimenters only communicated with participantsonce or twice per session between active runs to updatethe participant on the number of runs remaining. Whentime allowed, sham runs were matched to active runsusing the same software settings. Active and sham runswere programmatically identical, differing only in the position of hardware switches that directed current to runparallel or antiparallel through paired loops. Sham runsserved as an additional control for non-magnetic sensoryconfounds, such as sub-aural stimuli or mechanical oscillations from the coil system.Magnetic rotation stimuliFigure 3 shows the magnetic field rotations used. Notethat experimental variables differing between runs aredenoted in camel case as in DecDn, DecUp, active, sham,etc., whereas variables that change within runs are designated in all capitals like FIXED, SWEEP, CCW, CW, UP,DN, etc. In inclination (Inc) experiments (Fig. 3A), declination direction was fixed to North (0 declination in ourcoordinate system), and participants sat facing North.Rotation of the field vector from downwards to upwardswas designated as an Inc.UP.N trial and the return sweepas Inc.DN.N, with UP/DN indicating the direction of fieldrotation. In declination (Dec) experiments (Fig. 3B,C), weheld inclination (and hence the vertical component of thefield vector) constant, while rotating the horizontal component clockwise or counterclockwise to vary the declination. For trials with downwards inclination (as in theNorthern Hemisphere), field rotations swept the horizontalMarch/April 2019, 6(2) e0483-18.2019component 90 CW or CCW between Northeast andNorthwest, designated as DecDn.CW.N or DecDn.CCW.N, respectively, with .N indicating a Northerly direction. To test biophysical hypotheses of magnetoreceptionas discussed below, we conducted additional declinationrotation experiments with static, upwards inclination. Asshown in Figure 3B, rotating an upwards-directed fieldvector between SE and SW (DecUp.CW.S and DecUp.CCW.S) antiparallel to the downwards-directed rotationsprovides tests of the quantum compass biophysicalmodel, while sweeping an upwards vector between NEand NW (DecUp.CW.N and DecUp.CCW.N) provides ageneral test for electrical induction (Fig. 3C).EEG artifactIn active runs, an electromagnetic induction artifactoccurred as a 10- to 40- V fluctuation in the EEG signalduring the 100-ms magnetic field rotation. The artifactwas isolated and measured in EEG phantom experiments(presented in Materials and Methods, Part 2: details forreplication and validation). Examples of single-trial, timedomain, bandpass-filtered (1–50 Hz) EEG traces at electrode Fz are shown in Figure 4. Figure 4A shows theartifact during the inclination rotation, measured from acantaloupe and a human. The artifact is detectable insingle trials from participants with low alpha-power (asshown), but difficult to see in participants with high alphapower. Figure 4B shows the induction artifact during thedeclination rotation, which has smaller B/ t and produces a smaller artifact. The artifact is visible in the cantaloupe trace, but typically invisible in single-trial humanEEG, especially in participants with high alpha-power (asshown). This induction artifact is similar to that observedin electrophysiological recordings from trout whenevermagnetic field direction or intensity was suddenlychanged in a square wave pattern (Walker et al., 1997).EEG artifacts induced by magnetic field shifts are inducedin the presence of time-varying magnetic fields and disappear within a few milliseconds after the magnetic fieldshift (when B/ t 0). This is true even in EEG studiesinvolving transcranial magnetic stimulation where peakfields exceeding 2T are reached within 85 s (resulting in8 orders of magnitude greater B/ t than in our experiment). Artifacts in such concurrent TMS/EEG setups havebeen found to disappear within 5.6 ms (Veniero et al.,2009). Furthermore, the induction artifact is phase-lockedlike an event-related potential (ERP) and does not appearin analyses of non-phase-locked power, which we used inall subsequent statistical tests. Further discussion of electrical induction is in Materials and Methods, Part 2: detailsfor replication and validation.EEG data analysisWe used conventional methods of time/frequency decomposition (Morlet wavelet convolution) to computeeNeuro.org
New ResearchA Inclination rotations with fixed declinationUpEInc.UP.NNWInc.DN.NDownB Antipodal Declination Rotations(A test of the ‘Quantum cDn.CCW.NDownC Identical Declination Rotations(A test of an Induction .CCW.NDownFigure 3. Magnetic field rotations used in these experiments. Inthe first 100 ms of each experimental trial, the magnetic fieldvector was either: (1) rotated from the first preset orientation tothe second (SWEEP), (2) rotated from the second preset orientation to the first (also SWEEP), or (3) left unchanged (FIXED). Inall experimental trials, the field intensity was held constant at theambient lab value ( 35 T). For declination rotations, the horizontal rotation angle was 90 or –90 . For inclination rotations,the vertical rotation angle was either 120 /–120 , or 150 /–150 , depending on the particular inclination rotation experiment.A, Inclination rotations between 60 and 75 . The magneticfield vector rotates from downwards to upwards (Inc.UP.N, red)and vice versa (Inc.DN.N, blue), with declination steady at North(0 ). B, Declination rotations used in main assay (solid arrows)and vector opposite rotations used to test the quantum compasshypothesis (dashed arrows). In the main assay, the magneticfield rotated between NE (45 ) and NW (315 ) with inclinationheld downwards ( 60 or 75 ) as in the Northern Hemisphere(DecDn.CW.N and DecDn.CCW.N); vector opposites with upwards inclination ( 60 or 75 ) and declination rotations between SE (135 ) and SW (225 ) are shown with dashed arrows(DecUp.CW.S and DecUp.CCW.S). C, Identical declination rotations, with static but opposite vertical components, used to testthe electrical induction hypothesis. The magnetic field wasshifted in the Northerly direction between NE (45 ) and NW (315 )with inclination held downwards ( 75 , DecDn.CW.N andMarch/April 2019, 6(2) e0483-18.20196 of 23Figure 3. continuedDecDn.CCW.N) or upwards ( 75 , DecUp.CW.S and DecUp.CCW.S). The two dotted vertical lines indicate that the rotationsstarted at the same declination values. In both B, C, counterclockwise rotations (viewed from above) are shown in red, clockwise in blue.post-stimulus power changes relative to a pre-stimulusbaseline interval ( 500 to 250 ms) over a 1- to 100-Hzfrequency range. We focused on non-phase-lockedpower by subtracting the ERP in each condition from eachtrial of that condition before time/frequency decomposition. This is a well-known procedure for isolating nonphase-locked power and is useful for excluding theartifact from subsequent analyses (Cohen, 2014). Following the identification of alpha-band activity as a point ofinterest (detailed in Results), the following procedure wasadopted to isolate alpha-activity in individuals. To compensate for known individual differences in peak restingalpha-frequency (8 –12 Hz in our participant pool) and inthe timing of alpha-wave responses following sensorystimulation, we identified individualized power changeprofiles using an automated search over an extendedalpha-band of 6 –14 Hz, 0 –2 s post-stimulus. For eachparticipant, power changes at electrode Fz were averagedover all trials, regardless of condition, to produce a singletime/frequency map. In this cross-conditional average,the most negative time-frequency point was set as thelocation of the participant’s characteristic alpha-eventrelated-desynchronization (alpha-ERD). A window of 250 msand 5-Hz bandwidth was automatically centered as nearlyas possible on that point within the constraints of the overallsearch range. These search and window parameters werechosen based on typical alpha-ERD durations and bandwidths. The individualized window was used to test forsignificant differences between conditions. For each condition, power changes were averaged separately within thewindow, with trials subsampled and bootstrapped to equalize trial numbers across conditions. Outlier trials with extreme values of alpha-power (typically caused by movementartifacts or brief bursts of alpha-activity in an otherwiselow-amplitude signal) in either the pre- or post-stimulusintervals were removed by an automated algorithm beforeaveraging, according to a threshold of 1.5 the interquartilerange of log alpha-power across all trials.Software, data, and open accessAnalyses were executed using automated turnkeyscripts. Raw EEG data, the analysis code and documentation have been uploaded to the Caltech data repositoryand are available under Creative Commons AttributionNonCommercial license (CC-BY-NC).Human research protocolParticipants were 36 adult volunteers (24 male, 12 female) recruited from the Caltech population. This participant pool included persons of European, Asian, Africanand Native American descent. Ages ranged from 18 to 68years. Each participant gave written informed consent ofstudy procedures approved by the Caltech InstitutionalReview Board. All experiments were performed in accoreNeuro.org
New Research7 of 23ABFigure 4. Examples of single-trial, time-domain, bandpass-filtered (1–50 Hz) EEG traces at electrode Fz from phantom (cantaloupe)and human participants (one with low and one with high baseline alpha-power) that illustrate the type of data gathered in this study.A, Effect of a 0.1 s inclination sweep of a Northward-pointing, 35- T magnetic field rotating between a dip of 75 down to 75 up(Inc.UP.N, left panels) and the reverse (Inc.DN.N, right panels). This is the largest stimulus used in our experiments (150 arc, effectivefrequency 4.2 Hz, with the full vector of 35- T undergoing rotation). The cantaloupe records an 40- V artifact during the sweepinterval but is otherwise flat. A similar artifact can be seen on humans with low alpha-power but is invisible in humans with highalpha-power without trial-averaging. B, Effect of a 0.1-s declination sweep of the horizonal magnetic component (inclination 75 ,total field 35 T, so horizontal component 9.1 T) rotating from NE to NW in the presence of a static, downward directed verticalmagnetic field (33.8 T; DecDn.CCW.N) and the reverse (DecDn.CW.N). This is a weaker electrical stimulus than used in A (only a 90 arc, a lower effective frequency of 2.5 Hz, and a quarter the field intensity). The cantaloupe shows only a weak artifact of 10 Vduring the rotation. In most humans with high or low alpha-power, this artifact is hard to detect without extensive averaging. Artifactsof this sort are phase-locked to the stimulus and are easily removed using standard techniques for analyzing non-phase-locked poweras noted in the EEG Methods section. Note that this human example shows an obvious drop in the alpha-power following the CCWrotation but not the CW rotation.dance with relevant guidelines and regulations followingNIH protocols for human experimentation, as reviewedand approved periodically by the Administrative Committee for the Protection of Human Subjects (Caltech IRB,protocols 13-0420, 17-0706, and 17-0734). All methodswere carried out in accordance with relevant guidelinesand regulations. Informed consent using forms approvedby the Caltech Institutional Review Board was obtainedfrom all subjects. No subjects under the age of 18 wereused in these experiments.Part 2: details for replication and validationMagnetic ex
Magnetoreception, the perception of the geomagnetic field, is a sensory modality well-established across all major groups of vertebrates and some invertebrates, but its presence in humans has been tested rarely, yielding inconclusive results. We report here a strong, specific human brai