Transcription
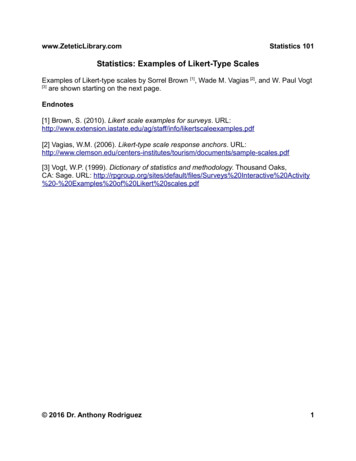
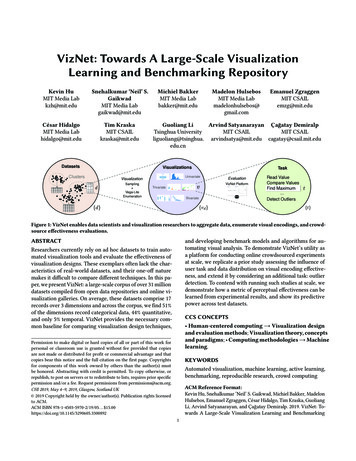
VizNet: Towards A Large-Scale VisualizationLearning and Benchmarking RepositoryKevin HuMIT Media Labkzh@mit.eduSnehalkumar ‘Neil’ S.GaikwadMIT Media Labgaikwad@mit.eduCésar HidalgoMIT Media Labhidalgo@mit.eduTim KraskaMIT CSAILkraska@mit.eduDatasetsClustersMichiel BakkerMIT Media Labbakker@mit.eduMadelon HulsebosMIT Media Labmadelonhulsebos@gmail.comGuoliang LiArvind Satyanarayan Çağatay DemiralpTsinghua UniversityMIT CSAILMIT CSAILliguoliang@tsinghua. arvindsatya@mit.edu eVisualizationSampling Vega-LiteEnumerationEmanuel ZgraggenMIT CSAILemzg@mit.eduTaskEvaluationVizNet PlatformTrivariateBivariateRead ValueCompare ValuesFind Maximum.Detect OutliersFigure 1: VizNet enables data scientists and visualization researchers to aggregate data, enumerate visual encodings, and crowdsource efectiveness evaluations.and developing benchmark models and algorithms for automating visual analysis. To demonstrate VizNet’s utility asa platform for conducting online crowdsourced experimentsat scale, we replicate a prior study assessing the infuence ofuser task and data distribution on visual encoding efectiveness, and extend it by considering an additional task: outlierdetection. To contend with running such studies at scale, wedemonstrate how a metric of perceptual efectiveness can belearned from experimental results, and show its predictivepower across test datasets.ABSTRACTResearchers currently rely on ad hoc datasets to train automated visualization tools and evaluate the efectiveness ofvisualization designs. These exemplars often lack the characteristics of real-world datasets, and their one-of naturemakes it difcult to compare diferent techniques. In this paper, we present VizNet: a large-scale corpus of over 31 milliondatasets compiled from open data repositories and online visualization galleries. On average, these datasets comprise 17records over 3 dimensions and across the corpus, we fnd 51%of the dimensions record categorical data, 44% quantitative,and only 5% temporal. VizNet provides the necessary common baseline for comparing visualization design techniques,CCS CONCEPTS Human-centered computing Visualization designand evaluation methods; Visualization theory, conceptsand paradigms; Computing methodologies Machinelearning.Permission to make digital or hard copies of all or part of this work forpersonal or classroom use is granted without fee provided that copiesare not made or distributed for proft or commercial advantage and thatcopies bear this notice and the full citation on the frst page. Copyrightsfor components of this work owned by others than the author(s) mustbe honored. Abstracting with credit is permitted. To copy otherwise, orrepublish, to post on servers or to redistribute to lists, requires prior specifcpermission and/or a fee. Request permissions from permissions@acm.org.CHI 2019, May 4–9, 2019, Glasgow, Scotland UK 2019 Copyright held by the owner/author(s). Publication rights licensedto ACM.ACM ISBN 978-1-4503-5970-2/19/05. . . DSAutomated visualization, machine learning, active learning,benchmarking, reproducible research, crowd computingACM Reference Format:Kevin Hu, Snehalkumar ‘Neil’ S. Gaikwad, Michiel Bakker, MadelonHulsebos, Emanuel Zgraggen, César Hidalgo, Tim Kraska, GuoliangLi, Arvind Satyanarayan, and Çağatay Demiralp. 2019. VizNet: Towards A Large-Scale Visualization Learning and Benchmarking1
our results do exhibit several statistically signifcant diferences as a result of our more diverse backing datasets. Thesediferences inform our discussion on how crowdsourcedgraphical perception studies must adapt to and account forthe variation found in organic datasets. VizNet along withdata collection and analysis scripts is publicly available athttps://viznet.media.mit.edu.Data visualization is an inherently combinatorial designproblem: a single dataset can be visualized in a multitude ofways, and a single visualization can be suitable for a rangeof analytic tasks. As the VizNet corpus grows, assessingthe efectiveness of these (data, visualization, task) triplets,even using crowdsourcing, will quickly become time- andcost-prohibitive. To contend with this scale, we conclude byformulating efectiveness prediction as a machine learningtask over these triplets. We demonstrate a proof-of-conceptmodel that predicts the efectiveness of unseen triplets withnon-random performance. Our results suggest that machinelearning ofers a promising method for efciently annotatingVizNet content. VizNet provides an important opportunityto advance our understanding of graphical perception.Repository. In CHI Conference on Human Factors in ComputingSystems Proceedings (CHI 2019), May 4–9, 2019, Glasgow, ScotlandUK. ACM, New York, NY, USA, 12 pages. https://doi.org/10.1145/3290605.33008921 INTRODUCTIONA primary concern in visualization is how to efectively encode data values as visual variables. Beginning with Cleveland and McGill’s seminal work [11], researchers have studied this question of graphical perception by conducting human subjects experiments. And increasingly, researchersare seeking to operationalize the guidelines such studiesproduce using handcrafted rule-based systems [49, 73] orlearned models [18, 27, 41].To increase the scale and diversity of the subject pool,modern studies have eschewed traditional laboratory setupsin favor of crowdsourcing platforms [24]. But a constrainingfactor for true ecological validity remains. Collecting, curating, and cleaning data is a laborious and expensive processand, thus, researchers have relied on running studies with adhoc datasets. Such datasets, sometimes synthetically generated, do not display the same characteristics as data found inthe wild. Moreover, as one-of exemplars, their use makes itdifcult to compare approaches against a common baseline.Large-scale databases (such as WordNet [47] and ImageNet [17]) have proven instrumental in pushing the state-ofthe-art forward as they provide the data needed to train andtest machine learning models, as well as a common baselinefor evaluation, experimentation, and benchmarking. Theirsuccess has led researchers to call for a similar approachto advance data visualization [3, 20]. However, insufcientattention has been paid to design and engineer a centralizedand large-scale repository for evaluating the efectiveness ofvisual designs.In response, we introduce VizNet: a corpus of over 31million datasets (657GB of data) compiled from the web,open data repositories, and online visualization platforms.In characterizing these datasets, we fnd that they typicallyconsist of 17 records describing 3 dimensions of data. 51%of the dimensions in the corpus record categorical data, 44%quantitative, and only 5% measure temporal information.Such high-level properties, and additional measures suchas best statistical ft and entropy, contribute a taxonomy ofreal-world datasets that can inform assessments of ecologicalvalidity of prior studies.We demonstrate VizNet’s viability as a platform for conducting online crowdsourced experiments at scale by replicating the Kim and Heer (2018) study assessing the efectof task and data distribution on the efectiveness of visualencodings [29], and extend it with an additional task: outlierdetection. While largely in line with the original fndings,2 RELATED WORKVizNet is motivated by research in graphical perception, automated visualization based on machine learning, and crowdsourced eforts towards data collection for visualization research. VizNet also draws on the digital experimentationcapabilities of large-scale machine learning corpora.Graphical PerceptionVisual encoding of data is central to information visualization. Earlier work has studied how diferent choices of visual encodings such as position, size, color and shape infuence graphical perception [12], the decoding of data presented in graphs. Through human subjects experiments, researchers have investigated the efects of visual encodingon the ability to read and make judgments about data represented in visualizations [12, 25, 32, 37, 64–66, 70]. Consequently, prior research has provided rankings of visualvariables by user performance for nominal, ordinal, and numerical data [12, 37, 42, 43, 63]. Researchers have also studiedhow design parameters beyond visual encoding variablessuch as aspect ratio [9, 23, 67], size [10, 26, 34], chart variation [33, 69], and axis labeling [68] impact the efectivenessof visualizations. Previous studies have evaluated how usertask, data types and distributions infuence the efectivenessof charts [56] and visual encoding variables [29].Graphical perception experiments in current practice aretypically conducted on single datasets with small size andvariety, lacking the characteristics of real-world data. Studiesbased on ad hoc datasets may provide useful results but areinherently partial and difcult to generalize, reproduce and2
compare against. VizNet provides a corpus of real-worldtables from diverse domains to make it easier for researchersto run visualization design evaluation studies at scale. VizNetis sufciently rich both in size and variety to satisfy thedata needs of a substantial number of experimental designs,facilitating the comparison of and reasoning about resultsfrom diferent experiments on a common baseline.Machine Learning CorporaRecent developments of large-scale data repositories havebeen instrumental in fostering machine learning research.Access to rich, voluminous data is crucial for developing successful machine learning models and comparing diferent approaches on a common baseline. To this end, researchers havecreated centralized data repositories for training, testing, andbenchmarking models across many tasks. Publicly availablerepositories such as ImageNet [17], SUN [74], COCO [39],etc. are one of the main drivers behind the rapid advances indeep learning. VizNet is informed and inspired by the digitalexperimentation capabilities of large-scale data repositoriesin machine learning research.Data Collection for Visualization ResearchAlthough researchers recognize the need for data collectionand generation to facilitate evaluation across a broad rangeof real datasets [59, 61], little efort has been made to createcentralized corpora for data visualization research. Beagle [4]has been used to scrape over 41,000 visualizations from theweb. Similarly, the MassVis [5] database was compiled byscraping over 5,000 visualizations from the web and partially annotating them. Lee et al. [62] recently extracted andclassifed 4.8 million fgures from articles on PubMed Central. However, these datasets do not include the raw datarepresented by the visualizations, limiting their utility forgeneralized and reproducible visualization research.3DATAVizNet incorporates four large-scale corpora, assembled fromthe web, online visualization tools, and open data portals.CorporaThe frst category of corpora includes data tables harvestedfrom the web. In particular, we use horizontal relationaltables from the WebTables 2015 corpus [6], which extractsstructured tables from the Common Crawl. In these tables,entities are represented in rows and attributes in columns.The second type of corpus includes tabular data uploadedby users of two popular online data visualization and analysissystems. Plotly [53] is a software company that developsvisualization tools and libraries. Once created, Plotly chartscan be posted to the Plotly Community Feed [54]. Using thePlotly API, we collected approximately 2.5 years of publicvisualizations from the feed, starting from 2015-07-17 andending at 2018-01-06. The second system, ManyEyes [71]allowed users to create and publish visualizations througha web interface. It was available from 2007–2015, and wasused by tens of thousands of users [50].The third type of corpus includes public data from theOpen Data Portal Watch [48, 51], which catalogs and monitors 262 open data portals such as data.noaa.gov fromCKAN, finances.worldbank.org from Socrata, and opendata.brussels.be from OpenDataSoft. The majority ofthese portals are hosted by governments, and collect civicand social data.VizNet aggregates these corpora into a centralized repository. However, the majority of datasets are from WebTables. Therefore, in the following sections, we describe eachcorpus individually with 250K randomly sampled datasets,to avoid oversampling the WebTable corpus. We combinethese datasets into a balanced sample of one million datasets,which we refer to as the VizNet 1M corpus.Automated Visualization using Machine LearningData-driven models based on responses elicited through human subjects experiments are common in the psychophysicsand data visualization literature. For example, low-level perceptual models such as the Weber-Fechner Law, Stevens’Power Law, the CIELAB color space, and perceptual kernels [15] all ft various models to empirical user data, informing low-level visual encoding design. Earlier researcherspropose using such models to generate and evaluate visualizations (e.g., [15, 16, 60]).In a natural extension to these earlier ideas, researchershave recently introduced machine learning-based systemsfor automated visualization design. Data2Vis [18] uses aneural machine translation approach to create a sequenceto-sequence model that maps JSON-encoded datasets to Vegalite visualization specifcations. Draco-Learn [49] learns tradeofs between constraints in Draco. DeepEye [41] combinesrule-based visualization generation with models trained toclassify a visualization as “good" or “bad" and rank lists ofvisualizations. VizML [27] uses neural networks to predictvisualization design choices from a corpus of one milliondataset-visualization pairs harvested from a popular onlinevisualization tool. Results from this recent work are promising but also point at the need for large-scale real-world training data with sufcient diversity [57]. VizNet addresses thisresearch gap and provides 31 million real-world datasetsfrom everyday domains and can be used for training machine learning models to drive visualization systems.3
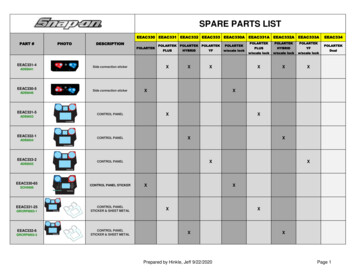
responses from 1,920 participants on Amazon’s Mechanical Turk (MTurk), who individually completed 96 questionsand 12 engagement checks, and calculated the absolute andranked performance of diferent (D V T) conditions, aswell as the interaction efects between diferent data characteristics, visual channels, and task types. These resultsextended existing models of encoding efectiveness, suchas APT [43], and provided valuable insights for automaticvisualization design systems.CharacterizationSummary statistics and underlying distributions of each ofthe fve corpora are shown in Figure 2. The data type of acolumn is classifed as either categorical, quantitative, or temporal, which we abbreviate as C, Q and T, respectively. Thisdata type is detected using a heuristic-based approach thatincorporates column name and value information. For quantitative columns, we use the Kolmogorov-Smirnov test [45]to examine the goodness-of-ft of six distributions: the normal, log-normal, exponential, power law, uniform and chisquared distributions. We reject the null hypothesis of adistribution ft if the p-value of the associated test is lowerthan the level α 0.05. If all distributions are rejected atα, we consider the distribution to be undefned. If multipledistributions are not rejected, we consider the “best" ft to bethat with the highest p-value. We also report the skewnessand percent of outliers, defned as data points that fall morethan 1.5 IQR below the frst quartile or above the thirdquartile, where IQR is the interquartile range. The statisticaldistribution of categorical columns within each corpus ischaracterized using the normalized entropy.DatasetsFor this experiment, we sampled VizNet datasets accordingto a procedure that matched constraints from Kim and Heer(2018) and ensured that participants only saw valid datawithout missing values. This procedure was developed afteran initial pilot study with a subset of the corpus in which alldatasets were manually verifed.To begin, we identifed all datasets with more than onecategorical feld and two quantitative felds (C 1 and Q 2).Then, we sampled all possible three column subsets withexactly one categorical and two quantitative felds (C 1, Q 2).Following this sampling, we fltered out datasets using anumber of constraints. First, we rejected datasets containingany null values. Second, we required that the column namesof all datasets must contain between 1 and 50 ASCII-encodedcharacters. Third, we limited the cardinality (e.g. the numberof unique groups) of the categorical columns between 3 and30. Fourth, we restricted the group names between 3 and 30characters, at least one of which is alphanumeric. Lastly, werequired that each of the groups must contain 3 to 30 values.We chose these values to be consistent with the upper andlower constraints of Kim and Heer (2018).Our sampling procedure resulted in 2,941 valid datasetsfrom the Open Data Corpus (100,626 possible combinations),6,090 valid datasets from Many Eyes (354,206 combinations),1,368 from Plotly (347,387 combinations), and 82,150 froma subset of the Webtables corpus (1,512,966 combinations).From this set of candidates, we randomly selected 200 candidates per visualization specifcation task condition. Weuse V to denote the number of visualization specifcationsand T to denote the number of tasks, which leads to 60 suchconditions (V T 12 5 60). The 200 number of datasetssampled from the VizNet corpus is consistent with the 192datasets sampled in Kim and Heer (2018). As a result, thissampling resulted in 200 12 2, 400 datasets per task, 2, 400datasets per corpus, and 9, 600 2, 400 4 total datasets.4 EXPERIMENT DESIGNTo evaluate the utility of VizNet as a resource for data scientists and visualization researchers, we conducted an experiment where we frst replicated the Kim and Heer (2018)prior study [29] using real-world datasets from the VizNetcorpus to assess the infuence of user task and data distribution on visual encoding efectiveness. These datasets weresampled to match constraints from the prior study and ensure that participants only saw valid data. We then extendedthis experiment by including an additional task on outlierdetection. Finally, we trained a machine learning model thatlearns the perceptual efectiveness of diferent visual designsand evaluated its predictive power across test datasets.Replication of Kim and Heer (2018)Kim and Heer (2018), “Assessing Efects of Task and Data Distribution on the Efectiveness of Visual Encodings," conducteda crowdsourced experiment measuring subject performance(i.e. error rate and response time) across data distributions(D), visualization designs (V), and task types (T). The 24data distributions characterize trivariate data involving onecategorical and two quantitative felds (C 1, Q 2) sampledfrom 2016 daily weather measurements [46] according tounivariate entropies of the quantitative felds, cardinalities,and number of records per category.The authors employed a mixed design using a withinsubjects treatment for visual encodings and between-subjectstreatments for tasks and data characteristics. They analyzedVisual EncodingsWe selected the twelve visual encoding specifcations chosenin Kim and Heer (2018). These encodings are specifed usingthe Vega-Lite grammar [58], which specifes plots using ageometric mark type (e.g. bar, line, point) and a mapping4
ofColumnsNumberofColumnsNumberColumnsCount (log)54321010 024100,000,0001,000,00068Number of Rows ibution .90.80.70.30.60.50.20.40.30.10.20.10.00.0-0.5 0.0 0.5 1.0 1.5 0.0 0.2 0.4 0.6 0.8 1.0 0.0 0.2 0.4 0.6 0.8 0.0ihi wExp0.10.10.1Nor0.20.20.20.50.40.30.20.10.0Percent OutliersCorpus-level: Three Column DatasetsType Composition(C Q evelFrequencyDataset-levelCQTNormalized EntropyCorpus1203002100210302011111020120030.0 0.20.30.40.50.60.70.80.91.0Frequencyt-SNE EmbeddingWeb TablesPlotlyMany EyesOpen DataVizNetKim and HeerFigure 2: Summary statistics (top) and distributions (bottom) of the four source corpora and the VizNet 1M corpus. In thetop table, we report the median number of rows and columns. The Distribution column includes the top three most frequentcolumn distributions. Distributions are abbreviated as Norm normal, L-N log-normal, Pow power law, Exp exponential,Unif uniform, and Und undefned. The bottom part of the fgure contains distributions describing columns, datasets, andthe entire corpus. The bars outlined in red represent three column datasets and the subset which contain one categorical andtwo quantitative felds. The clustering of three column (C 1, Q 2) datasets is shown in more detail in Figure 5.
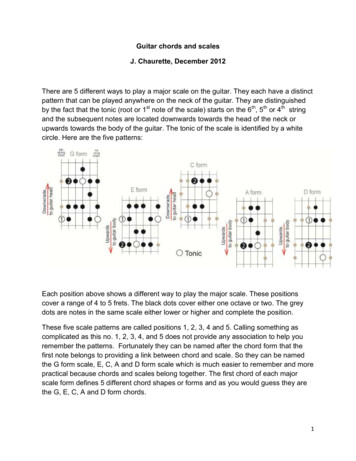
real) for each of the 12 visual encodings, presented in a random order. Every participant was assigned to a specifc task.Unlike Kim and Heer (2018), we did not incorporate datasetconditions. Each dataset was selected randomly from thepool of 200 datasets per V T condition. In order to ensurereliable human judgment, we followed the process from Kimand Heer (2018) and incorporated 12 evenly distributed goldstandard tasks. The gold standard tasks presented a userwith a real dataset encoded in the present visual encodingcondition, and asked what information is presented in thevisual channel that encodes the frst quantitative column(Q 1 ).Figure 3: VizNet user interface for the Compare Values taskexperiment.ParticipantsCrowdsourcing platforms such as MTurk are widely usedto recruit participants and conduct online experiments atscale [30, 44]. We recruited in total 1,342 MTurk workerswho were located in the U.S. and had 95% HIT approvalrating.During the analysis, we included the following criteria toensure the quality of human judgment: we selected subjectswho accurately answered 100% of the gold standard questions, had an experimental error rate of less than 60%, andcan efectively distinguish colors. We had set the gold standard response exclusion threshold to 100% (i.e., discardingresponses if even 1 out of these 12 questions was answeredincorrectly). We have verifed that a more lenient 80% exclusion threshold does not signifcantly change the results. Kimand Heer (2018) does not report a dropout rate, making itdifcult to assess whether and by how much our dropoutrate difers. We included two Ishihara color blindness platetests [28] along with two pre-screen questions to ensurethe participants can efectively distinguish colors. A total of96.47% reported no vision defciency and were allowed toparticipate in the experiment. This resulted in a total of 624participants’ data for in the analysis.Of the 624 participants, 43.75% were male, 55.44% female,and 0.48% non-binary. 6.38% of the participants had no degree, whereas others had bachelor’s (43.10%), master’s (14.90%),Ph.D. (3.04%), associate (14.58%) degrees as well as a highschool diploma (17.46%). Each participant received 1.00 USDin compensation, which we calculated using the averagetimes of a pilot study and the same hourly wage of Kim andHeer (2018).from data felds to visual encoding channels (e.g. x, y, color,shape, and size). In particular, Kim and Heer (2018) usedtwelve visualization designs, all of which are scatterplots(a point mark) with diferent mappings between data andencoding channels.We used the Tableau-10 scheme for color encoding categorical felds with cardinality less than 10, and Tableau-20for categorical felds with cardinality greater than or equalto 20. For positional encodings, in contrast to Kim and Heer(2018), we used a heuristic to determine whether an axisshould start at zero. If the range of a variable Q is less than10% of maximum value 0.1 max(Q) , then we default toVega-lite axis ranges. Based on a pilot study, we found thatthis heuristic was necessary to ensure that no questions wereprohibitively difcult.TasksFollowing Kim and Heer (2018), we considered 4 visualization tasks informed by the Amar et al. (2005) [2] taxonomyof low-level analytic activities. Two of those tasks were valuetasks: Read Value and Compare Values asked users to readand compare individual values. The other two tasks weresummary tasks: Find Maximum and Compare Averages required the identifcation or comparison of aggregate properties. Each of these tasks was formulated as a binary question(two-alternative forced choice questions). We generated thetwo alternatives using the procedure described in the priorstudy.Procedure5 RESULTSIn this section, we describe the results of our experiment,compare them with the results of Kim and Heer (2018) [29],and demonstrate a machine learning-based approach to predicting efectiveness from (data, visualization, task) triplets.Identical to Kim and Heer (2018), we also employed a mixeddesign incorporating a within-subjects treatment for visualencodings and a between-subjects treatment for tasks. Eachparticipant answered 9 questions (1 attention check and 86
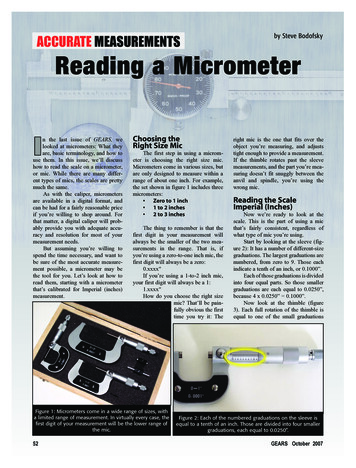
Log Completion Time (s)Error RateComparing Subject PerformanceDetect OutlitersCompare AveragesFind MaximumCompare ValuesRead ValueWe frst compared subject performance with the quantitative results of Kim and Heer (2018) by considering aggregateerror rates and log response times per visualization specifcation and task condition (V T 12 4). Following this,we calculated mean error rates with 95% bootstrapped confdence intervals, performed by sampling participants withreplacement. To analyze the diference of mean error ratesand response times we conducted permutation tests with 104permutations. We test signifcance at a signifcance level ofα 0.05 with Bonferroni correction for our m 48 hypotheses. The results for the error rate and log response times areshown in Figure 4.The absolute error rates of our replication tend to agreewith those of Kim and Heer (2018) for the Read Value task,and to a lesser extent for the Compare Values task. The rankings of diferent visual encodings are also similar. However,for the the summary tasks (Find Maximum and Compare Averages), our observed error rates depart from those of Kim andHeer (2018). Though more data points are needed to drawmeaningful conclusions, these results suggest that real-worlddata afects error rates for more complex tasks.In contrast, the absolute response times in our study seemto be systematically longer for all tasks except the CompareValues task. However, the relative rankings of diferent encoding are consistent with those of Kim and Heer (2018).Extending with an Outlier Detection TaskAs suggested by Kim and Heer (2018), investigating additional task types is a promising direction of future research.In particular, tasks with more subjective defnitions, such asCluster and Find Anomalies were not included in Kim andHeer (2018). Nevertheless, as outlier detection is one of themost important data analysis tasks in practice, it warrantsfurther empirical study. We extended the prior work by considering this latter task of identifying “which data cases in aset S of data cases have unexpected/exceptional values.”We generated 2,400 datasets using the sampling methodology described in the previous section. First, we presentedusers with a defnition of outliers as “observations that lieoutside the overall pattern of distribution.” Then, using thesame experiment design, we assessed answers to the question “Are there outliers in Q 1 ?” “Yes” and “No” are providedas response options. Outliers were determined using the median absolute deviation (MAD)-based approach describedin [38], which is robust to varying sample sizes, comparedto other simple approaches.We found that the error rates for the outlier detection taskare higher compared to the other tasks (see Figure 4). Thismay be due to an inadequate measure of ground truth, inconsistent defnitions, or lack of prior training. It is 54.0Encoding (Q1, Q2, C)Kim and HeerVizNetFigure 4: Bootstrapped means and 95% confdence intervalsfor error rates (left) and log response times (right) acrosstasks and visual encodings for Kim and Heer (2018) originaldata, and our replication on VizNet. We reuse the originalcolor encoding of Kim and Heer (2018). Shading indicates astatistically signifcant diference.to note that the specifcation rankings resemble that of theRead Value task: color and size trail behind other encodingschannels. Conversely, the log response times are signifcantlyshorter than for other tasks, for all except the faceted chartswith row encodings.7
5-fold CV R2 0.4687fitFigure 6: Observed log response times (in seconds) vs. thosepredicted by a gradient boosted regression tree. The dotteddiago
data collection and analysis scripts is publicly available at https://viznet.media.mit.edu. Data visualization is an inherently combinatorial design problem: a single dataset can be visualized in a multitude of ways, and a single visualization can be suitable for a range