Transcription
Procedures for EstimatingEarthquake Ground Motions
PROCEDURES FOR ESTIMATINGEARTHQUAKE GROUND MOTIONS
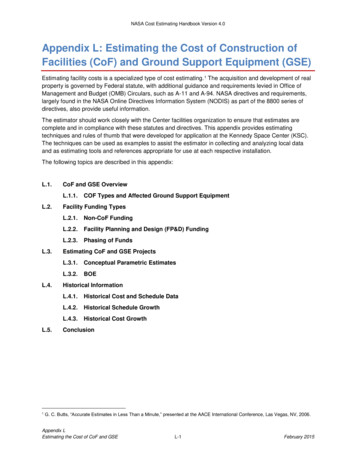
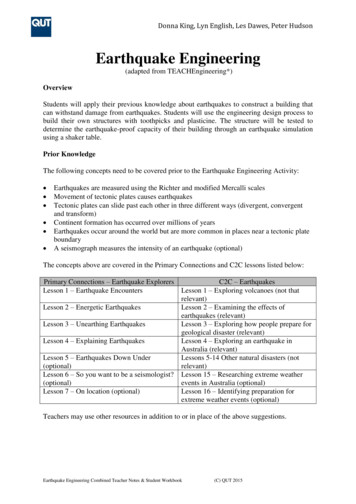
High-altitude view of the San Francisco Bay region showing surface traces of the Hayward and Calaveras faults. The Hayward fault was thesource of two large earthquakes in 1836 and 1868 that caused surface rupture along as much as 64 km of its trace. The Calaveras fault, witha length of approximately 160 km, is one of the largest in northern California. The San Andreas fault passes offshore near Mussel Rock(arrow at bottom of photograph). Fault systems such as these must be critically studied when evaluating the seismic hazards and risk in anurban area.
Procedures for EstimatingEarthquake Ground MotionsBy WALTER W. ONALPRINTING OFFICE,PAPERWASHINGTON1114:1980
UNITED STATES DEPARTMENT OF THE INTERIORCECIL D. ANDRUS, SecretaryGEOLOGICAL SURVEYH. William Menard, DirectorLibrary of Congress Cataloging in Publication DataHays, Walter W.Procedures for estimating earthquake ground motions.(Geological Survey professional paper ; 1114)Bibliography: p. 69-77.Supt.ofDocs.no.: 119.16:11141. Earthquakes-United States. 2. Seismology United States. 3. Earthquakeresistant design. I. Title. II. Series: United States. Geological Survey.Professional paper ; 1114.QE539.H39363.3'49579-607183For sale by the Superintendent of Documents, U.S. Government Printing OfficeWashington, D.C. 20402Stock Number 024-001-03276-7
CONTENTSPageGlossary VIIAbstract 1Introduction 2Determine seismicity 3Sources of information 5Summary of United States earthquake history 5Identify seismotectonic features. 9Summary of United States earthquakes 12Western United States 12Eastern United States 17Determine regional seismic attenuation 19Define the characteristics of ground shaking expected at the site 21The seismogram 23Types of information derived from the seismogram 25Peak ground acceleration. 28Peak ground velocity and displacement 31Duration 33PageDefine the characteristics of ground shaking—ContinuedSpectraKnowledge gained from nuclear explosion groundmotion studies - —— ————— ————Intensity ———— — —— ———Probabilistic estimates of peak ground accelerationEffective peak ground acceleration ——————————Define design response spectra for site — ——————Summary of procedures for siting of nuclear powerplantsSite-independent response spectra —————— ————Site-dependent response spectra —————— —— ——Design time histories ——— ——— —— ————Determine local ground response ——————————Summary of Uniform Building Code proceduresDefine uncertainties of the ground-motion design values ———Seismic design trends for the future ---———References cited — ——— —————— ———— ILLUSTRATIONSPageFRONTISPIECE.FIGUREHigh-altitude view of the San Francisco Bay region showing surface traces of the Hayward and Calaveras faults.1. Flow diagram illustrating steps in estimating ground motions for design of earthquake-resistant structures ——2-5. Maps showing:2. Location of past destructive earthquakes in the United States3. Areas of the conterminous United States where regional seismicity studies have been made—— ——— —4. Seismic source zones within the conterminous United States ——————— —— ----—5. Principal faults in the vicinity of Fremont, Calif — — ——— ———— - — ——— ———6. Chart for correlating fault rupture length and earthquake magnitude ———— —————— -- —— ———7-15. Maps showing:7. Major tectonic features along the Pacific-North American plate boundary in Alaska —— — ——— ————8. Epicenters of earthquakes in Alaska between 1962 and 1969 — ——————— ——— ————9. Major faults in southern Alaska ———————— —————— ——— ——— ——— --—10. Major faults in California and Nevada and locations of past surface ruptures — ———— ——11. Wasatch fault zone. —-- ————— — ——— ———12. Major tectonic features and historic earthquake activity in the Mississippi Valley area — ——— ———13. Historic seismicity in South Carolina area — — ———— ——— ——— ——— — ——— ————14. Isoseismal contours for 1971 San Fernando, Calif., earthquake — ——— ——— — ————15. Isoseismal contours for 1906 San Francisco and 1811 New Madrid earthquakes ———— — ——— —————16-20. Graphs showing:16. Empirical intensity attenuation curves proposed for the southern Appalachian seismic zone and thecentral Mississippi Valley -- -———————— ——17. Average value of maximum acceleration in relation to distance from fault for earthquakes of variousmagnitudes, Western United States — —— ——————— ——— ———18. Schnabel and Seed acceleration-attenuation curves modified for use in the Eastern United States ————19. Acceleration-attenuation relations derived from worldwide earthquakes and the San Fernando earth quake, 197120. Frequency-dependent attenuation of horizontal ground motions, southern Nevada and Colorado ——— —21. Schematic diagram of elements that affect ground motion22. Accelerogram of the 1940 Imperial Valley, Calif, earthquake recorded at El Centre, CalifV4678111212131415171819202122222324262627
VICONTENTSPageFIGURE23. S. 16 E. accelerogram recorded at Pacoima Dam and the velocity and displacement seismograms derived from it;1971 San Fernando, Calif., earthquake24. Graphic illustration of determination of Richter magnitude-- —————————————25. Graph showing range of horizontal peak acceleration as a function of distance and magnitude for rock sites in theWestern United States26. Graph showing relation between peak horizontal ground velocity and distance from source of energy release formagnitude 6.5 earthquakes- ——— ———— - —————— —27. Bracketed duration values for the S. 16 E. accelerogram recorded at Pacoima Dam from the 1971 San Fer nando earthquake and graph showing bracketed duration as a function of magnitude and fault rupturelength28. Graph of integral definition of duration of shaking for a site on rock and a site underlain by alluvium — —————29. Graph of Fourier amplitude spectrum derived from the accelerogram recorded at El Centre from the 1940 Im perial Valley, Calif, earthquake — — ————30-35. Schematic illustrations of:30. Far-field displacement spectrum and some of the information about the source that can be derived fromit— —31. Narrow-band-pass filtering involved in deriving a response spectrum —— ——————————— —————32. Response spectra derived from the 1940 Imperial Valley, Calif, earthquake accelerogram —————————33. Time-dependent response envelope derived from the 1940 Imperial Valley, Calif, earthquake accelerogram34. Source effects on the spectral composition of ground motion �———35. Transmission path effects on the spectral composition of ground motion, 1971 San Fernando earthquake-36. Map showing Nevada Test Site and vicinity ————37-41. Graphs showing:37. Response spectra for 1940 Imperial Valley, Calif, earthquake and Cannikin nuclear explosion— —— ———38. Response spectra for two sites equidistant from energy source but on different travel paths39. Variability of ground motion recorded at two sites in Tonopah, Nev40. Intensity and acceleration relations41. Mean values and standard-deviation error bars of peak ground acceleration, peak ground velocity, andpeak ground displacement as a function of Modified Mercalli intensity, Western United States ———42. Map showing levels of peak horizontal ground acceleration expected at the 90-percent probability level at rocksites in the United States within a 50-year period43. Acceleration, velocity, and displacement seismograms from the 1966 Parkfield, Calif., earthquake recorded atstation Cholame-Shannon No. 2 ————— ———44-56. Graphs showing:44. Variation in ground-motion response spectra and peak ground acceleration values for the same value ofModified Mercalli intensity, San Fernando, Calif, earthquake —45. Site-independent velocity and acceleration response spectra ————46. Schematic illustration of technique for developing site-independent response spectra ———— ———47. "Standard" site-independent horizontal response spectra ——————— ————48. Site-independent horizontal response spectra scaled to 1.0 g —— — ———— ———49. Site-independent vertical response spectra. — ————— ——— ———50. Comparison of site-independent, horizontal response spectra produced by three different procedures ——51. Site-dependent mean and mean-plus-one-standard-deviation response spectra for four site classifications52. Comparison of site-dependent mean and mean-plus-one-standard-deviation response spectra with AECRegulatory Guide 1.60 spectrum ————53. Effect of strain level on shear modulus and damping ——— ————— ————————————54. Comparison of smooth response spectra for three soil columns- ————— ——— ———————55. Average acceleration response spectra for four site classifications ————— —————— —— ————56. Site transfer function for two sites in the Glendale, Calif, area derived from aftershocks of the 1971 SanFernando earthquake ————————————57. Map showing location of seismograph stations and thickness of alluvium in Las Vegas Valley and graphsshowing variation of horizontal velocity response spectra for two stations and their site transfer function ——58. Contour maps showing the radial component of relative ground response in the period band 3.33-4.50 s and thick ness of alluvium, Las Vegas Valley - ————————————59. Variation of ground motion with depth, Beatty, Nev —— ————————————60. Parametric curves for amplification of SH waves ————— �————61-64. Graphs showing:61. Example of site transfer function, elastic response ————— ————62. Normalized rock response spectrum, 5-percent damping —— ————————————63. Parametric curves for high-strain amplification of SH waves and three depths of unconsolidatedmaterials64. Effect of peak acceleration level on amplification ———— —————— ————————————65. Map showing United States seismic risk zones.66. Map showing preliminary design regionalization proposed for 1976 Uniform Building Code67. Graph showing soil-structure interaction factor proposed for 1976 Uniform Building Code ——————— 46566
.18.19.20.21.22.23.Property damage and lives lost in notable United States earthquakes ——————————————Summary of earthquake recurrence relations in the United States �—Relative seismicity of regions of the United StatesSeismicity parameters for seismic source zones — ——————————— —Criteria for recognizing an active fault ————Classification of fault activityClassification of selected faults relative to Fremont, Calif —————————Relative intensity values and ground character, central California ———— —————— — ————————Distance attenuation exponents derived from horizontal component PSRV spectra:9. Northern Utah area ——————————————10. Southern Nevada area - ————————————11. California12. Piceance Creek Basin, Colo �——13. San Juan Basin, N. Mex —————————Magnitudes and seismic moments of southern California earthquakes — ———————————————— ————————Values of peak horizontal ground acceleration recorded in past earthquakes and used for estimating horizontalground motions in earthquake-resistant design — ——————— — ——————————Values of peak horizontal ground velocity and displacement derived from accelerograms of past earthquakes andused for estimating horizontal ground motions in earthquake-resistant design —————————— ———————Characteristics of the data samples used in selected studies of the correlation of Modified Mercalli intensity andpeak ground acceleration �————Horizontal ground accelerations for the operating basis earthquake and safe shutdown earthquake for nuclearpowerplant sites in the United States �———Earthquake accelerograms used to derive site-independent spectra ———————— ———————Relative values of maximum ground acceleration, velocity, and displacement; "standard earthquake' ———————Horizontal design response spectra and relative values of spectrum amplification factors for control points ————Vertical design response spectra and relative values of spectrum amplification factors for control points —————Uncertainties in physical parameters that affect ground motion - ——— ——————————— ARYAbsorption. A process whereby the energy of a seismic wave is con verted into heating of the medium through which the wave passes.AcceFerogram. The record from an accelerometer showing acceler ation as a function of time.Accelerometer. An instrument for measuring acceleration.Acceptable risk. A specification of the acceptable number offatalities due to earthquake hazards, or an equivalent statementin terms of loss in buildings.Acoustic impedance. Seismic wave velocity multiplied by densityof the medium.Active fault. A fault is active if, because of its present tectonicsetting, it can undergo movement from time to time in the im mediate geologic future.Aftershocks. Minor seismic tremors that may follow an under ground nuclear detonation or the secondary tremors after the mainshock of an earthquake.Alluvium. A general term for loosely compacted particles of rock,sand, clay and so forth deposited by streams in relatively recentgeologic times.Amplification. Modification of the input bedrock ground motion bythe overlying unconsolidated materials. Amplification causes theamplitude of the surface ground motion to be increased in somerange of frequencies and decreased in others. Amplification is afunction of the shear-wave velocity and damping of the unconsoli dated materials, its thickness and geometry, and the strain level ofthe input rock motion.Amplitude. Maximum deviation from mean or center line of wave.Amplitude spectrum. Amplitude versus frequency relation suchas is computed in a Fourier analysis. See Fourier transform.Anisotrophic mass. A material having different properties in dif ferent directions at any given point.Anisotropy. Variation of a physical property depending on theorientation along which it is measured.Anomaly. A deviation from uniformity or normality.Asthenosphere. The layer or shell of the earth below the lithosphere; roughly equivalent to the upper mantle.Attenuation. (1) a decrease of signal amplitude during transmis sion, (2) a reduction in amplitude or energy with or without changeof waveform, or (3) the decrease in seismic signal strength withdistance which depends not only on geometrical spreading but alsomay be related to physical characteristics of the transmittingmedium causing absorption and scattering.Bandpass. Describing a range of frequencies (bandwidth) in whichtransmission is nearly complete while signals at frequencies out side these limits are attenuated substantially.Bar. Equals 1 atmosphere: A unit of pressure, 0.01 kilopascal.Basement. The igneous, metamorphic, or highly folded rock under lying sedimentary units.Bedrock. An solid rock exposed at the surface or underlying soil;has shear-wave velocity greater than 765 m/s at small (0.0001percent) strains. See Firm soil and Soft soil.Body wave. Waves propagated in the interior of a body, that is,compression and shear waves, the P- and S-waves of seismology.Body-wave magnitude, m,,. See Magnitude.Bulk modulus. The ratio of the change in average stress to thechange in unit volume.Capable fault. A fault that has the potential to undergo futuresurface displacement. A fault is capable if: (1) it has had late
VIIICONTENTSQuaternary or more recent movement, or (2) macroseimic activityhas been associated with it, or (3) it has a demonstrated structuralrelation to a known capable fault such that movement of the onemay cause movement of the other, especially during the lifetime ofthe project under consideration.Compression wave. A wave in which an element of the mediumchanges volume without rotation.Converted wave. A wave which is converted from longitudinal totransverse, or vice versa, upon reflection or refraction at obliqueincidence from an interface.Convolution. The change of wave shape as a result of passing asignal through a linear filter.Corner frequency. A spectrum's corner frequency is that fre quency where the high- and low-frequency trends intersect. Thelocation of the corner frequency, , is related to the radius, r, of theequivalent circular fault through the relation r 2ff/r where ft is the shear-wave velocity at the source.Covariance. A statistical regression analysis technique that allowsone to analyze subsets of data having a common characteristicproperty.Critical angle. Angle of incidence, 6C , for which the refracted raygrazes the surface of contact between two media in which the seis mic velocities are v, and v2 .Crust. The outermost portion of the earth, averaging about 30 km,that overlies the Mohorovicic discontinuity.Design earthquake. The largest earthquake that has such a highprobability of occurrence based on studies of historic seismicityand structural geology that it is appropriate to design a structureto withstand it. Ground shaking of the design earthquake might beexceeded, but the probability of this happening is considered to besmall.Design spectra. Spectra appropriate for earthquake-resistant de sign purposes. Design spectra are typically smooth curves thathave been modified from a family of spectra of historic earthquakesto take account of features peculiar to a geographic region and aparticular site. Design spectra do not include the effect of soilstructure interaction.Design time history. One of a family of time histories which pro duces a response spectrum that envelopes the smooth designspectrum, for a selected value of damping, at all periods.Earthquake hazards. The probability that natural events accom panying an earthquake such as ground shaking, ground failure,surface faulting, tectonic deformation, and inundation, which maycause damage and loss of life, will occur at a site during a specifiedexposure time. See Earthquake risk.Earthquake risk. The probability that social or economic conse quences of earthquakes, expressed in dollars or casualties, willequal or exceed specified values at a site during a specified expo sure time.Earthquake waves. Elastic waves propagating in the earth, set inmotion by a sudden change such as faulting of a portion of theearth.Effective peak acceleration. The peak ground acceleration afterthe ground-motion record has been filtered to remove the very highfrequencies that have little influence upon structural response.Effective peak velocity. The peak ground velocity after the groundmotion record has been filtered to remove high frequencies.Epicenter. The point on the Earth's surface vertically above thepoint where the first rupture and the first earthquake motion oc cur.Exceedance probability. The probability (for example, 10 percent)over some period of time that an earthquake will generate a levelof ground shaking greater than some specified level.Exposure time. The period of time (for example, 50 years) that astructure is exposed to the earthquake threat. The exposure time issometimes chosen to be equal to the design lifetime of the struc ture.Failure. A condition in which movement caused by shearing stress es in a structure or soil mass is of sufficient magnitude to destroyor seriously damage it.Fault. A fracture or fracture zone along which displacement of thetwo sides relative to one another has occurred parallel to the frac ture. See Active, Capable, Normal, Thrust and Strike-slipfaults.Filter. That part of a system which discriminates against some ofths information entering it. The discrimination is usually on thebasis of frequency, although other bases such as wavelength maybe used. Linear filtering is called convolution.Finite element analysis. An analysis which uses an assembly offinite elements which are connected at a finite number of nodalpoints to represent a structure or a soil continum.Firm soil. A general term for soil characterized by a shear wavevelocity of 600 to 765 m/s. See Soft soil, Bedrock.Focal depth. The vertical distance between the hypocenter and theepicenter in an earthquake.Focus. The point within the earth which marks the origin of theelastic waves of an earthquake.Forced vibration. Vibration that occurs if the response is imposedby the excitation. If the excitation is periodic and continuing, theoscillation is steady-state.Fourier spectrum. See Amplitude spectrum, Phase response,and Fourier transform.Fourier transform. The mathematical formulas that convert atime function (waveform, seismogram, etc.) G(t) into a function offrequency S(f) and vice versa.Free field. The regions of the medium that are not influenced bymanmade structures, or a medium that contains no such struc tures. It also refers to that region in which boundary effects do notsignificantly influence the behavior of the medium.Free vibration. Vibration that occurs in the absence of forcedvibration.Frequency. Number of cycles occurring in unit time. Hertz (hz) isthe unit of frequency.Gaussian distribution. Equals normal distribution (bell-shapedcurve): A quantity or set of values so distributed about a meanvalue, m, that the probability, e(Aa), of a value lying within aninterval, Aa, centered at the point, a, is:e(Aa) 277X72(72where cr is the standard error of estimate.Geometrical damping. That component of damping due to the ra dial spreading of energy with distance from a given source.Geophone. Sensing device used to measure electronically the rateof travel of sound or force waves transmitted through the earthfrom a known source.Geophysics. The study of the physical characteristics and prop erties of the earth.Geotechnical. Related to soil mechanics.Grain size. A term relating to the size of mineral particles thatmake up a soil deposit.Ground response, ground motion, seismic response. A generalterm, includes all aspects of ground motion, namely, particle accel eration, velocity, or displacement; stress and strain from a nuclearexplosion, an earthquake, or another energy source.Group velocity. The velocity with which most of the energy in awave train travels. In dispersive media where velocity varies withfrequency, the wave train changes shape as it progresses so thatindividual wave crests appear to travel at a different velocity (thephase velocity) than the overall energy as approximately enclosedby the envelope of the wave train.
CONTENTSHalf-space. A mathematical model bounded only by one plane sur face; that is, the model is so large in other dimensions that only theone boundary affects the results. Properties within the model areassumed to be homogeneous and usually isotropic.Hertz. A unit of frequency; cycles per second (cps).Holocene. The past 10,000 years of geologic time.Hydrostatic pressure. The pressure in a liquid under static condi tions; the product of the unit weight of the liquid (water 1 kg/L)and the difference in elevation between the given point and theground water elevation.Hypocenter. The location in space where the slip responsible for anearthquake occurs; the focus of an earthquake.Hysteresis loop. (1) the stress-strain path of a material under cyc lic loading conditions, or (2) a trace of the lag in the return of anelastically deformed specimen to its original shape after the loadhas been released.Incident angle. The angle which a ray path makes with a perpen dicular to an interface.In situ strength. The in-place strength of a soil deposit.Intensity. A numerical index describing the effects of an earth quake on the earth's surface, on man, and on structures built byhim. The scale in common use in the United States today is theModified Mercalli scale of 1931 with intensity values indicated byRoman numerals from I to XII. The narrative descriptions of eachintensity value are:I. Not felt or, except rarely under especially favorable circum stances. Under certain conditions, at and outside the bound ary of the area in which a great shock is felt: sometimes,birds, animals, reported uneasy or disturbed; sometimesdizziness or nausea experienced; sometimes trees, struc tures, liquids, bodies of water, may sway; doors may swing,very slowly.II. Felt indoors by few, especially on upper floors, or by sensitive,or nervous persons. Also, as in grade I, but often morenoticeably: sometimes hanging objects may swing, espe cially when delicately suspended; sometimes trees, struc tures, liquids, bodies of water, may sway, doors may swing,very slowly; sometimes birds, animals, reported uneasy ordisturbed; sometimes dizziness or nausea experienced.III. Felt indoors by several, motion usually rapid vibration. Some times not recognized to be an earthquake at first. Durationestimated in some cases. Vibration like that due to passingof light, or lightly loaded trucks, or heavy trucks some dis tance away. Hanging objects may swing slightly.Movements may be appreciable on upper levels of tall struc tures. Rocked standing motor cars slightly.IV. Felt indoors by many, outdoors by few. Awakened few, espe cially light sleepers. Frightened no one, unless apprehen sive from previous experience. Vibration like that due topassing of heavy or heavily loaded trucks. Sensation likeheavy body striking building or falling of heavy objects in side. Rattling of dishes, windows, doors; glassware andcrockery clink and clash. Creaking of walls, frame, espe cially in the upper range of this grade. Hanging objectsswung, in numerous instances. Disturbed liquids in openvessels slightly. Rocked standing motor cars noticeably.V. Felt indoors by practically all, outdoors by many or most; out doors direction estimated. Awakened many, or most.Frightened few—slight excitement, a few ran outdoors.Buildings trembled throughout. Broke dishes, glassware, tosome extent. Cracked windows—in some cases, but not gen erally. Overturned vases, small or unstable objects, in manyinstances, with occasional fall. Hanging objects, doors,swing generally or considerably. Knocked pictures againstwall, or swung them out of place. Opened, or closed, doors,VI.VII.VIII.IX.X.IXshutters, abruptly. Pendulum clocks stopped, started or ranfast, or slow. Moved small objects, furnishings, the later toslight extent. Spilled liquids in small amounts from wellfilled open containers. Trees, bushes, shaken slightly.Felt by all, indoors- and outdoors. Frightened many, excite ment general, some alarm, many ran outdoors. Awakenedall. Persons made to move unsteadily. Trees, bushes, shakenslightly to moderately. Liquid set in strong motion. Smallbells rang—church, chapel, school, etc. Damage slight inpoorly built buildings. Fall of plaster in small amount.Cracked plaster somewhat, especially fine cracks in chim neys in some instances. Broke dishes, glassware, in consid erable quantity, also some windows. Fall of knick-knacks,books, pictures. Overturned furniture in many instances.Moved furnishings of moderately heavy kind.Frightened all; general alarm, all ran outdoors. Some, ormany, found it difficult to stand. Noticed by persons drivingmotor cars. Trees and bushes shaken moderately tostrongly. Waves on ponds, lakes, and running water. Waterturbid from mud stirred up. Incaving to some extent of sandor gravel stream banks. Rang large church bells, etc. Sus pended objects made to quiver. Damage negligible in build ings of good design and construction, slight to moderate inwell-built ordinary buildings, considerable in poorly built orbadly designed buildings, adobe houses, old walls (especiallywhere laid up without mortar), spires, etc. Cracked chim neys to considerable extent, walls to some extent. Fall ofplaster in considerable to large amount, also some stucco.Broke numerous windows, furniture to some extent. Shookdown loosened brickwork and tiles. Broke weak chimneys atthe roof-line (sometimes damaging roofs). Fall of cornicesfrom towers and high buildings. Dislodged bricks andstones. Overturned heavy furniture, with damage frombreaking. Damage considerable to concrete irrigationditches.Fright general; alarm approaches panic. Disturbed personsdriving motor cars. Trees shaken strongly—branches,trunks, broken off, especially palm trees. Ejected sand andmud in small amounts. Changes: temporary, permanent; inflow of springs and wells; dry wells renewed flow; in temper ature of spring and well waters. Damage slight in structures(brick) built especially to withstand earthquakes. Consider able in ordinary substantial buildings, partial collapse:racked, tumbled down, wooden houses in some cases; threwout panel walls in frame structures, broke off decayed pil
High-altitude view of the San Francisco Bay region showing surface traces of the Hayward and Calaveras faults. The Hayward fault was the source of two large earthquakes in 1836 and 1868 that ca