Transcription
BIL 151Enzymes: A Sample ExperimentToday you will use the techniques you practiced last week to perform a sample experiment toexamine the effect of sodium chloride (NaCl) on the catalase reaction.I. Experimental Protocol: Reagents and EquipmentBy the end of this session, you should be even more proficient at (1) operating the equipmentconfidently, (2) mixing reagents, (3) collecting data. In addition, you will learn to calculatemolarities and learn that it is critical to keep all conditions of two groups being compared(treatment and control) constant in terms of volume, temperature, and all aspects of the reactionenvironment except the single factor you are varying.The following section is an overview of the chemical reagents and equipment you will haveavailable for your experiments. They are the same as last week, with the addition of NaCl.A. Chemical ReagentsYou will be provided with reactant (hydrogen peroxide in aqueous phosphate buffer) andenzyme (catalase in living yeast cells). NOTE: A solution is a liquid in which a solute is dissolved.A suspension is a liquid in which solid particles are floating. Suspensions always should be mixedthoroughly before use, to ensure an accurate concentration of reactant throughout the liquid.1. Catalase (in living yeast cells)Catalase is type of peroxidase enzyme made up of four interlocked polypeptide subunitslinked to an iron-containing heme complex. Yeast catalase has a total molecular weight of 248,000g/mole (Seah and Kaplan, 1972). Under optimum conditions, this highly efficient enzyme catalyzesthe breakdown of millions of hydrogen peroxide molecules per second.The stock yeast suspension we have provided for you contains 70g of yeast per 1L of stock pH7.0 sodium phosphate buffer solution.2. Hydrogen peroxideHydrogen peroxide (H2O2) is a powerful oxidizing agent produced as a toxic byproduct ofaerobic metabolism. Without rapid enzymatic catalysis, H202 would quickly destroy essentialbiomolecules in a living cell, resulting in cell damage and death.We have provided pre-mixed H2O2 stock solution consisting of of 33ml of 30-volume (9.1%)H2O2 added to IL of pH 7.0 sodium phosphate buffer. You will need to calculate the percentageH2O2 of this phosphate/peroxide solution to present in your presentation.3. Phosphate bufferThe pH of a solution expresses its acidity or alkalinity on a logarithmic scale. A solution with apH of 7.0 is neutral. Values higher than 7.0 are alkaline/basic, and values lower than 7.0 areacidic. The higher the pH, the more alkaline/basic the solution, and the lower the pH, the moreacid the solution.Buffers maintain constant pH in solution. Buffer systems are widespread in living cells andorganisms, where they help maintain homeostasis. Buffers are often used in experimentsexamining biological functions, to mimic living cell conditions as closely as possible. You will beprovided with a stock solution of pH 7.0 (neutral) phosphate buffer for your experiments.4. Sodium Chloride (NaCl) solutionSodium chloride has been shown to increase peroxidase activity in several different species.As a practice exercise, your team will explore the effects of sodium chloride concentration on theactivity of yeast catalase. We have provided you with a stock solution of 1M NaCl in water.(c) 2013 Dana Krempels, PhD -1
B. Experimental Workstation and EquipmentBefore you begin, check your laboratory workstation for cleanliness, and to be sure all thematerials listed below are present and in good working order. If something is not right, checkwith your laboratory instructor for replacements.1. Your Lab WorkstationCheck your lab workstation to be sure all the following equipment is present.Consider: Do you trust the students who used this workstation before you tohave left it perfect for the next team? Neither do we. So before using any ofthe equipment, wash every piece well, and rinse with distilled water. This is agood rule of thumb for lab work in most situations.Stock solutions of yeast suspension, hydrogen peroxide (H2O2) solution, pH7 phosphate buffer,and 1M sodium chloride (NaCl) solution can be found in the center of each lab bench, in labeledbeakers, covered with a watchglass. Always re-cover reagents after taking your share.Stirring rods should be used to stir stock yeast suspension. Always replace stirring rods intheir labeled containment beaker when you are finished using them.Your Team’s Research StationAt your team’s lab station (one station is located at each end of each lab bench), there shouldbe one Vernier O2 sensor probe in its box (stored UPRIGHT), one plastic Vernier respirationchamber (Figure 1), closed with a plastic cap, and one clean, dry beaker labeled "probe" for storingyour O2 probe upright.To connect the probe to your laptop computer, you will need the Vernier adaptor cable. This iseither in the box with your probe, or available at the TA desk at the front of the lab.Your lab station should also be equipped with a tray bearing each of the following: 250 ml beaker labeled "Buffer pH 7"150 ml beaker labeled "Yeast"250 ml beaker labeled "H2O2"150 ml beaker labeled "1 M NaCl"3 x 100 ml glass beakers2 x 50 ml plastic graduated cylinders10 cc syringe labeled "yeast"1 cc syringe labeled "water"5 cc syringe labeled "water"1 cc syringe labeled "NaCl"2 glass stirring rods1 roll of labeling tape1 Sharpie marker1 small pair of scissors 1 DRY 400 ml beaker labeled "O2Sensor" and "Keep Dry"1 box of Kimwipes1 plastic Vernier respirationchamber with cap1 Vernier O2 probe, upright, inits cardboard box1 x 1 L flask labeled "WASTE"and a blank piece of tape aboveit (to indicate what type ofchemical waste)Before you leave lab today, be sure all the items listed above are neatly replaced on your tray andthat all spills are wiped up.TEAMS WHO LEAVE LAB WORKSTATIONS DIRTY WILL BE DOCKED FIVE POINTS.2. Your Oxygen Sensor EquipmentYou will use an electrochemical O2 sensor (Vernier Software, www.vernier.com) to detect O2gas generated by the decomposition of hydrogen peroxide. Each team member should participatein all aspects of the experiment, and be able to explain the rationale for all methods. Remember(c) 2013 Dana Krempels, PhD -2
that while you should delegate tasks to different team members, the same team member shouldperform a particular task throughout the data collection period. (By now, you know why.)3. Setting up the O2 sensor and data logger softwareOne team member with a laptop or other electronic device should volunteer it for data collection.1. Download the necessary software lite/#downloadif you have not already done so.2. After you have installed the software, connect the O2 gas sensor and interface to the USB port onyour electronic device. Keep the O2 sensor upright at all times! Treat it with extreme careor you may damage it. Students who damage probes through negligence will bepenalized by losing points.3. Click on the Logger Lite 1.4 icon to open the software.4. The software will detect the sensor and load a data table and graph. You are now ready tocollect data.4. Collecting data with the O2 sensorTo review using the O2 sensor, follow these instructions to compare the O2 concentration of yourexhaled breath with that of the atmosphere.1. Carefully and gently, place the O2 gas sensor into the plastic reaction chamber a shown inFigure 1. Gently push the sensor down until it stops. The sensor is designed to seal thechamber without unnecessary force.2. Click “Collect” on the toolbar at the top of the Logger Lite window. The sensor will startmeasuring, 1x per second, the O2 concentration (as %O2) of the air in the chamber. Note thatthe current %O2 is displayed in the lower left corner of the window, while the readings overtime are displayed on the data table and graph.3. When the %O2 value has stabilized, click “Stop” on the toolbar.4. Record the %O2 value.5. Click “Store” on the toolbar to store this data run, and ready the software for the next.6. Gently remove the O2 sensor and place it upright in its dry holding beaker.7. Breathe several times into the reaction chamber. Try to replace the air in the chamber withyour exhaled breath.8. Quickly, but still carefully and gently, place the O2 sensor into the chamber as in step #1 above.9. Collect data as in steps 2-6 above.10. Click “Save” to save the results of this exercise.11. Gently remove the O2 sensor from the chamber and place it upright in its beaker.Results:What is the % concentration of O2 in the atmosphere?What is the % concentration of O2 in your exhaled breath?How long did it take the O2 sensor to detect fully the %O2?C. Performing a Practice Experiment(designed by Alesia Sharber)You are now ready to study the rate of reaction of catalase in living yeast cells. First, you will do(c) 2013 Dana Krempels, PhD -3
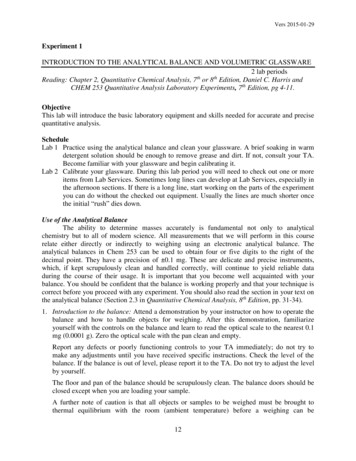
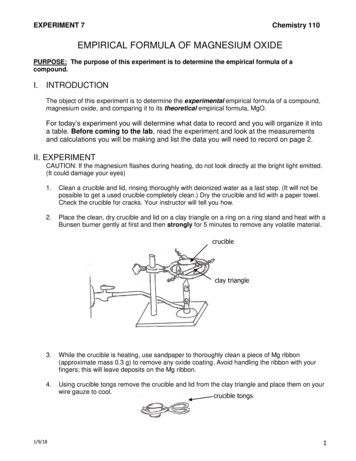
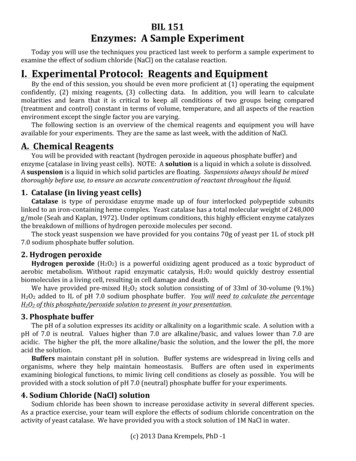
three preliminary (control) trials, both to gain experience with the method and to studyexperimental variability (which, as you will recall, is NOT the same as human error). The datayou collect will be in the form of a rate curve similar to the one shown in Figure 1. (Note how theordinate (y-axis) and abscissa (x axis) in Figure 1 are properly labeled. Be sure all your figures areproperly labeled!)Figure 1. Oxygen generated by the catalysis of hydrogen peroxide by catalaseRecall that yeast use catalase (a type of peroxidase) to break down toxic hydrogen peroxideinto harmless water and oxygen. Over the course of your project, you may use the terms “catalase”and “peroxidase” interchangeably, but understand that while catalase is a peroxidase, not allperoxidases are catalase. There. We feel better about that now.Today you’re going to conduct an experiment to determine how catalase functions at differention concentrations. Below, you will find an example of a proper scientific proposal and protocol.After you complete this sample experiment, you will be better prepared to design your ownexperiment to perform in the next lab session. Remember, this is only an example of how tocreate your own experiment. You will be choosing a parameter other than salt tolerancewhen you develop your own original project.1. Building a HypothesisBefore you begin any experiment, you must collect observations in your area of researchalready made by scientists and published in peer-reviewed literature. For our sampleexperiments, we will study the effects of changing sodium chloride (NaCl) concentration on theactivity of catalase. A literature search reveals that some research already has been done in thisarea, and we learn that Increased NaCl concentration has been shown to increase peroxidase activity in thehalophytic archaen, Halobacterium halobium (Brown-Peterson 1993). Many plants show an increase in peroxidase activity when experiencing salt stress. In onestudy on rice (Oryza sativa), salt stress was induced by immersing the plant’s roots in 0.1MNaCl for 48 hours (Swapna 2003). Wild-type Saccharomyces cereviseae does have some degree of salt tolerance.Concentrations of 0.3M NaCl induced stress responses after 45 minutes of exposure (Lewis1995).(c) 2013 Dana Krempels, PhD -4
Based on this information, we ask the question, “How would an increase in NaCl concentration(from 0M to 0.3M) affect the rate of O2 molecules produced by yeast (Saccharomyces cereviseae) inthe presence of hydrogen peroxide?”Because we already have learned that increased NaCl concentration increases catalase activity,our proposed answer to this question--our hypothesis--is, “In the peroxidase reaction that resultsfrom the addition of hydrogen peroxide to a yeast (Saccharomyces cereviseae) solution, the rate ofoxygen production will be significantly higher in a solution with a 0.3M NaCl concentration whencompared to that in a solution with a 0M NaCl concentration.” (More simply stated, we arepredicting that increasing NaCl concentration in a yeast suspension from 0M to 0.3M will increasethe rate of the peroxidase reaction.)The above hypothesis is based on some known facts and some educated assumptions. Here isthe reasoning we might use to justify the hypothesis and experimental design: Although the structure of peroxidases varies across different groups (bacteria, fungi,plants), all peroxidases display the same basic four-heme structure (Brown-Peterson1993). Since the structure is similar between groups and multiple groups display the sameincrease in peroxidase activity when exposed to salt, peroxidase activity in Saccharomycescereviseae should follow this same trend. Former studies exposed their study organism to a NaCl solution for some time beforeobserving a stress response or measuring increased peroxidase activity, so we will do thesame. (Swapna 2003, Lewis 1995)We now must define what outcomes will support the hypothesis. We predict that, “If ionconcentration positively affects the peroxidase reaction, then the observed maximum rate ofoxygen production will be higher in the 0.3M NaCl solution than in the 0M NaCl solution.”2. Experimental Design – Measuring Reagents in AdvanceBefore starting an experiment, always develop a solid plan to follow. Poor preparation leads tomistakes, which leads to having to throw out collected data and start over. All calculations neededfor mixing reagents should be done in advance so that the protocol will be complete beforebeginning any step of the experiment. Stock solution was made by adding 70g of yeast to 1L of pH 7 sodium phosphate buffersolution. Stock solution of hydrogen peroxide solution was made by adding 33mL of 30-volume(9.1%) hydrogen peroxide to 1L of pH 7 sodium phosphate buffer solution. Each reaction will require 10mL of yeast suspension and 20mL of H2O2.You will perform three trials each of both the control and experimental/treatment group. Giventhis information, how much stock solution will you need?Remember: gram is abbreviated g one mole 6.02 x 10²³ particles. Molar solution (moles/liter) is abbreviated M liter is abbreviat
Catalase is type of peroxidase enzyme made up of four interlocked polypeptide subunits linked to an iron-containing heme complex. Yeast catalase has a total molecular weight of 248,000 g/mole (Seah and Kaplan, 1972). Under optimum conditions, this highly efficient enzyme catalyzes